Analysis of Internal and External Strategies of Overseas Family School
VerifiedAdded on 2023/06/14
|12
|2618
|342
AI Summary
This report evaluates the internal and external strategies of Overseas Family School (OFS) and sheds light on the financial performance of OFS over the years. The report provides investors with assistance in investment decision-making. The report discusses internal growth, external growth, strategic changes based on financial analysis, trend analysis of OFS, computation of financial ratios, ratio analysis, recommendations and conclusion.
Contribute Materials
Your contribution can guide someone’s learning journey. Share your
documents today.
Running head: PRIVATE EQUITY
Private Equity
Name of the Student
Name of the University
Author’s Note
Private Equity
Name of the Student
Name of the University
Author’s Note
Secure Best Marks with AI Grader
Need help grading? Try our AI Grader for instant feedback on your assignments.
1PRIVATE EQUITY
Table of Contents
Introduction......................................................................................................................................2
Internal growth.................................................................................................................................2
External Growth...............................................................................................................................3
Strategic Changes based on Financial Analysis..............................................................................4
Trend analysis of Overseas Family School.................................................................................4
Computation of financial ratios...................................................................................................6
Ratio analysis...............................................................................................................................7
Recommendations............................................................................................................................8
Conclusion.......................................................................................................................................9
References......................................................................................................................................10
2PRIVATE EQUITY
Introduction
The main aim of this report is to make an analysis and evaluation of the internal as well
as external strategies of Overseas Family School (OFS). The main objective behind this
evaluation of OFS’s strategic position is to identify the positive aspects of the performance of the
company so that it can attract the attention of the investors. Investors use to consider different
aspects of the performance of the companies before making major investment decisions (Hitt,
Ireland & Hoskisson, 2012). In this context, some of the major considerable aspects by the
investors are internal growth, external growth, financial growth, strategic changes and others.
Financial performance is considered as the most important aspect for the investors in order to
make investment decisions as good financial health of the companies always attracts the
attention of the investors. OFS is one of the leading English language schools for the overseas
families living in Singapore. OFS was founded in the year of 1991 (ofs.edu.sg, 2018). This report
sheds light on both the internal and external growth of OFS. The report also discusses about the
financial performance of OFS over the years for providing the investors with assistance in
investment decision-making.
Internal growth
According to the earlier discussion, it can be observed that internal growth of business is
a major considerable factor for the investors in order to make investment-decisions. Internal
growth, also known as organic growth, happens when there is a business expansion in its own
business operations without relying on any kind of takeovers and mergers (Sherman, 2014).
There is not any exception of this fact in case of OFS. It needs to be mentioned that there has
been major internal growth of OFS over the years. When started in 1991, OFS was operating in a
3PRIVATE EQUITY
temporary site. However, OFS invested their capital in their internal expansion; and in the year
2015, OFS moved to a newly built campus (businesstimes.com.sg, 2018). The design of this new
campus is considered as the school design of the future where there are unique technologies to
support the advanced learning of the students. It implies that OFS also makes major investments
in technological development (businesstimes.com.sg, 2018).
Apart from this, OFS also make investments for the development of their campus. OFS
has made major internal expansion with the development of some of the major aspects; like
establishment of library students from all classes, establishment of multi-purpose auditorium,
Black Box Theater for differences purposes, swimming pools and different types of activity
rooms (businesstimes.com.sg, 2018). Apart from these, OFS has expanded their learning
curriculums in order to cater to the needs of all types of students with the introduction of
different curriculum like International Primary Curriculum (IPC), International General
Certificate of Secondary Education (IGCSE), International Baccalaureate Diploma Program and
many others (businesstimes.com.sg, 2018). In this context, it needs to be mentioned that OFS has
invested large amount of capital for the introduction of advanced technology in the learning
process; and the introduction of Math-Coding technology can be presented as example in this
aspect. The above discussion provides some major evidences of the occurrence of strong internal
growth within the organizations. Most important, the crucial aspect is that OFS does not depend
on any takeover or merger for this internal expansion.
External Growth
External growth refers to the ways adopted by the business organization in order to
increase the value of the organizations. Thus, it can be seen that external growth of the
Secure Best Marks with AI Grader
Need help grading? Try our AI Grader for instant feedback on your assignments.
4PRIVATE EQUITY
companies is largely depends on the development of external strategies. There is not any
exception of this fact in case of OFS as the school has developed some of the major strategies for
ensuring external growth. In the recent years, the major business strategy of OFS has been to
increase the amount of student enrollment with the help of the expansion of the capacity to
approximately 5000 in the campus. Another major strategy of OFS is to fully leverage the
expertise of the management in order to explore the opportunities of business collaboration, joint
venture, acquisition, investment opportunities and others (oel.listedcompany.com, 2018).
It needs to be mentioned that the main aim of OFS is to deliver quality educational
services in order to ensure the external growth of the organization. In this aspect, one of the
major targets of OFS is the conservative maintenance of the organizational expenditure in order
to increase profitability. Apart from this, OFS is also eyeing on the opportunity of foreign direct
investment in order to ensure their business growth (oel.listedcompany.com, 2018). Thus, from
the above discussion, it can be observed that OFS has developed effective strategies in different
business aspects in order to ensure the external growth of their business and it can be considered
as a major positive for the investors.
Strategic Changes based on Financial Analysis
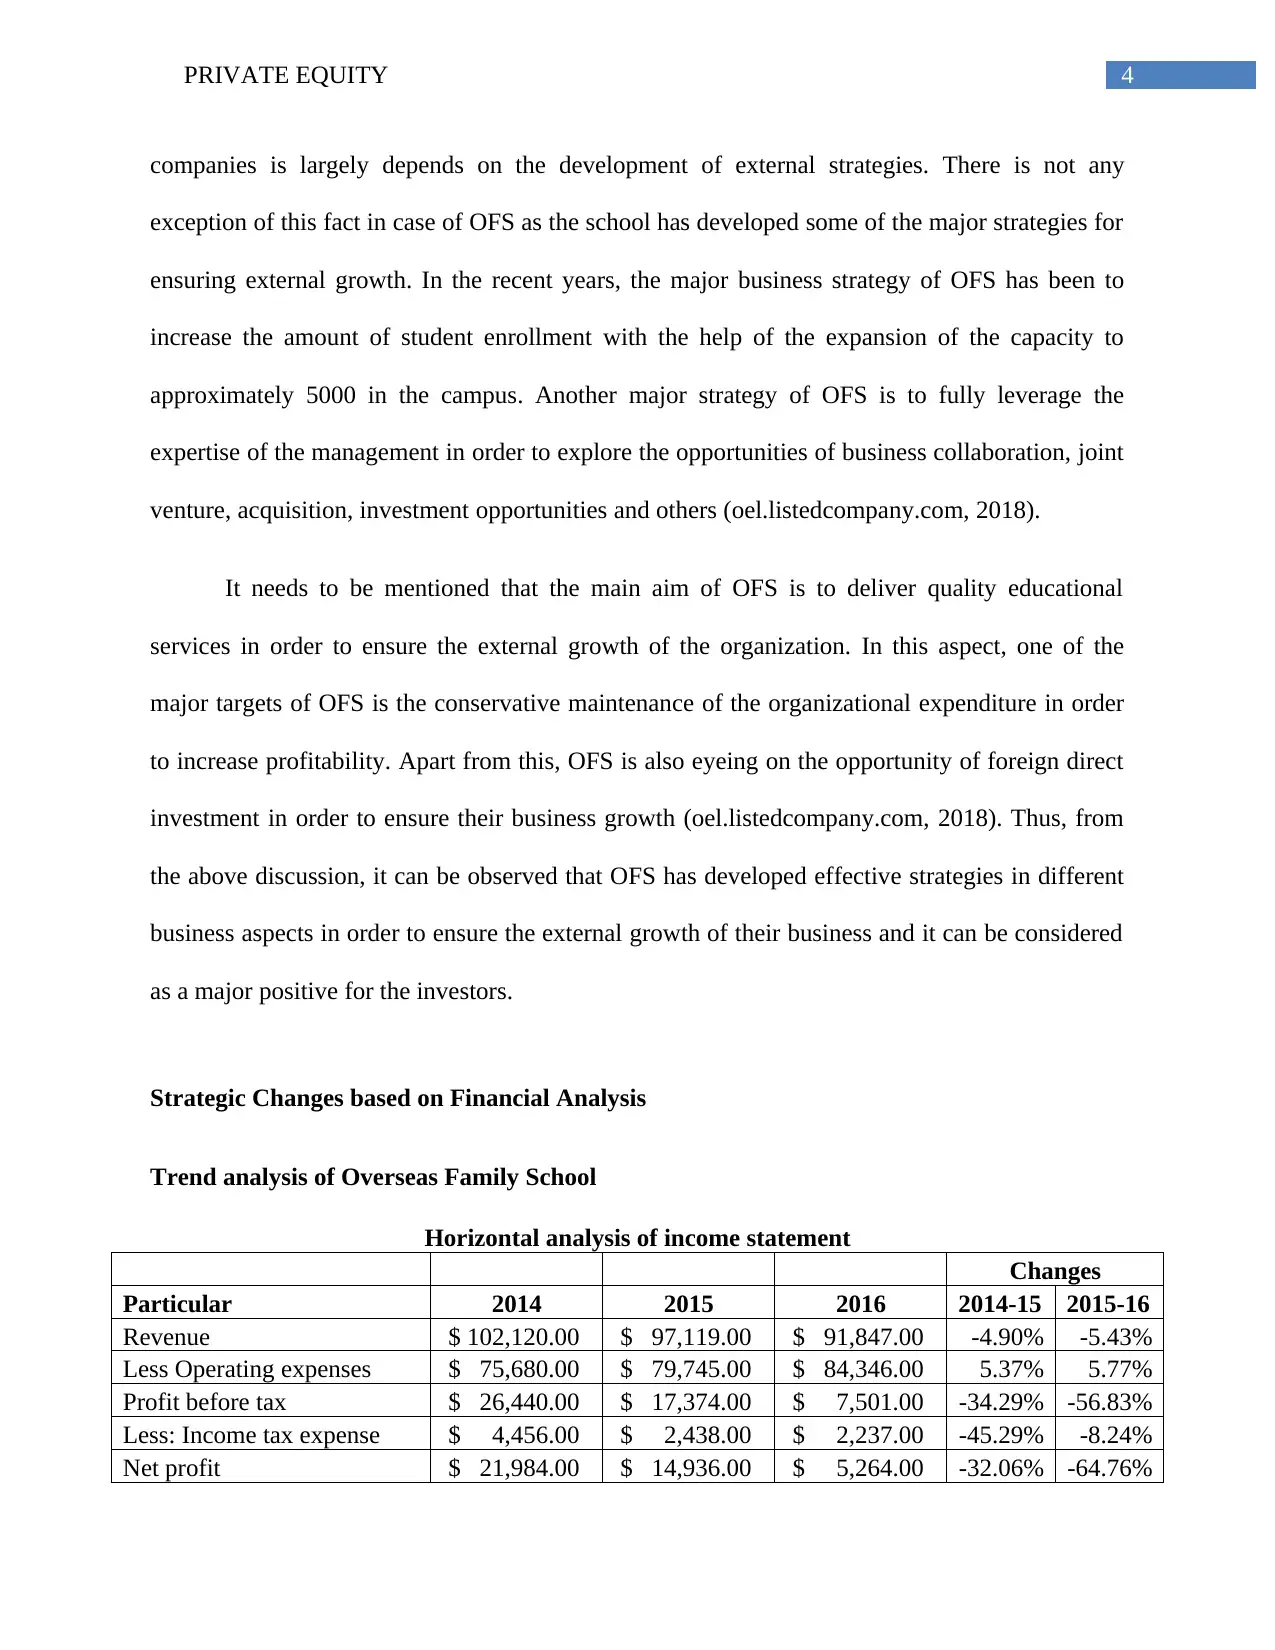
Trend analysis of Overseas Family School
Horizontal analysis of income statement
Changes
Particular 2014 2015 2016 2014-15 2015-16
Revenue $ 102,120.00 $ 97,119.00 $ 91,847.00 -4.90% -5.43%
Less Operating expenses $ 75,680.00 $ 79,745.00 $ 84,346.00 5.37% 5.77%
Profit before tax $ 26,440.00 $ 17,374.00 $ 7,501.00 -34.29% -56.83%
Less: Income tax expense $ 4,456.00 $ 2,438.00 $ 2,237.00 -45.29% -8.24%
Net profit $ 21,984.00 $ 14,936.00 $ 5,264.00 -32.06% -64.76%
companies is largely depends on the development of external strategies. There is not any
exception of this fact in case of OFS as the school has developed some of the major strategies for
ensuring external growth. In the recent years, the major business strategy of OFS has been to
increase the amount of student enrollment with the help of the expansion of the capacity to
approximately 5000 in the campus. Another major strategy of OFS is to fully leverage the
expertise of the management in order to explore the opportunities of business collaboration, joint
venture, acquisition, investment opportunities and others (oel.listedcompany.com, 2018).
It needs to be mentioned that the main aim of OFS is to deliver quality educational
services in order to ensure the external growth of the organization. In this aspect, one of the
major targets of OFS is the conservative maintenance of the organizational expenditure in order
to increase profitability. Apart from this, OFS is also eyeing on the opportunity of foreign direct
investment in order to ensure their business growth (oel.listedcompany.com, 2018). Thus, from
the above discussion, it can be observed that OFS has developed effective strategies in different
business aspects in order to ensure the external growth of their business and it can be considered
as a major positive for the investors.
Strategic Changes based on Financial Analysis
Trend analysis of Overseas Family School
Horizontal analysis of income statement
Changes
Particular 2014 2015 2016 2014-15 2015-16
Revenue $ 102,120.00 $ 97,119.00 $ 91,847.00 -4.90% -5.43%
Less Operating expenses $ 75,680.00 $ 79,745.00 $ 84,346.00 5.37% 5.77%
Profit before tax $ 26,440.00 $ 17,374.00 $ 7,501.00 -34.29% -56.83%
Less: Income tax expense $ 4,456.00 $ 2,438.00 $ 2,237.00 -45.29% -8.24%
Net profit $ 21,984.00 $ 14,936.00 $ 5,264.00 -32.06% -64.76%
5PRIVATE EQUITY
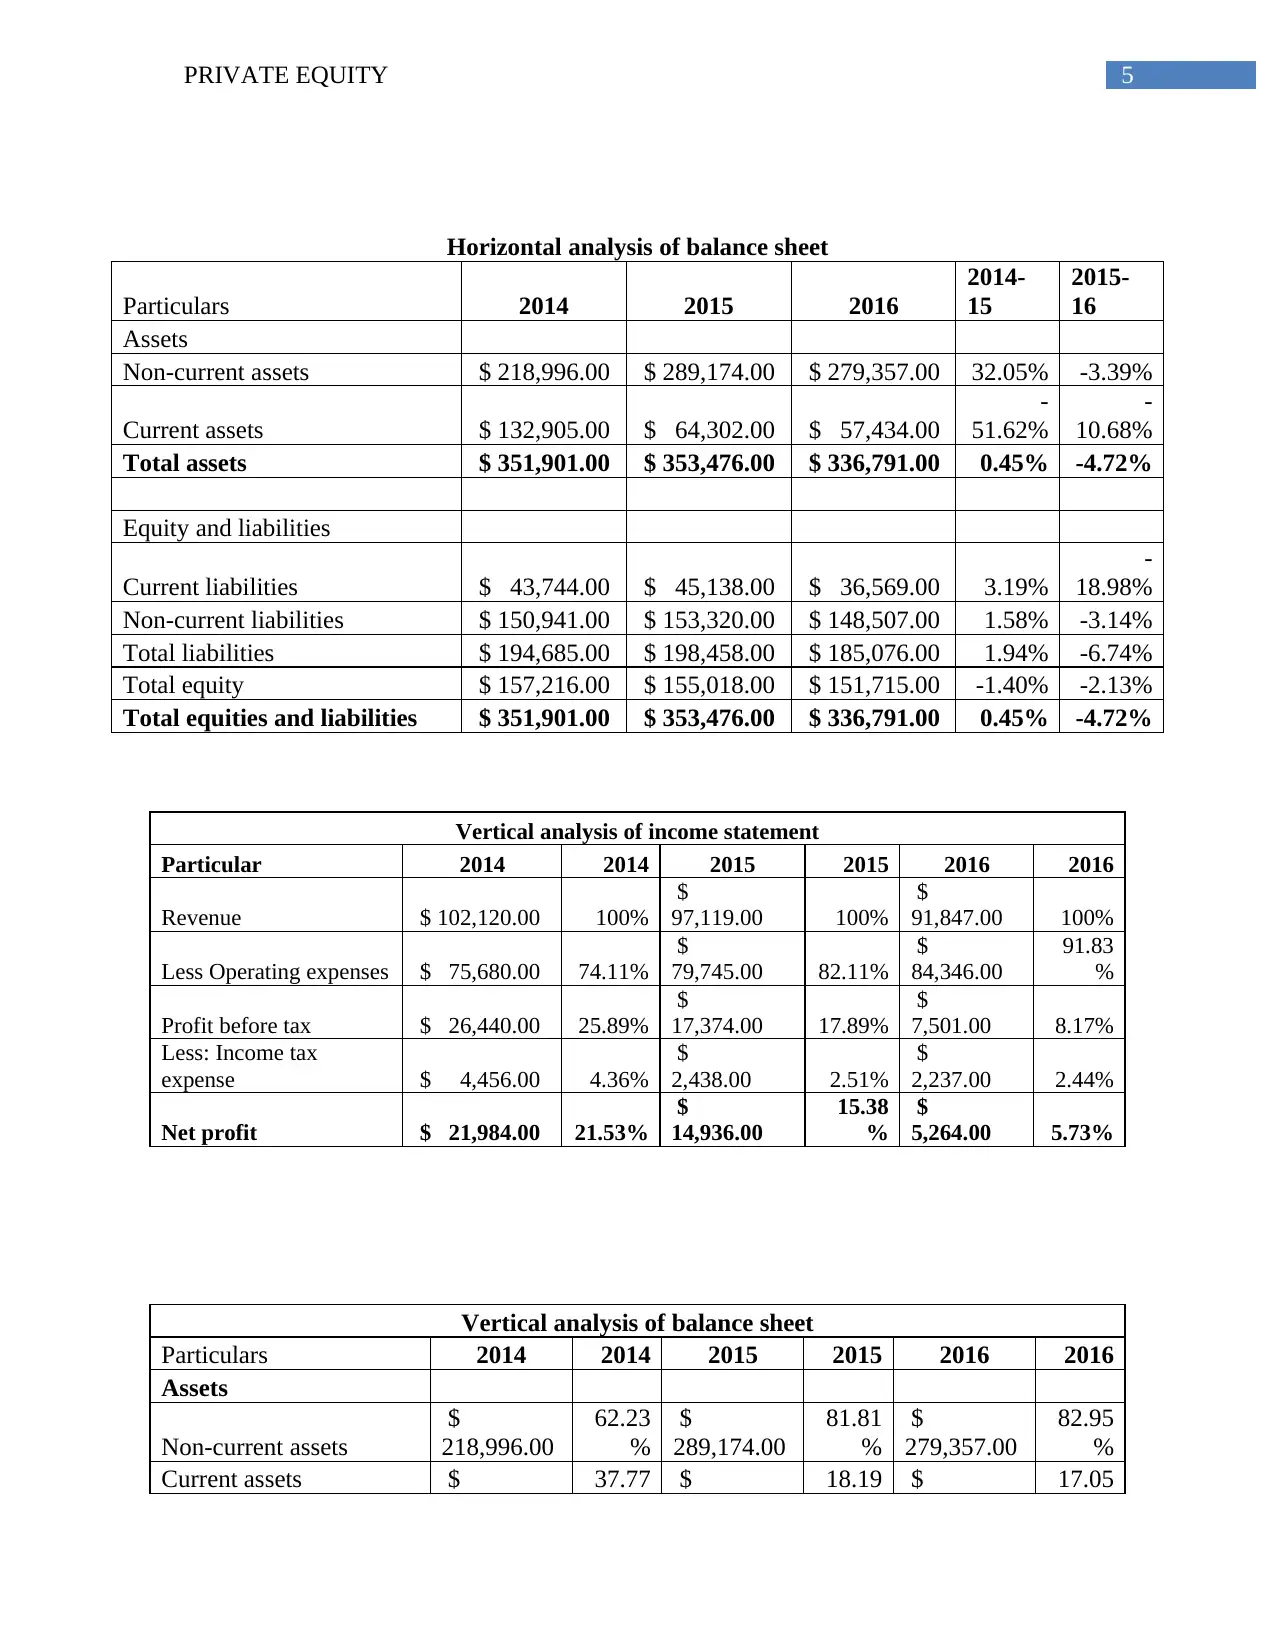
Horizontal analysis of balance sheet
Particulars 2014 2015 2016
2014-
15
2015-
16
Assets
Non-current assets $ 218,996.00 $ 289,174.00 $ 279,357.00 32.05% -3.39%
Current assets $ 132,905.00 $ 64,302.00 $ 57,434.00
-
51.62%
-
10.68%
Total assets $ 351,901.00 $ 353,476.00 $ 336,791.00 0.45% -4.72%
Equity and liabilities
Current liabilities $ 43,744.00 $ 45,138.00 $ 36,569.00 3.19%
-
18.98%
Non-current liabilities $ 150,941.00 $ 153,320.00 $ 148,507.00 1.58% -3.14%
Total liabilities $ 194,685.00 $ 198,458.00 $ 185,076.00 1.94% -6.74%
Total equity $ 157,216.00 $ 155,018.00 $ 151,715.00 -1.40% -2.13%
Total equities and liabilities $ 351,901.00 $ 353,476.00 $ 336,791.00 0.45% -4.72%
Vertical analysis of income statement
Particular 2014 2014 2015 2015 2016 2016
Revenue $ 102,120.00 100%
$
97,119.00 100%
$
91,847.00 100%
Less Operating expenses $ 75,680.00 74.11%
$
79,745.00 82.11%
$
84,346.00
91.83
%
Profit before tax $ 26,440.00 25.89%
$
17,374.00 17.89%
$
7,501.00 8.17%
Less: Income tax
expense $ 4,456.00 4.36%
$
2,438.00 2.51%
$
2,237.00 2.44%
Net profit $ 21,984.00 21.53%
$
14,936.00
15.38
%
$
5,264.00 5.73%
Vertical analysis of balance sheet
Particulars 2014 2014 2015 2015 2016 2016
Assets
Non-current assets
$
218,996.00
62.23
%
$
289,174.00
81.81
%
$
279,357.00
82.95
%
Current assets $ 37.77 $ 18.19 $ 17.05
6PRIVATE EQUITY
132,905.00 % 64,302.00 % 57,434.00 %
Total assets
$
351,901.00 100%
$
353,476.00 100%
$
336,791.00 100%
Equity and liabilities
Current liabilities
$
43,744.00
12.43
%
$
45,138.00
12.77
%
$
36,569.00
10.86
%
Non-current liabilities
$
150,941.00
42.89
%
$
153,320.00
43.37
%
$
148,507.00
44.09
%
Total liabilities
$
194,685.00
55.32
%
$
198,458.00
56.14
%
$
185,076.00
54.95
%
Total equity
$
157,216.00
44.68
%
$
155,018.00
43.86
%
$
151,715.00
45.05
%
Total equities and
liabilities
$
351,901.00 100%
$
353,476.00 100%
$
336,791.00 100%
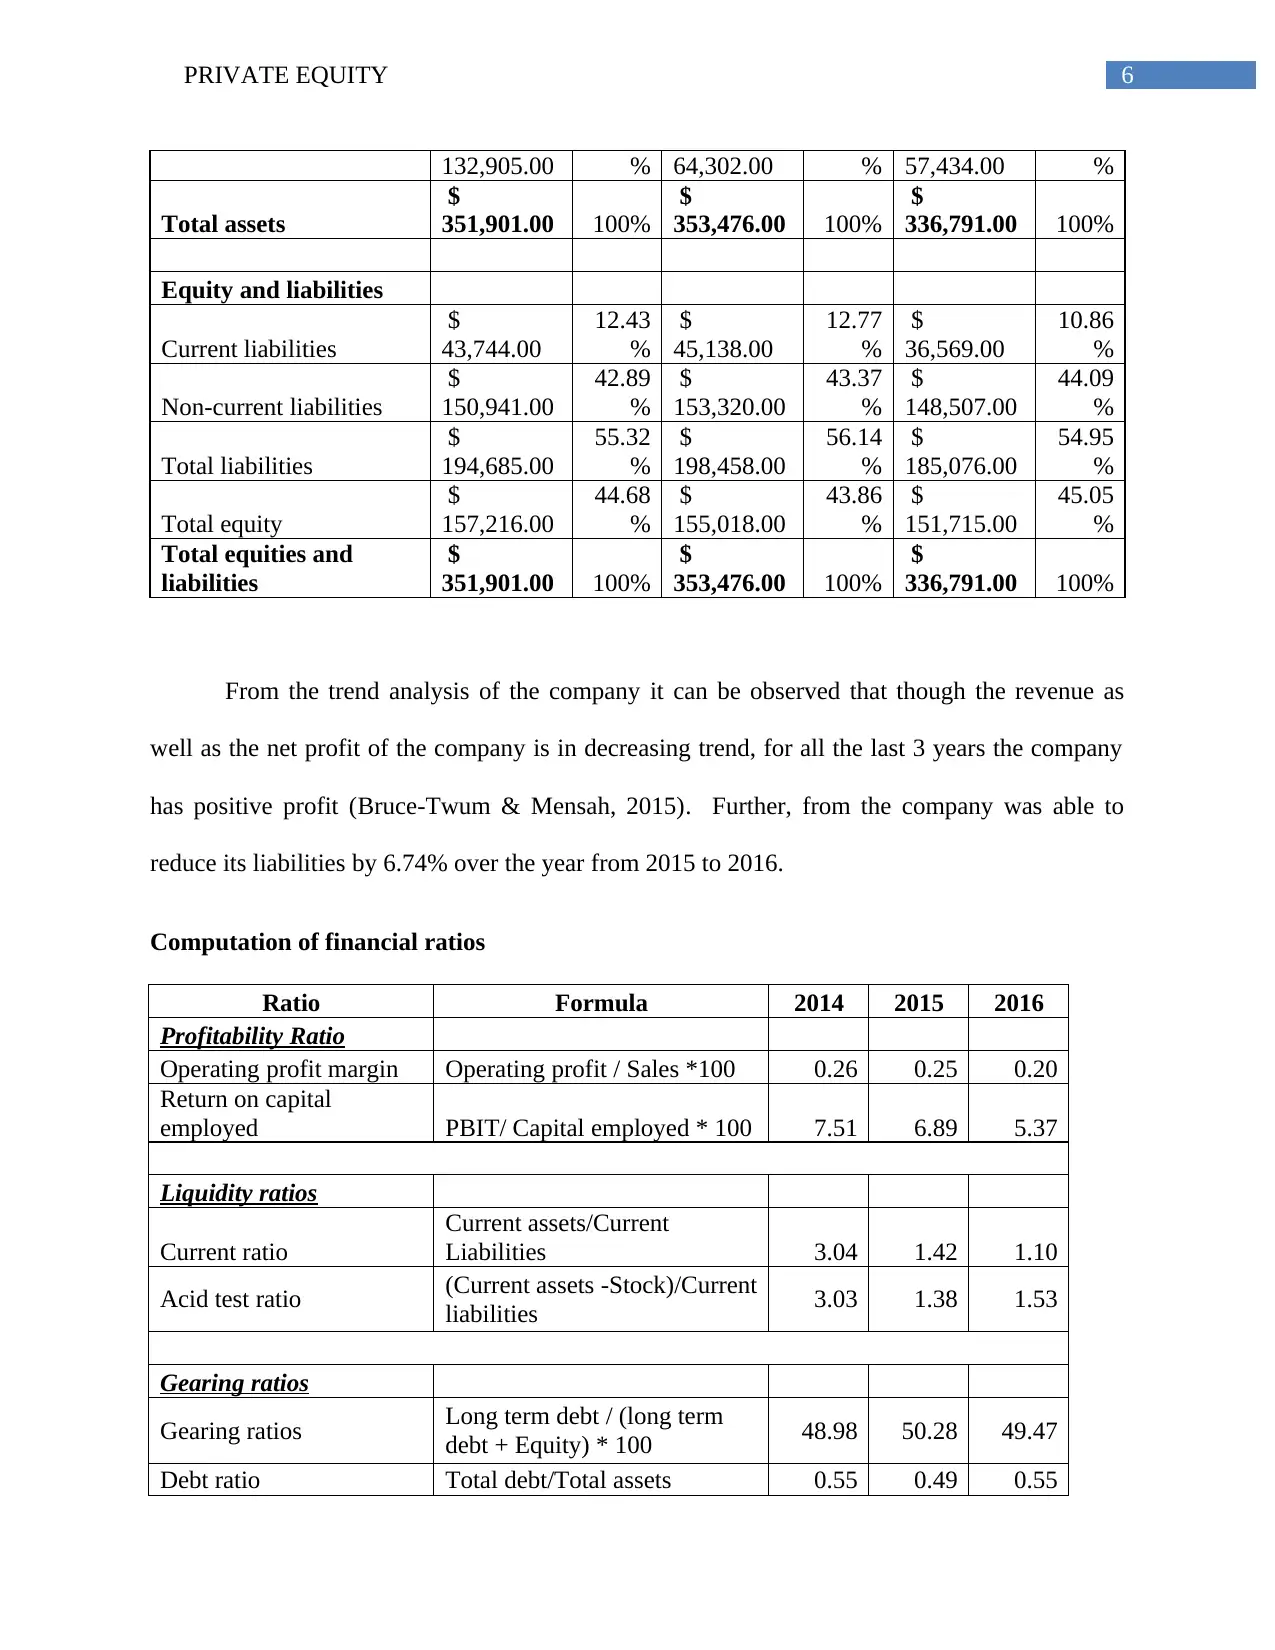
From the trend analysis of the company it can be observed that though the revenue as
well as the net profit of the company is in decreasing trend, for all the last 3 years the company
has positive profit (Bruce-Twum & Mensah, 2015). Further, from the company was able to
reduce its liabilities by 6.74% over the year from 2015 to 2016.
Computation of financial ratios
Ratio Formula 2014 2015 2016
Profitability Ratio
Operating profit margin Operating profit / Sales *100 0.26 0.25 0.20
Return on capital
employed PBIT/ Capital employed * 100 7.51 6.89 5.37
Liquidity ratios
Current ratio
Current assets/Current
Liabilities 3.04 1.42 1.10
Acid test ratio (Current assets -Stock)/Current
liabilities 3.03 1.38 1.53
Gearing ratios
Gearing ratios Long term debt / (long term
debt + Equity) * 100 48.98 50.28 49.47
Debt ratio Total debt/Total assets 0.55 0.49 0.55
132,905.00 % 64,302.00 % 57,434.00 %
Total assets
$
351,901.00 100%
$
353,476.00 100%
$
336,791.00 100%
Equity and liabilities
Current liabilities
$
43,744.00
12.43
%
$
45,138.00
12.77
%
$
36,569.00
10.86
%
Non-current liabilities
$
150,941.00
42.89
%
$
153,320.00
43.37
%
$
148,507.00
44.09
%
Total liabilities
$
194,685.00
55.32
%
$
198,458.00
56.14
%
$
185,076.00
54.95
%
Total equity
$
157,216.00
44.68
%
$
155,018.00
43.86
%
$
151,715.00
45.05
%
Total equities and
liabilities
$
351,901.00 100%
$
353,476.00 100%
$
336,791.00 100%
From the trend analysis of the company it can be observed that though the revenue as
well as the net profit of the company is in decreasing trend, for all the last 3 years the company
has positive profit (Bruce-Twum & Mensah, 2015). Further, from the company was able to
reduce its liabilities by 6.74% over the year from 2015 to 2016.
Computation of financial ratios
Ratio Formula 2014 2015 2016
Profitability Ratio
Operating profit margin Operating profit / Sales *100 0.26 0.25 0.20
Return on capital
employed PBIT/ Capital employed * 100 7.51 6.89 5.37
Liquidity ratios
Current ratio
Current assets/Current
Liabilities 3.04 1.42 1.10
Acid test ratio (Current assets -Stock)/Current
liabilities 3.03 1.38 1.53
Gearing ratios
Gearing ratios Long term debt / (long term
debt + Equity) * 100 48.98 50.28 49.47
Debt ratio Total debt/Total assets 0.55 0.49 0.55
Paraphrase This Document
Need a fresh take? Get an instant paraphrase of this document with our AI Paraphraser
7PRIVATE EQUITY
Ratio analysis
Profitability ratio – the profitability ratios are used as the financial metric for analysing the
ability of the business to generate income after paying off the expenses (Tomczak, 2014).
Generally, the companies with higher profitability ratios are considered better and stable.
Looking at the calculation above it can be observed that the operating profit margin of the
company for the last 3 years is moving between 20% and 30%. Further, the return on the capital
employed of the company is moving between 5% and 7.5% during the last 3 years. Therefore, it
can be said that the profitability position of the company is good.
Liquidity ratio – it indicates whether the current assets of the company are sufficient to meet
short term obligation of the company after they become due. The current ratio and quick ratios
are generally computed to assess the liquidity position of the company. Under the current ratio
the current liabilities of the company is compared with the current assets of the company. On the
other hand, under the quick ratio inventories and prepayments are not taken into consideration in
measuring the current assets. Looking into the calculation table of the ratios it can be observed
that both the current ratios as well as the quick ratios of the company are in decreasing trend
(Palepu, Healy & Peek, 2013). However, the very high liquid ratios indicate that the company is
not using its working capital efficiently. It is observed that the liquid ratios of the company states
that the company has improved with respect to utilization of its current assets.
Gearing ratio – It measure the long-term debt level of the company and compare it to the level
of equity. High gearing ratio represents that the company is highly leveraged and associated with
high level of financial risk. Looking into the gearing ratio of the company it is observed that the
8PRIVATE EQUITY
long term debt of the company as compared to equity for all the 3 years is around 50%. On the
other hand, the debt proportion of total asset is ranged between 50% and 55%. Therefore, it can
be stated that the company has maintained the gearing ratio over all the past years under
consideration (Brochet, Jagolinzer & Riedl, 2013).
Recommendations
From the above discussion, it can be seen that there are many positive aspects in the
business operations of OFS and all these aspects together can fetch healthy returns to the
investors. Based on the above whole discussion, some reasons are provided below for the
investors to invest in OFS:
It can be observed that OFS has been able to maintain effective internal growth for their
business. OFS has been investing in the expansion of their school, introduction of
technology in learning and others. It is a positive aspect for the investors.
Growth can also be seen in case of external factors. The above discussion shows that
OFS has undertaken some major strategies that are helpful for ensuring the external
growth of the company. These factors will be great boost to the investment of the
investors.
From the analysis of the gearing ratio, it can be observed that OFS has effective debt
position where effective proportion of debt and equity can be seen. This is a positive
aspect for the investors of OFS as it reduces the risk related to the investment. However,
in order to maintain this gearing level, OFS needs to use the mix of debt and equity.
9PRIVATE EQUITY
The liquidity analysis also shows the effectiveness of the liquidity position of OFS.
However, at the same time, it is required for OFS to reduce the debit period for the
debtors in order to pay the liabilities.
Thus, in the presence of all of these positives, it is highly recommended to the investors that
they should invest in OFS to get better return.
Conclusion
The above discussion sheds lights on the major factors considered by the investors while
investing in any company like internal growth of the company, external growth, financial
performance and others. The above discussion indicates towards the internal as well as external
growth of OFS that re highly beneficial for the investors. At the same time, the financial analysis
part also indicates good financial performance of the company. In the presence of all these
aspects, the investors can invest in OFS to get high return.
Secure Best Marks with AI Grader
Need help grading? Try our AI Grader for instant feedback on your assignments.
10PRIVATE EQUITY
References
Brochet, F., Jagolinzer, A. D., & Riedl, E. J. (2013). Mandatory IFRS adoption and financial
statement comparability. Contemporary Accounting Research, 30(4), 1373-1400.
Bruce-Twum, E., & Mensah, C. C. (2015). Financial Statement Analysis.
Gandhi, R. (2018). Overseas Family School. The Business Times. Retrieved 28 March 2018,
from http://www.businesstimes.com.sg/specials/overseas-family-school/
Hitt, M. A., Ireland, R. D., & Hoskisson, R. E. (2012). Strategic management cases:
competitiveness and globalization. Cengage Learning.
Investor Relations: Business Strategies and Future Plans. (2018). Oel.listedcompany.com.
Retrieved 28 March 2018, from http://oel.listedcompany.com/future_plans.html
Investor Relations: Financials. (2018). Oel.listedcompany.com. Retrieved 28 March 2018, from
http://oel.listedcompany.com/financials.html
Overseas Family School - Background. (2018). Ofs.edu.sg. Retrieved 28 March 2018, from
https://www.ofs.edu.sg/about-ofs/background/
Palepu, K. G., Healy, P. M., & Peek, E. (2013). Business analysis and valuation: IFRS edition.
Cengage Learning.
Sherman, H. J. (2014). The business cycle: growth and crisis under capitalism. Princeton
University Press.

11PRIVATE EQUITY
Tomczak, S. (2014). Comparative analysis of liquidity ratios of bankrupt manufacturing
companies. Business & Economic Horizons, 10(3).
Tomczak, S. (2014). Comparative analysis of liquidity ratios of bankrupt manufacturing
companies. Business & Economic Horizons, 10(3).
1 out of 12


Your All-in-One AI-Powered Toolkit for Academic Success.
+13062052269
info@desklib.com
Available 24*7 on WhatsApp / Email
![[object Object]](/_next/static/media/star-bottom.7253800d.svg)
Unlock your academic potential
© 2024 | Zucol Services PVT LTD | All rights reserved.