Financial Management: Analysis of P-Rec and T-Rec Projects
VerifiedAdded on 2023/04/23
|12
|2257
|248
AI Summary
The report analyses the P-Rec project in detail as per the demand of the company’s CFO. It will analyse the cost involved with the project and expected earnings from the same. The report will compare P-Rec with T-Rec and accordingly recommendation regarding both the projects will be provided.
Contribute Materials
Your contribution can guide someone’s learning journey. Share your
documents today.

Running head: FINANCIAL MANAGEMENT
Financial management
Name of the student
Name of the university
Student ID
Author note
Financial management
Name of the student
Name of the university
Student ID
Author note
Secure Best Marks with AI Grader
Need help grading? Try our AI Grader for instant feedback on your assignments.

1FINANCIAL MANAGEMENT
Executive summary
The aim of the report is to analyse the P-Rec project in detail as per the demand of the
company’s CFO. It will analyse the cost involved with the project and expected earnings
from the same. As the project is considered to have adverse impact on the health of the users
it will analyse another alternative project T-Rec that is less harmful and less effective. The
report will compare P-Rec with T-Rec and accordingly recommendation regarding both the
projects will be provided.
2FINANCIAL MANAGEMENT
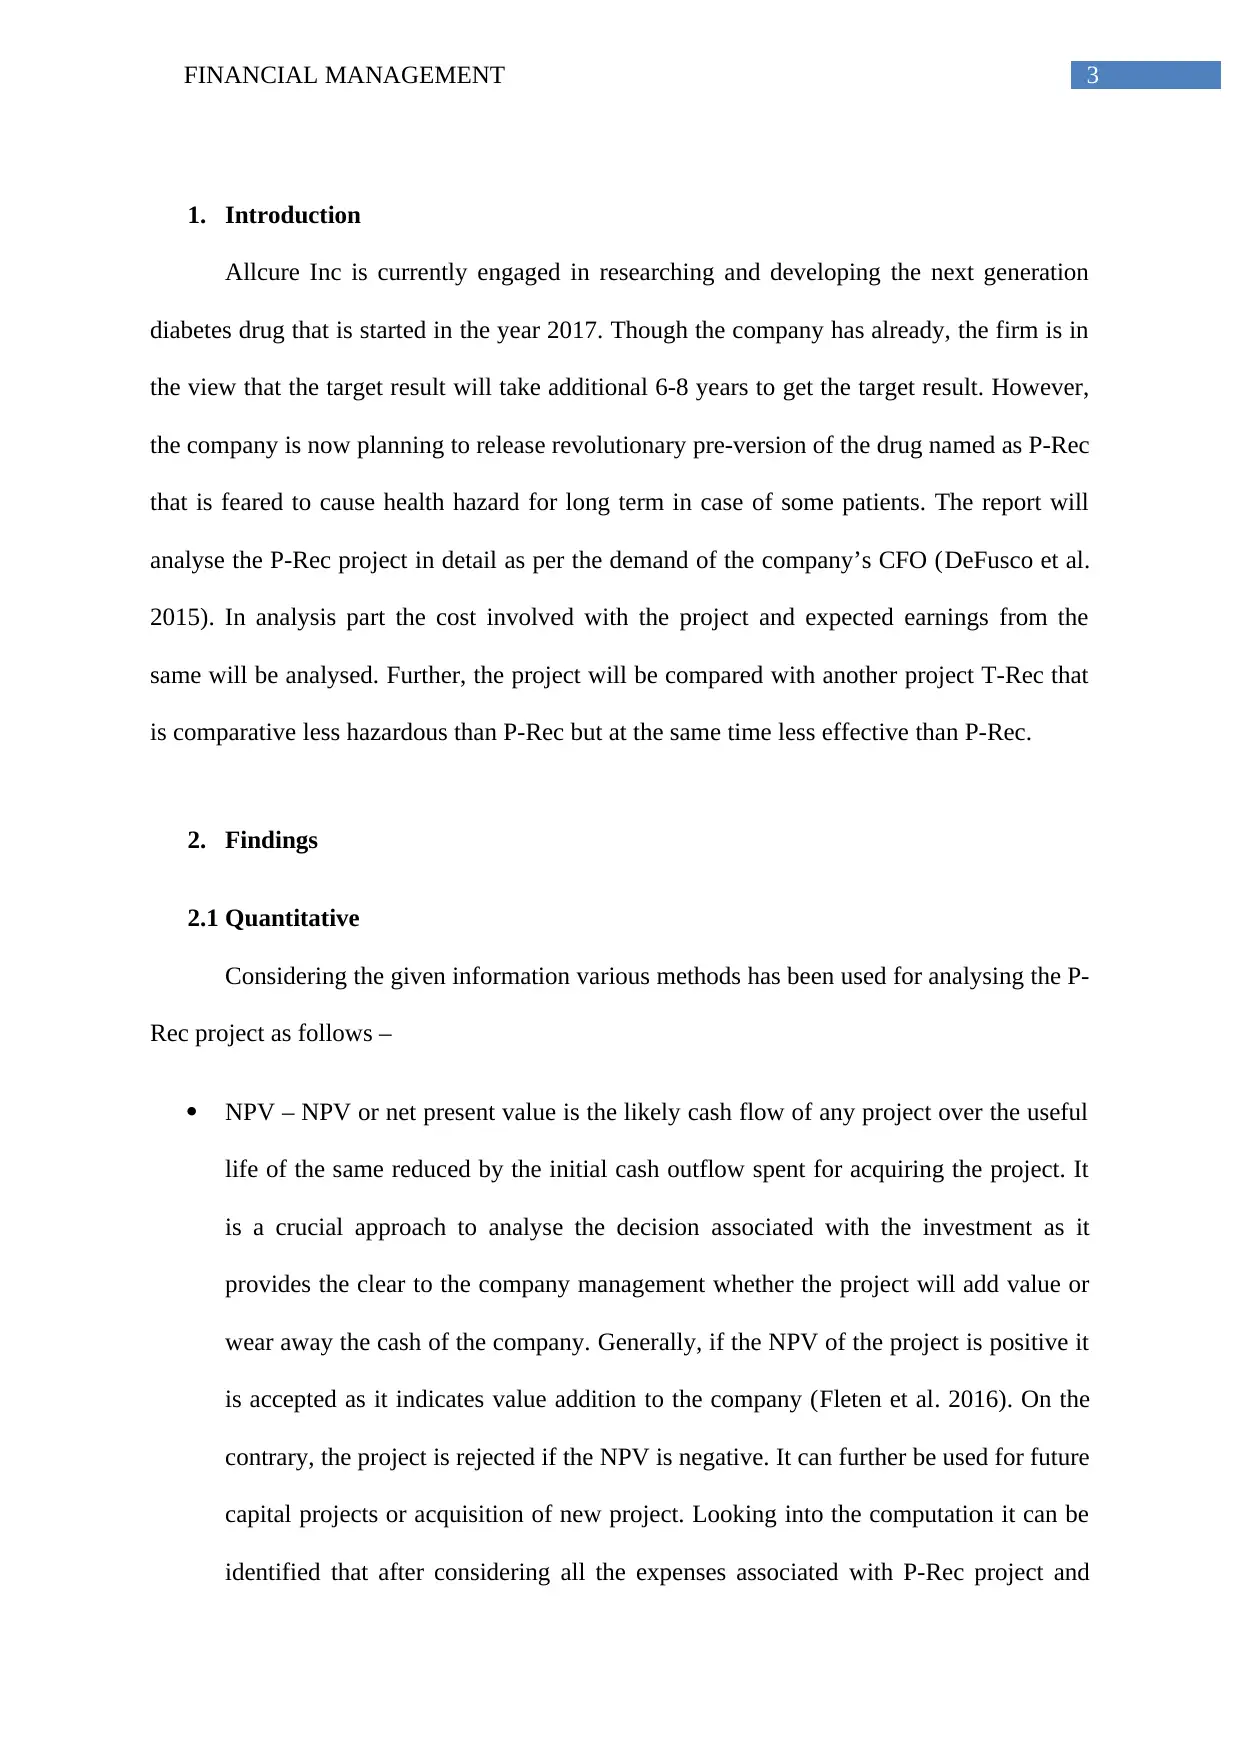
Table of Contents
1. Introduction.........................................................................................................................3
2. Findings..............................................................................................................................3
2.1 Quantitative.................................................................................................................3
2.2 Qualitative...................................................................................................................5
3. Recommendation and justification.....................................................................................5
4. Detail comparison and further recommendation................................................................5
5. Conclusion..........................................................................................................................7
Reference....................................................................................................................................8
Appendix....................................................................................................................................9
1. Cash flow table for P-Rec...............................................................................................9
2. Cash flow table for T-Rec...............................................................................................9
3. Comparison of P-Rec and T-Rec....................................................................................9
4. Cross over rate...............................................................................................................10
3FINANCIAL MANAGEMENT
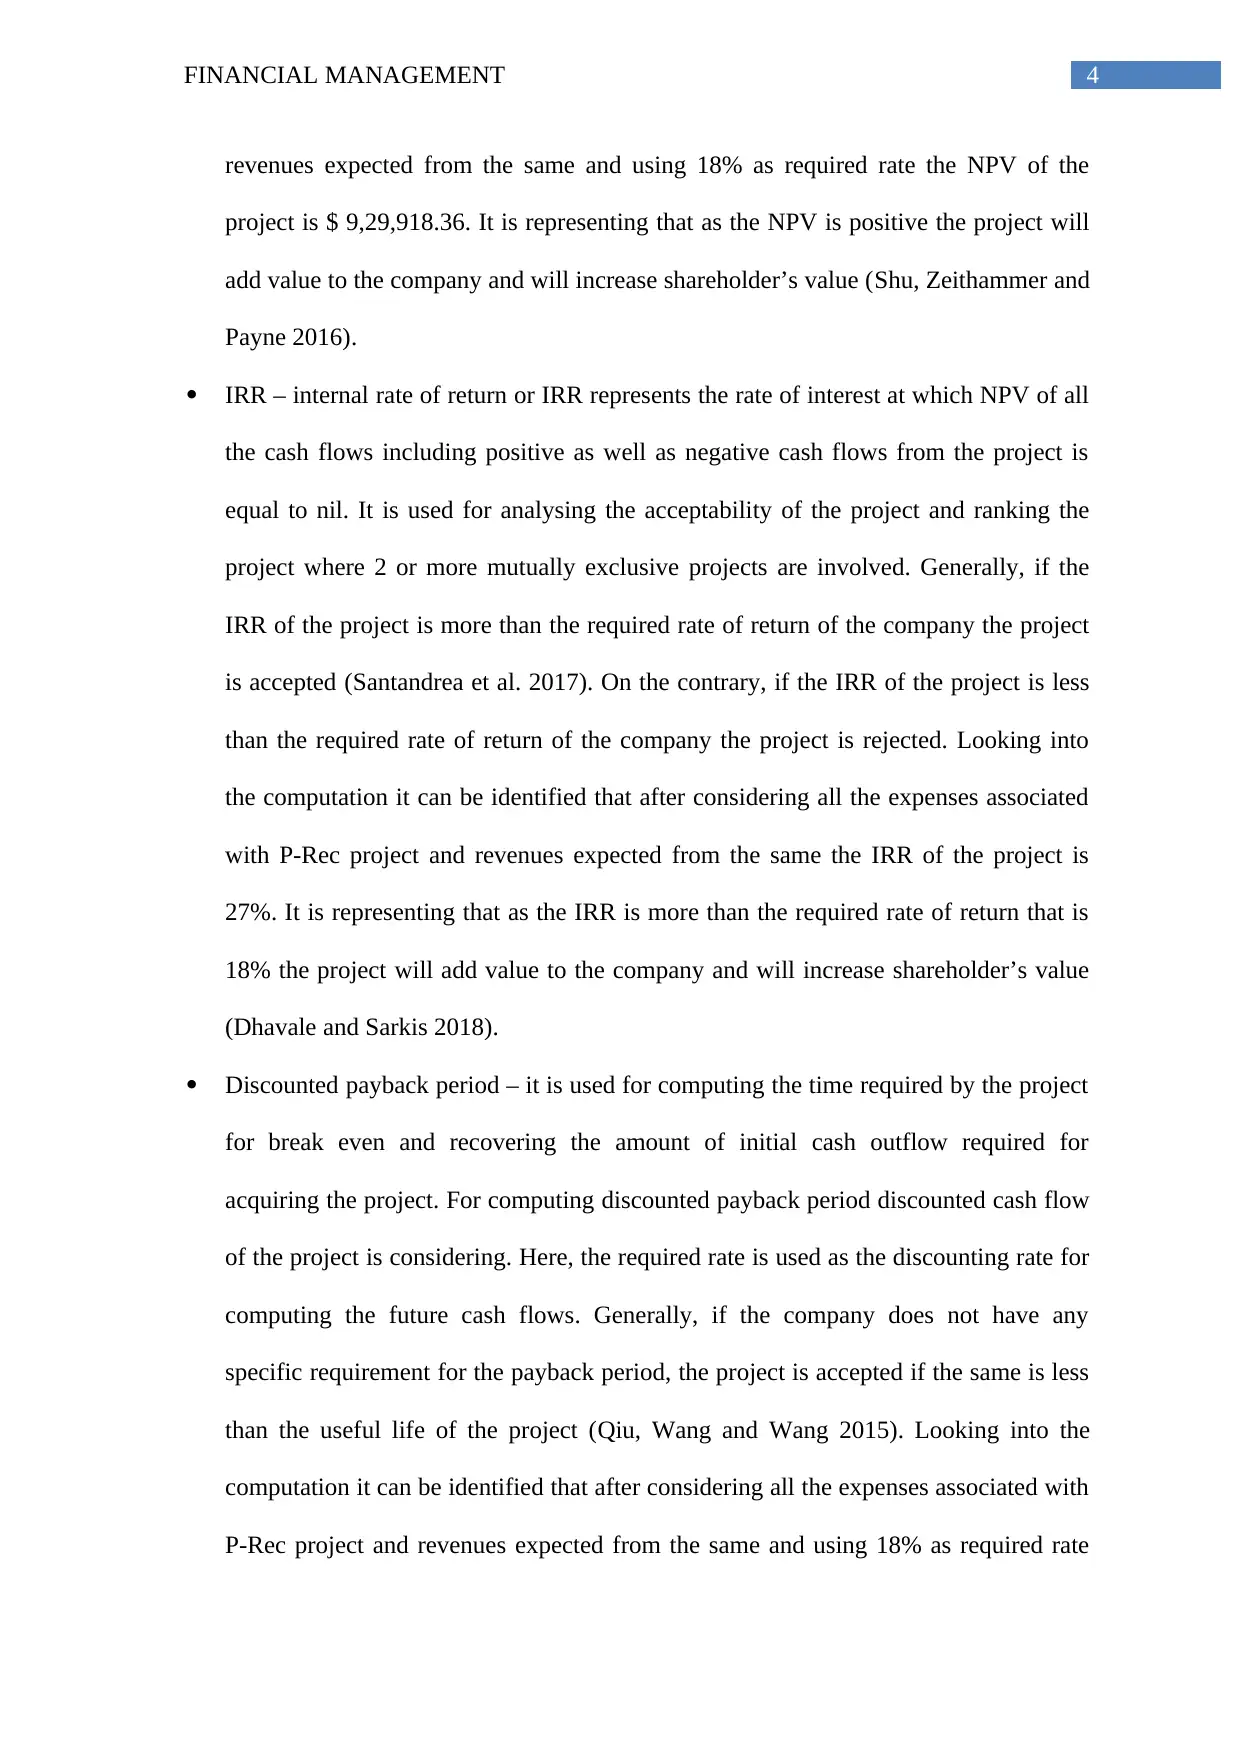
1. Introduction
Allcure Inc is currently engaged in researching and developing the next generation
diabetes drug that is started in the year 2017. Though the company has already, the firm is in
the view that the target result will take additional 6-8 years to get the target result. However,
the company is now planning to release revolutionary pre-version of the drug named as P-Rec
that is feared to cause health hazard for long term in case of some patients. The report will
analyse the P-Rec project in detail as per the demand of the company’s CFO (DeFusco et al.
2015). In analysis part the cost involved with the project and expected earnings from the
same will be analysed. Further, the project will be compared with another project T-Rec that
is comparative less hazardous than P-Rec but at the same time less effective than P-Rec.
2. Findings
2.1 Quantitative
Considering the given information various methods has been used for analysing the P-
Rec project as follows –
NPV – NPV or net present value is the likely cash flow of any project over the useful
life of the same reduced by the initial cash outflow spent for acquiring the project. It
is a crucial approach to analyse the decision associated with the investment as it
provides the clear to the company management whether the project will add value or
wear away the cash of the company. Generally, if the NPV of the project is positive it
is accepted as it indicates value addition to the company (Fleten et al. 2016). On the
contrary, the project is rejected if the NPV is negative. It can further be used for future
capital projects or acquisition of new project. Looking into the computation it can be
identified that after considering all the expenses associated with P-Rec project and
Secure Best Marks with AI Grader
Need help grading? Try our AI Grader for instant feedback on your assignments.
4FINANCIAL MANAGEMENT
revenues expected from the same and using 18% as required rate the NPV of the
project is $ 9,29,918.36. It is representing that as the NPV is positive the project will
add value to the company and will increase shareholder’s value (Shu, Zeithammer and
Payne 2016).
IRR – internal rate of return or IRR represents the rate of interest at which NPV of all
the cash flows including positive as well as negative cash flows from the project is
equal to nil. It is used for analysing the acceptability of the project and ranking the
project where 2 or more mutually exclusive projects are involved. Generally, if the
IRR of the project is more than the required rate of return of the company the project
is accepted (Santandrea et al. 2017). On the contrary, if the IRR of the project is less
than the required rate of return of the company the project is rejected. Looking into
the computation it can be identified that after considering all the expenses associated
with P-Rec project and revenues expected from the same the IRR of the project is
27%. It is representing that as the IRR is more than the required rate of return that is
18% the project will add value to the company and will increase shareholder’s value
(Dhavale and Sarkis 2018).
Discounted payback period – it is used for computing the time required by the project
for break even and recovering the amount of initial cash outflow required for
acquiring the project. For computing discounted payback period discounted cash flow
of the project is considering. Here, the required rate is used as the discounting rate for
computing the future cash flows. Generally, if the company does not have any
specific requirement for the payback period, the project is accepted if the same is less
than the useful life of the project (Qiu, Wang and Wang 2015). Looking into the
computation it can be identified that after considering all the expenses associated with
P-Rec project and revenues expected from the same and using 18% as required rate
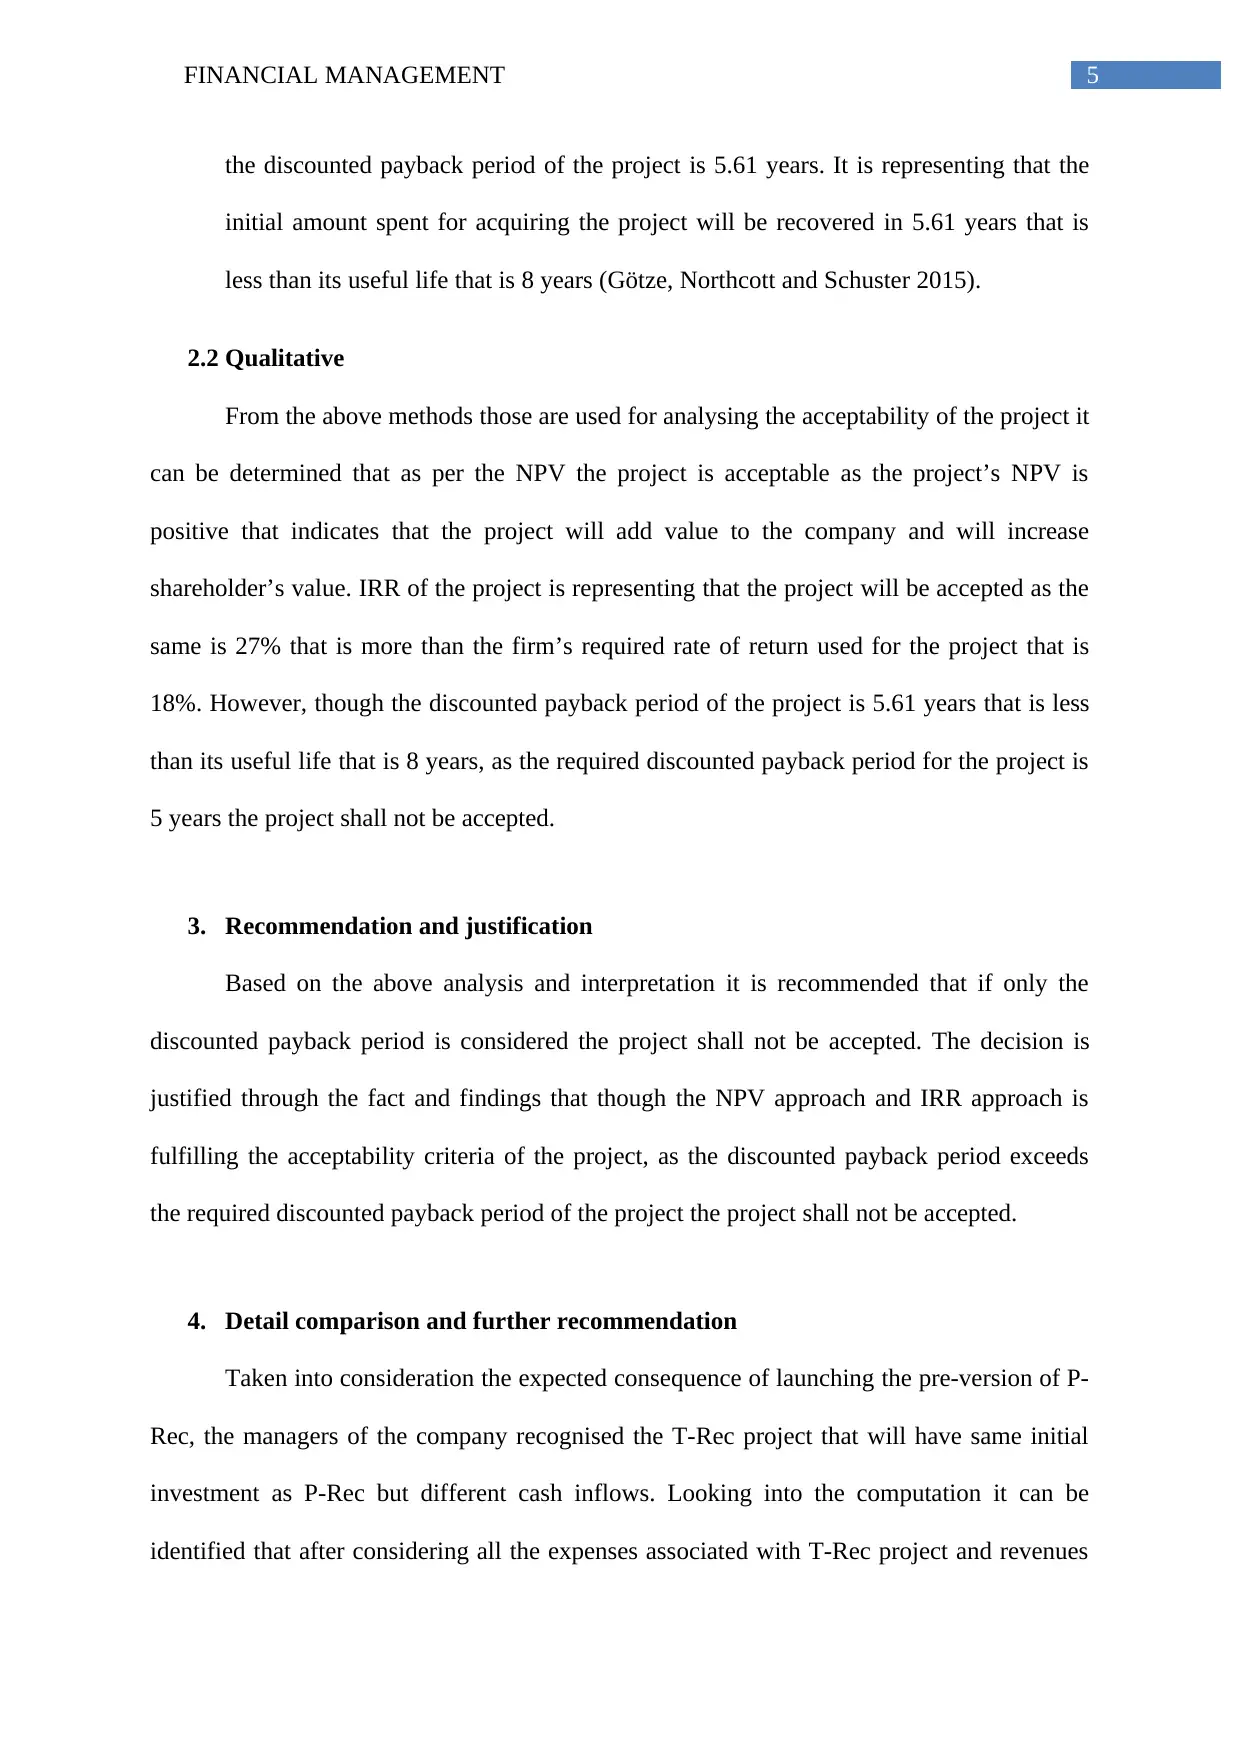
5FINANCIAL MANAGEMENT
the discounted payback period of the project is 5.61 years. It is representing that the
initial amount spent for acquiring the project will be recovered in 5.61 years that is
less than its useful life that is 8 years (Götze, Northcott and Schuster 2015).
2.2 Qualitative
From the above methods those are used for analysing the acceptability of the project it
can be determined that as per the NPV the project is acceptable as the project’s NPV is
positive that indicates that the project will add value to the company and will increase
shareholder’s value. IRR of the project is representing that the project will be accepted as the
same is 27% that is more than the firm’s required rate of return used for the project that is
18%. However, though the discounted payback period of the project is 5.61 years that is less
than its useful life that is 8 years, as the required discounted payback period for the project is
5 years the project shall not be accepted.
3. Recommendation and justification
Based on the above analysis and interpretation it is recommended that if only the
discounted payback period is considered the project shall not be accepted. The decision is
justified through the fact and findings that though the NPV approach and IRR approach is
fulfilling the acceptability criteria of the project, as the discounted payback period exceeds
the required discounted payback period of the project the project shall not be accepted.
4. Detail comparison and further recommendation
Taken into consideration the expected consequence of launching the pre-version of P-
Rec, the managers of the company recognised the T-Rec project that will have same initial
investment as P-Rec but different cash inflows. Looking into the computation it can be
identified that after considering all the expenses associated with T-Rec project and revenues
6FINANCIAL MANAGEMENT
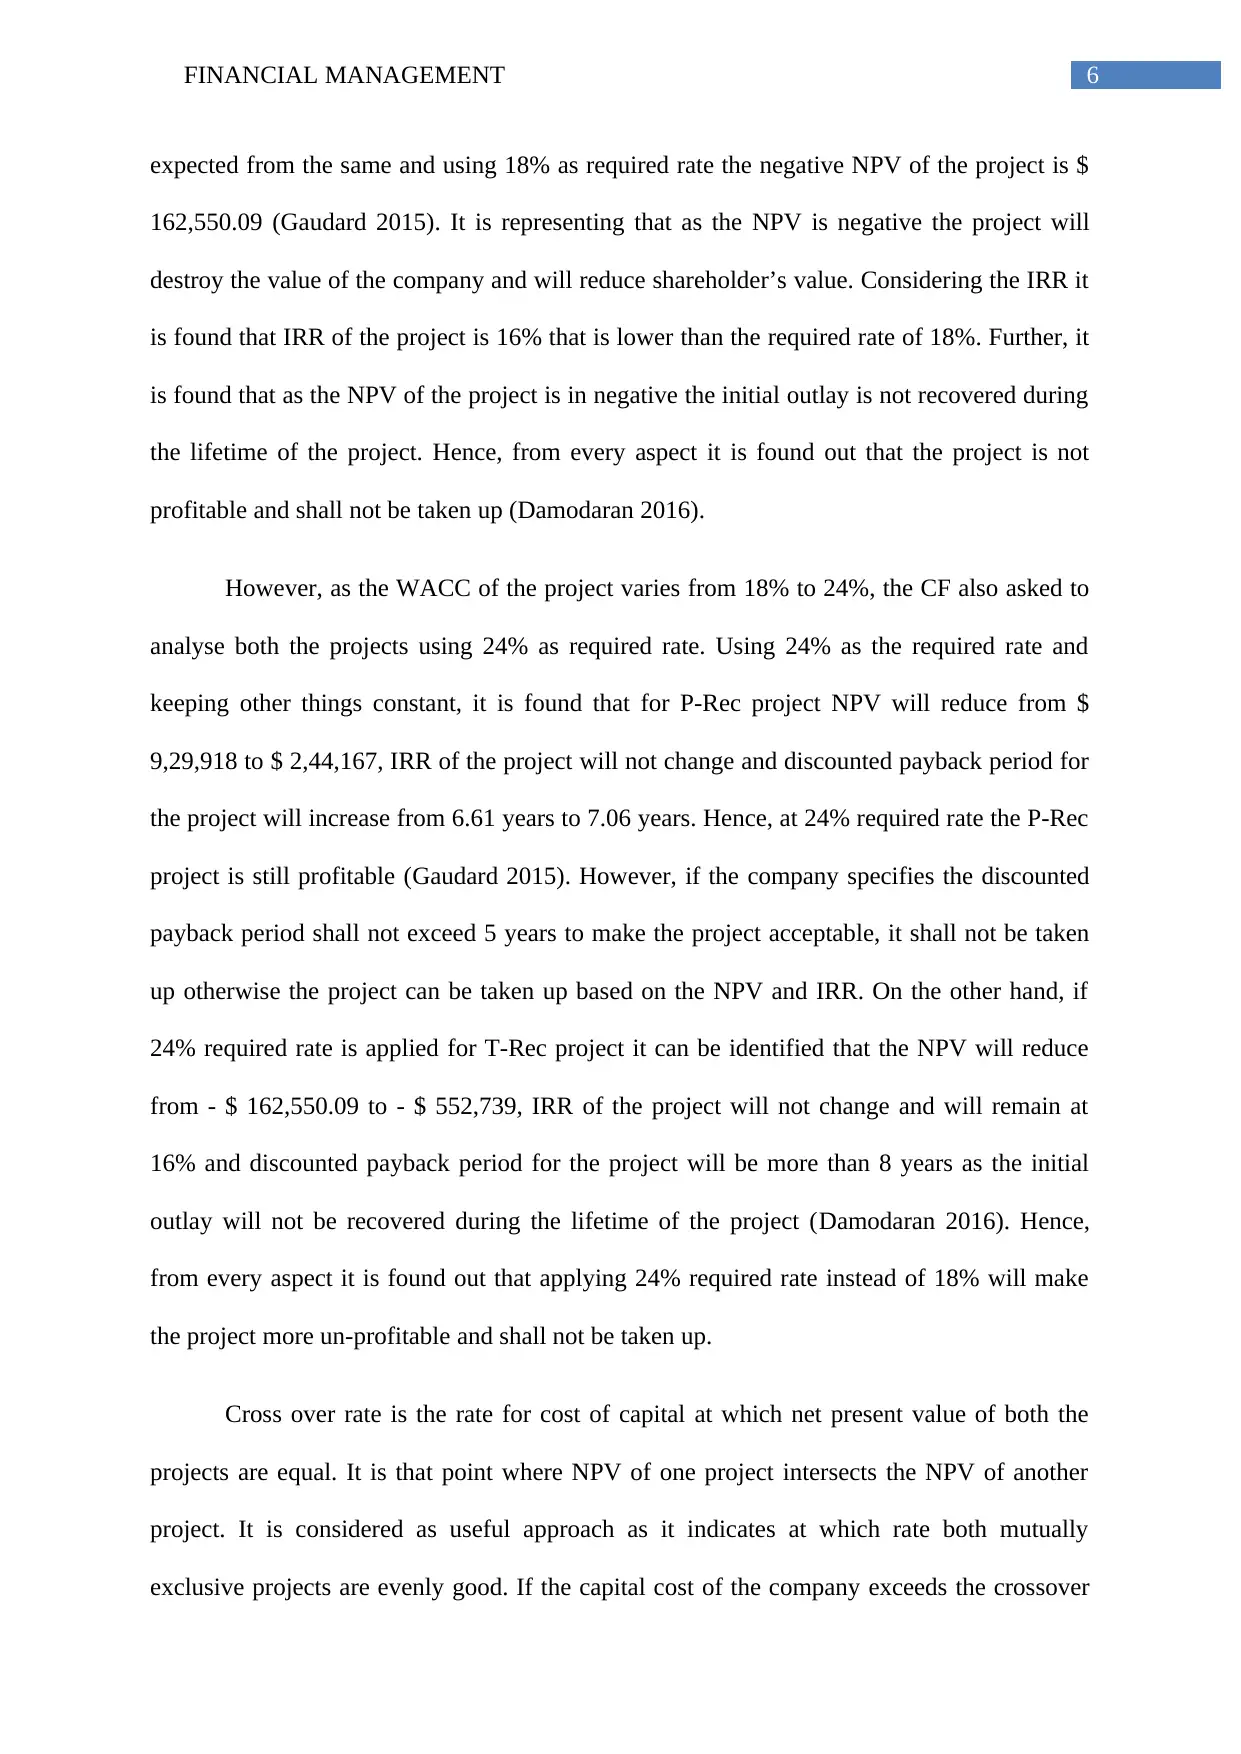
expected from the same and using 18% as required rate the negative NPV of the project is $
162,550.09 (Gaudard 2015). It is representing that as the NPV is negative the project will
destroy the value of the company and will reduce shareholder’s value. Considering the IRR it
is found that IRR of the project is 16% that is lower than the required rate of 18%. Further, it
is found that as the NPV of the project is in negative the initial outlay is not recovered during
the lifetime of the project. Hence, from every aspect it is found out that the project is not
profitable and shall not be taken up (Damodaran 2016).
However, as the WACC of the project varies from 18% to 24%, the CF also asked to
analyse both the projects using 24% as required rate. Using 24% as the required rate and
keeping other things constant, it is found that for P-Rec project NPV will reduce from $
9,29,918 to $ 2,44,167, IRR of the project will not change and discounted payback period for
the project will increase from 6.61 years to 7.06 years. Hence, at 24% required rate the P-Rec
project is still profitable (Gaudard 2015). However, if the company specifies the discounted
payback period shall not exceed 5 years to make the project acceptable, it shall not be taken
up otherwise the project can be taken up based on the NPV and IRR. On the other hand, if
24% required rate is applied for T-Rec project it can be identified that the NPV will reduce
from - $ 162,550.09 to - $ 552,739, IRR of the project will not change and will remain at
16% and discounted payback period for the project will be more than 8 years as the initial
outlay will not be recovered during the lifetime of the project (Damodaran 2016). Hence,
from every aspect it is found out that applying 24% required rate instead of 18% will make
the project more un-profitable and shall not be taken up.
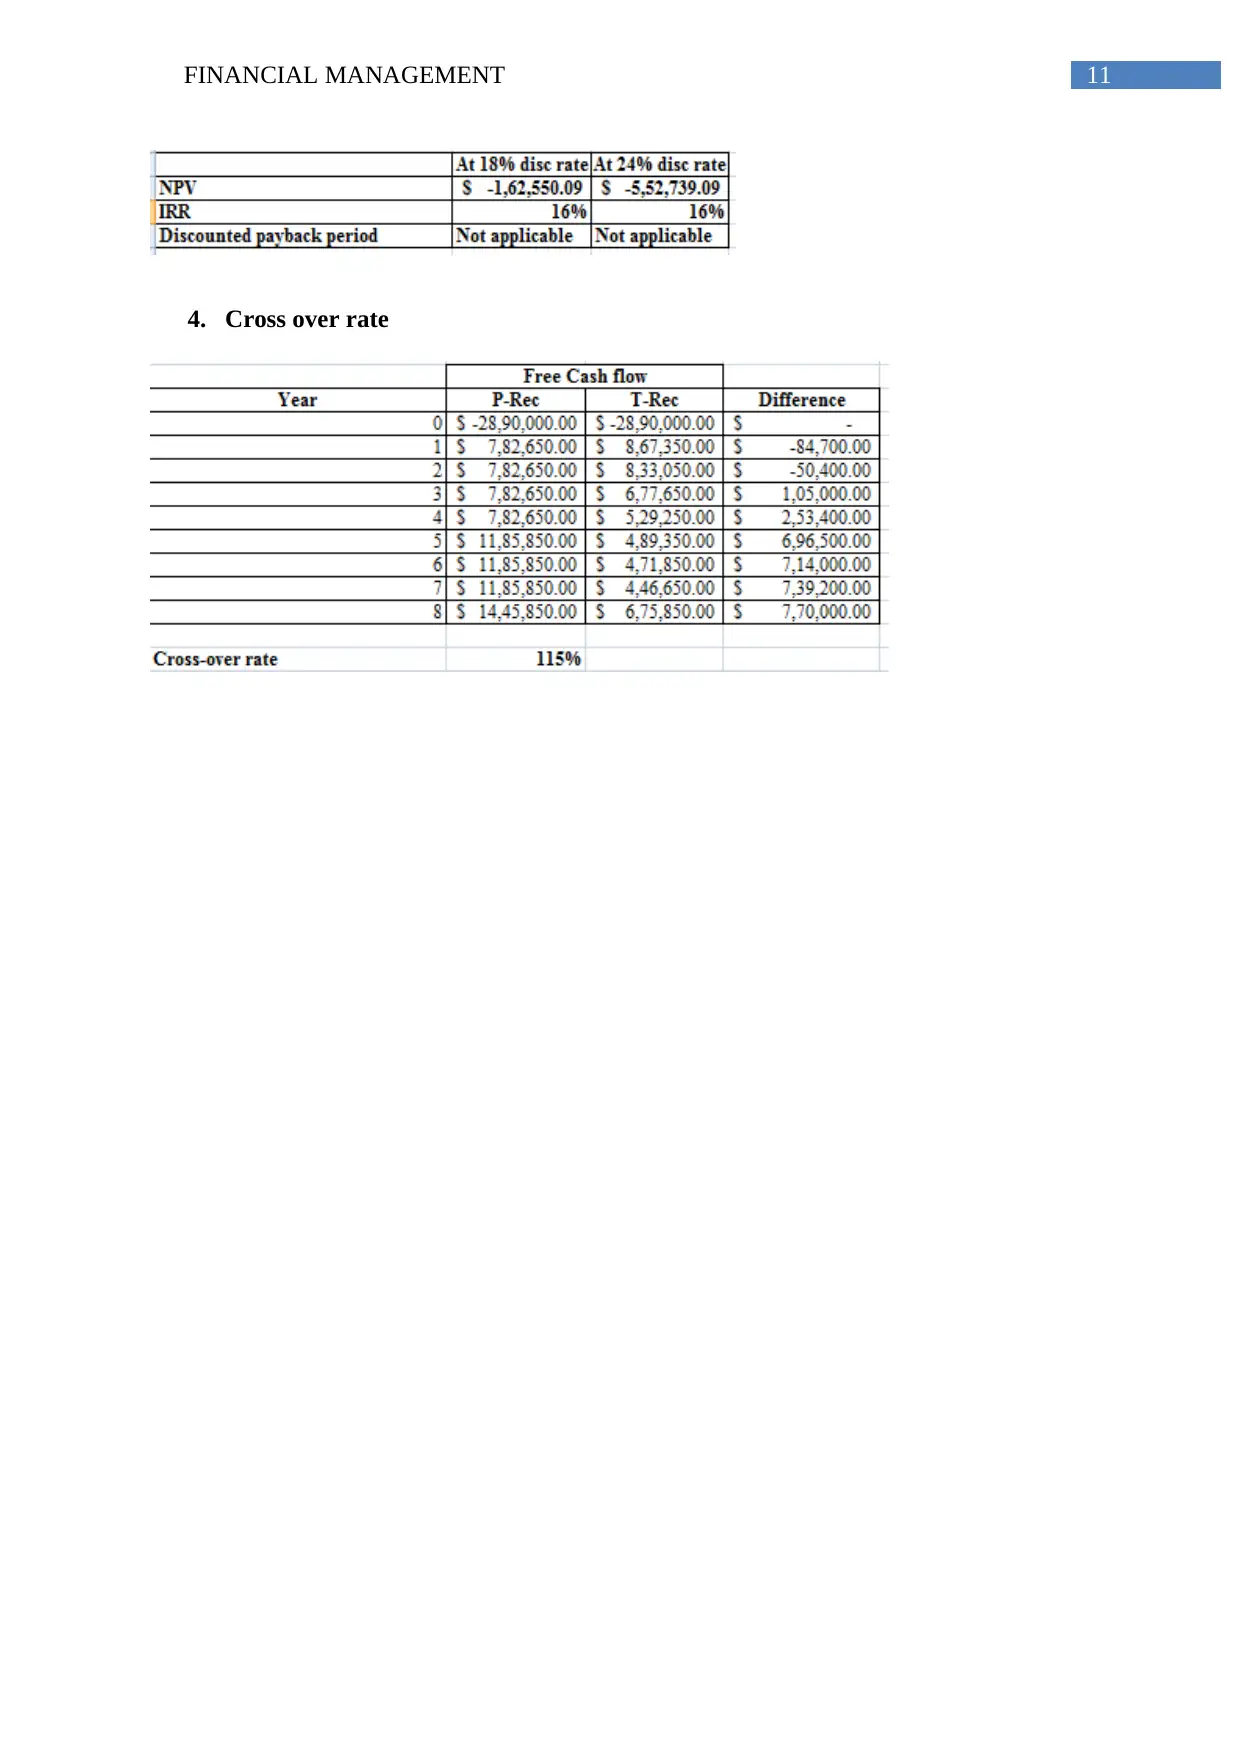
Cross over rate is the rate for cost of capital at which net present value of both the
projects are equal. It is that point where NPV of one project intersects the NPV of another
project. It is considered as useful approach as it indicates at which rate both mutually
exclusive projects are evenly good. If the capital cost of the company exceeds the crossover
expected from the same and using 18% as required rate the negative NPV of the project is $
162,550.09 (Gaudard 2015). It is representing that as the NPV is negative the project will
destroy the value of the company and will reduce shareholder’s value. Considering the IRR it
is found that IRR of the project is 16% that is lower than the required rate of 18%. Further, it
is found that as the NPV of the project is in negative the initial outlay is not recovered during
the lifetime of the project. Hence, from every aspect it is found out that the project is not
profitable and shall not be taken up (Damodaran 2016).
However, as the WACC of the project varies from 18% to 24%, the CF also asked to
analyse both the projects using 24% as required rate. Using 24% as the required rate and
keeping other things constant, it is found that for P-Rec project NPV will reduce from $
9,29,918 to $ 2,44,167, IRR of the project will not change and discounted payback period for
the project will increase from 6.61 years to 7.06 years. Hence, at 24% required rate the P-Rec
project is still profitable (Gaudard 2015). However, if the company specifies the discounted
payback period shall not exceed 5 years to make the project acceptable, it shall not be taken
up otherwise the project can be taken up based on the NPV and IRR. On the other hand, if
24% required rate is applied for T-Rec project it can be identified that the NPV will reduce
from - $ 162,550.09 to - $ 552,739, IRR of the project will not change and will remain at
16% and discounted payback period for the project will be more than 8 years as the initial
outlay will not be recovered during the lifetime of the project (Damodaran 2016). Hence,
from every aspect it is found out that applying 24% required rate instead of 18% will make
the project more un-profitable and shall not be taken up.
Cross over rate is the rate for cost of capital at which net present value of both the
projects are equal. It is that point where NPV of one project intersects the NPV of another
project. It is considered as useful approach as it indicates at which rate both mutually
exclusive projects are evenly good. If the capital cost of the company exceeds the crossover
Paraphrase This Document
Need a fresh take? Get an instant paraphrase of this document with our AI Paraphraser
7FINANCIAL MANAGEMENT
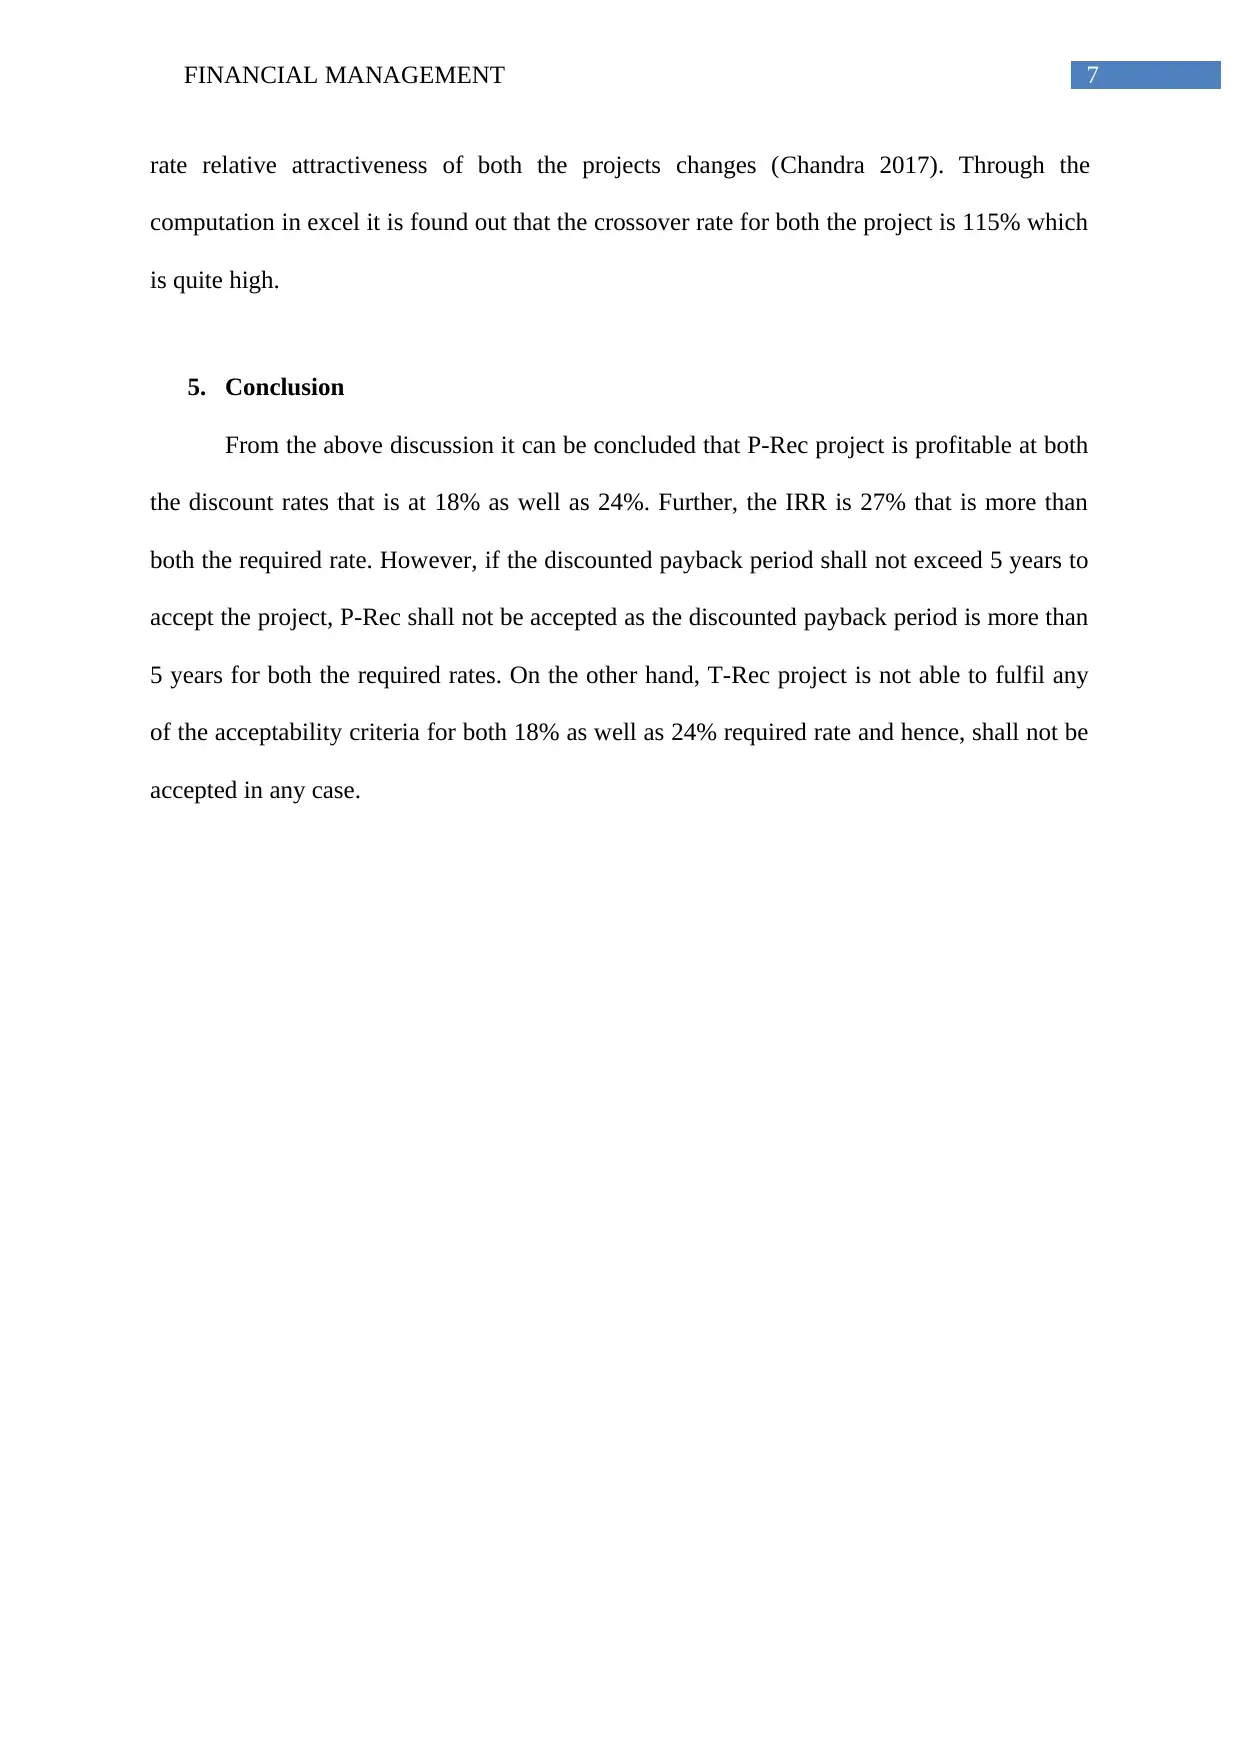
rate relative attractiveness of both the projects changes (Chandra 2017). Through the
computation in excel it is found out that the crossover rate for both the project is 115% which
is quite high.
5. Conclusion
From the above discussion it can be concluded that P-Rec project is profitable at both
the discount rates that is at 18% as well as 24%. Further, the IRR is 27% that is more than
both the required rate. However, if the discounted payback period shall not exceed 5 years to
accept the project, P-Rec shall not be accepted as the discounted payback period is more than
5 years for both the required rates. On the other hand, T-Rec project is not able to fulfil any
of the acceptability criteria for both 18% as well as 24% required rate and hence, shall not be
accepted in any case.
8FINANCIAL MANAGEMENT
Reference
Chandra, P., 2017. Investment analysis and portfolio management. McGraw-Hill Education.
Damodaran, A., 2016. Damodaran on valuation: security analysis for investment and
corporate finance (Vol. 324). John Wiley & Sons.
DeFusco, R.A., McLeavey, D.W., Pinto, J.E., Anson, M.J. and Runkle, D.E.,
2015. Quantitative investment analysis. John Wiley & Sons.
Dhavale, D. G., and Sarkis, J., 2018. Stochastic internal rate of return on investments in
sustainable assets generating carbon credits. Computers & Operations Research, 89, 324-336.
Fleten, S. E., Linnerud, K., Molnár, P., and Nygaard, M. T., 2016. Green electricity
investment timing in practice: Real options or net present value?. Energy, 116, 498-506.
Gaudard, L., 2015. Pumped-storage project: A short to long term investment analysis
including climate change. Renewable and Sustainable Energy Reviews, 49, 91-99.
Götze, U., Northcott, D., and Schuster, P., 2015. Discounted Cash Flow Methods.
In Investment Appraisal (pp. 47-83). Springer, Berlin, Heidelberg.
Qiu, Y., Wang, Y. D., and Wang, J., 2015. Implied discount rate and payback threshold of
energy efficiency investment in the industrial sector. Applied Economics, 47(21), 2218-2233.
Santandrea, M., Sironi, A., Grassi, L., and Giorgino, M., 2017. Concentration risk and
internal rate of return: Evidence from the infrastructure equity market. International Journal
of Project Management, 35(3), 241-251.
Shu, S. B., Zeithammer, R., and Payne, J. W., 2016. Consumer preferences for annuity
attributes: Beyond net present value. Journal of Marketing Research, 53(2), 240-262.

9FINANCIAL MANAGEMENT
Secure Best Marks with AI Grader
Need help grading? Try our AI Grader for instant feedback on your assignments.
10FINANCIAL MANAGEMENT
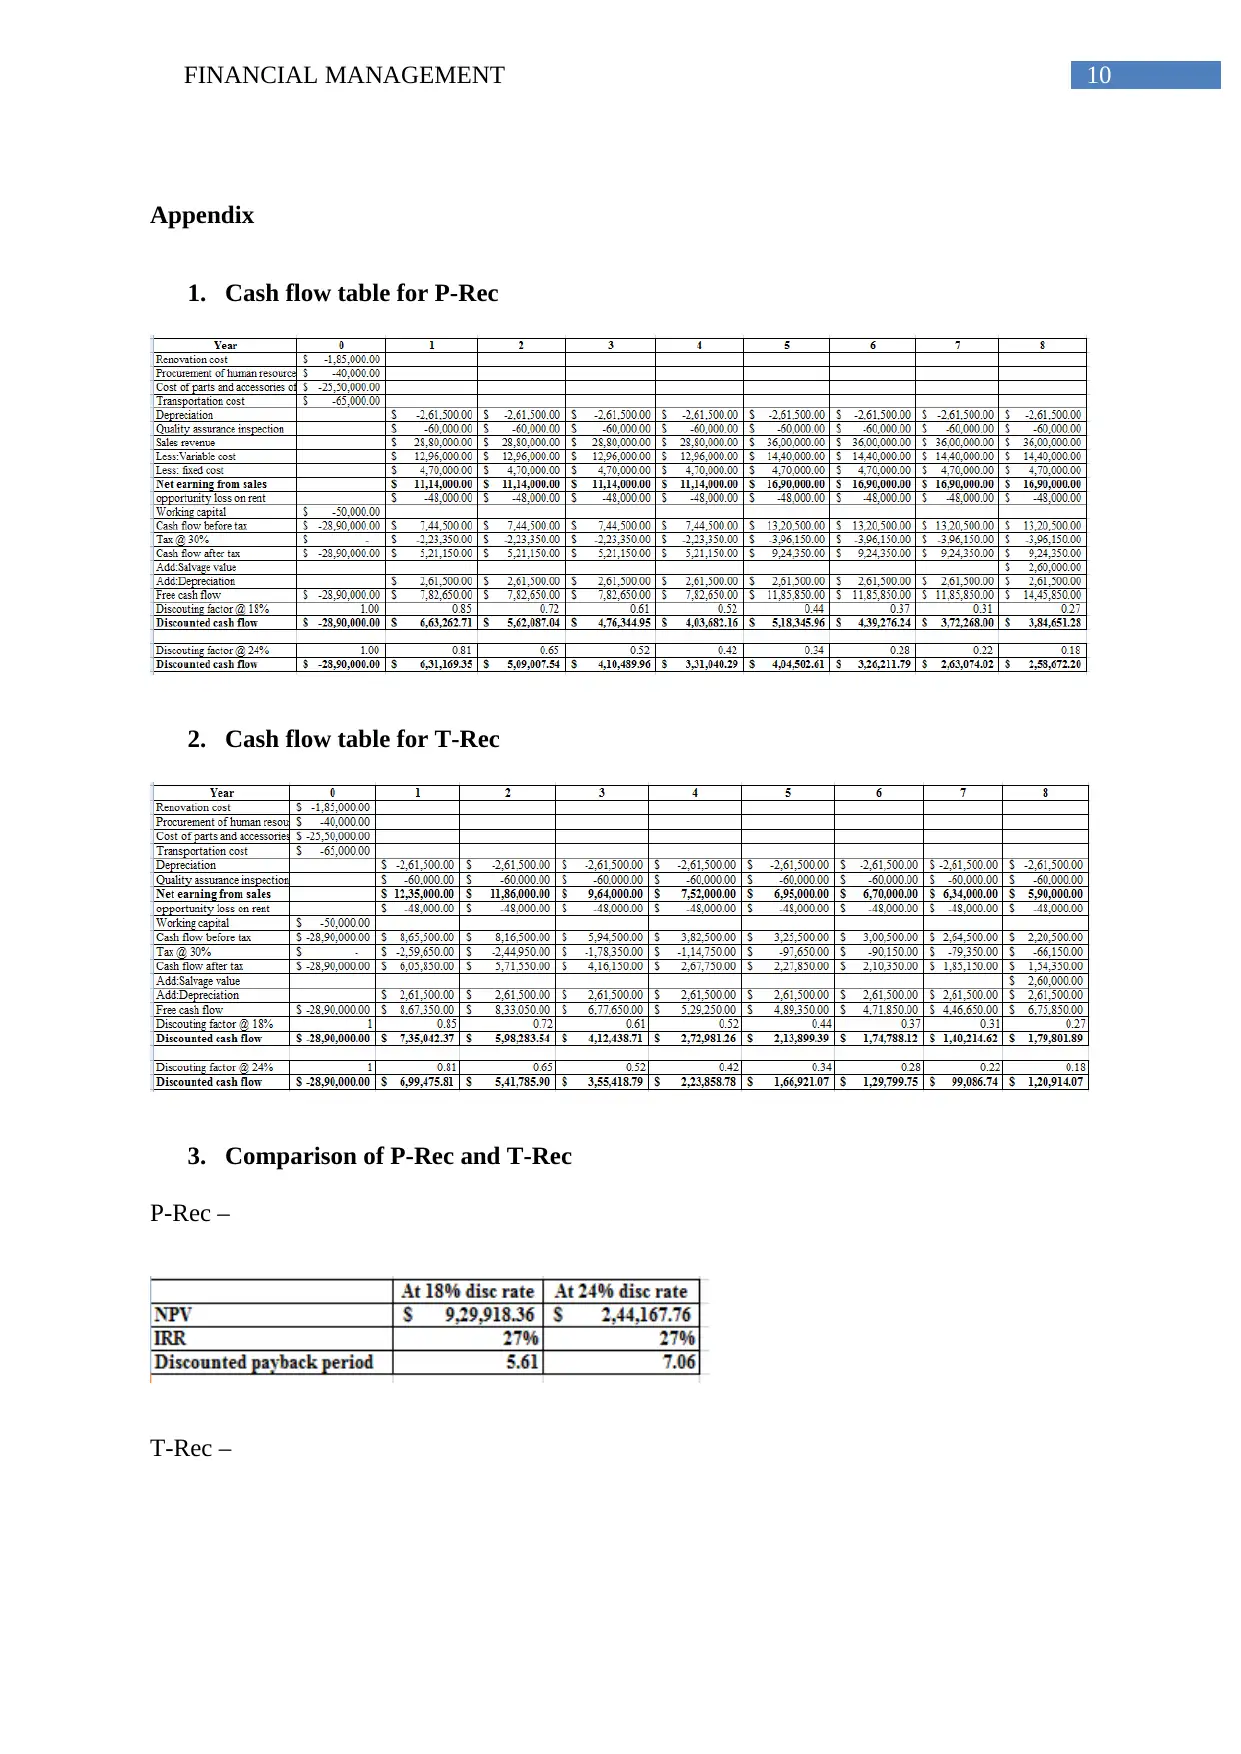
Appendix
1. Cash flow table for P-Rec
2. Cash flow table for T-Rec
3. Comparison of P-Rec and T-Rec
P-Rec –
T-Rec –
Appendix
1. Cash flow table for P-Rec
2. Cash flow table for T-Rec
3. Comparison of P-Rec and T-Rec
P-Rec –
T-Rec –
11FINANCIAL MANAGEMENT
4. Cross over rate
4. Cross over rate
1 out of 12
Related Documents


Your All-in-One AI-Powered Toolkit for Academic Success.
+13062052269
info@desklib.com
Available 24*7 on WhatsApp / Email
![[object Object]](/_next/static/media/star-bottom.7253800d.svg)
Unlock your academic potential
© 2024 | Zucol Services PVT LTD | All rights reserved.