Management Accounting Report: Costing, Budgeting & Analysis
VerifiedAdded on 2023/04/04
|23
|4654
|63
Report
AI Summary
This management accounting report provides a detailed analysis of Smart Looks, a UK-based clothing retailer. It distinguishes various costs incurred by the company, categorizing them as fixed, semi-variable, or variable. The report calculates total and unit costs at different production levels, offering insights into cost behavior. Inventory valuation methods, including FIFO, LIFO, and average cost, are applied to determine the cost of goods sold. The report identifies critical success factors and performance indicators, such as customer experience, supplier relationships, and operational efficiency. Budgeting techniques are explored, including sales, production, raw material, labor, and overhead budgets. A cash budget is prepared and analyzed, and variance analysis is conducted to identify deviations from planned performance. Finally, the report suggests corrective actions for improvement, emphasizing the role of management accounting in enhancing the firm's growth and profitability. Desklib provides access to similar reports and study tools for students.
Management
accounting
accounting
Paraphrase This Document
Need a fresh take? Get an instant paraphrase of this document with our AI Paraphraser
Table of Contents
INTRODUCTION...........................................................................................................................................4
Question 1...............................................................................................................................................4
a. Distinguishing various costs incurred by Smart looks..........................................................................4
b. Presenting different types of cost related to clothing retail firm.........................................................4
Q.2...........................................................................................................................................................6
(A) Calculation of total cost (TC) and unit cost (UC).................................................................................6
(B) Cost data analysis...............................................................................................................................7
Q.3 Inventory valuation...........................................................................................................................8
(1) First-in, first-out.................................................................................................................................8
(2) Last-in, First-out.................................................................................................................................8
(3) Average costs.....................................................................................................................................9
Q.4. Calculation of cost of goods sold under FIFO, LIFO and average cost method...............................10
Question 5.............................................................................................................................................10
A. Identifying critical success factors and performance indicators........................................................10
B............................................................................................................................................................11
1. Identifying the ways through which cost level can be reduced.........................................................11
2. Assessing the manner in which quality can be enhanced..................................................................12
TASK 2........................................................................................................................................................12
Q.6.........................................................................................................................................................12
(A). Meaning of budget..........................................................................................................................12
(B). Purpose or objectives of budgetary planning..................................................................................12
(C) Different methods of budget prearation for Smart Looks................................................................13
Question7..............................................................................................................................................14
a. Sales budget.......................................................................................................................................14
b. Production budget.............................................................................................................................15
c. Raw material budgets........................................................................................................................15
d. Labor budgets....................................................................................................................................15
e. Total overhead budget......................................................................................................................16
Q.8. Preparing cash budget and its analysis..........................................................................................16
TASK 3........................................................................................................................................................18
Question 9.............................................................................................................................................18
a. Computation of planned margin for March 2017..............................................................................18
b. Calculation of actual profit................................................................................................................18
c. Computation of material and labor variances....................................................................................19
d. Preparing reconciliation profit...........................................................................................................20
Question 10...........................................................................................................................................20
Finding causes of deviations and taking correction actions for improvement.......................................20
CONCLUSION.............................................................................................................................................21
REFERENCES..............................................................................................................................................22
⊘ This is a preview!⊘
Do you want full access?
Subscribe today to unlock all pages.
Trusted by 1+ million students worldwide
INTRODUCTION
Management accounting includes several tools and techniques which in turn help in
preparing suitable reports for decision making. In the present times, each business unit lays
emphasis on employing varied tools for getting information about the extent to which each
business unit is performing in a well manner. Moreover, managerial reporting provides deeper
insight to the firm about the area which requires improvement. Thus, management accounting
system aids in the growth and profitability aspect of firm to a great extent. The present report is
based on Smart Looks which is the clothing retailer of UK. It provides customers with high
quality fashion apparel at affordable prices. In this, report will furnish information regarding the
different types of cost associated with the manufacturing of clothes. Further, it will also provide
understanding about the manner in which suitable plan can be developed in monetary terms.
Besides this, report will help in understanding the manner in which variance analysis technique
helps in taking strategic action for the purpose of improvement.
Question 1
a. Distinguishing various costs incurred by Smart looks
Cited case situation presents that Smart Looks has incurred following expenses which fall
in the category of either fixed, semi-variable or variable. Hence, category of cost incurred is
enumerated below:
Material for clothes: Variable cost
Factory rent: Fixed cost
Power of sewing machines: Semi-variable cost
Telephone expenses: semi-variable cost
Office rates: Fixed cost
Delivery drivers: Semi-variable cost
Factory heating: Variable cost
b. Presenting different types of cost related to clothing retail firm
Cost may be defined as a sum of all the expenses which are incurred by firm to
manufacture clothes. In the business organization, firm has to incur several costs which in turn
Paraphrase This Document
Need a fresh take? Get an instant paraphrase of this document with our AI Paraphraser
place direct impact on the cost and profit level. From manufacturing to offering products or
services business entity has to incur several expenses which can be categorized in the following
manner:
Degree of Traceability
Direct expenses: It refers to those which are highly associated with the manufacturing of
product such as clothes. Hence, material, labor cost is the main examples of direct
expenditure.
Indirect expenses: Such category of expenses include selling and distribution,
administration expenses which business unit has to incur for offering high quality
products or services to the customers (Cost Classification, 2017). Hence, indirect
expenses are those which business unit to incur for ensuring the smooth functioning of
business operations.
Changes take place in activity or volume
Fixed cost: Factory rent, insurance, rent etc. comes under the category of fixed cost.
Thus, fixed costs are the one which remains unchanged irrespective the level of output
produced. Hence, per unit cost decreases when production level inclines and vice versa.
Variable cost: Such cost is directly associated with the number of unit produced. Variable
cost increases in line with the production level (Mohanty, 2014). Material, heating
expenses etc. are the main examples of variable cost.
Semi-variable cost: It may be served as those whose specific portion remains fixed to a
specific unit and balance portion considered as variable. Electricity, promotional are the
main examples of semi-variable cost which Smart Looks needs to incur.
Based on product
Direct material: In clothing business, retailer requires raw fabric to make finished
products. Hence, by multiplying the number of units manufacture with rate of per meter
direct material cost can be assessed.
Direct labor: This cost may be defined as wages which are paid by clothing retailer to the
labor on the basis of hours spend by them while manufacturing the apparels.
Overhead cost: Cost which is incurred by Smart Looks other than material and labor is
considered as overhead (Mungal and Garbharran, 2014). Hence, selling, administration
etc. are recognized as overhead cost that is vital for the business organization.
Q.2.
(A) Calculation of total cost (TC) and unit cost (UC)
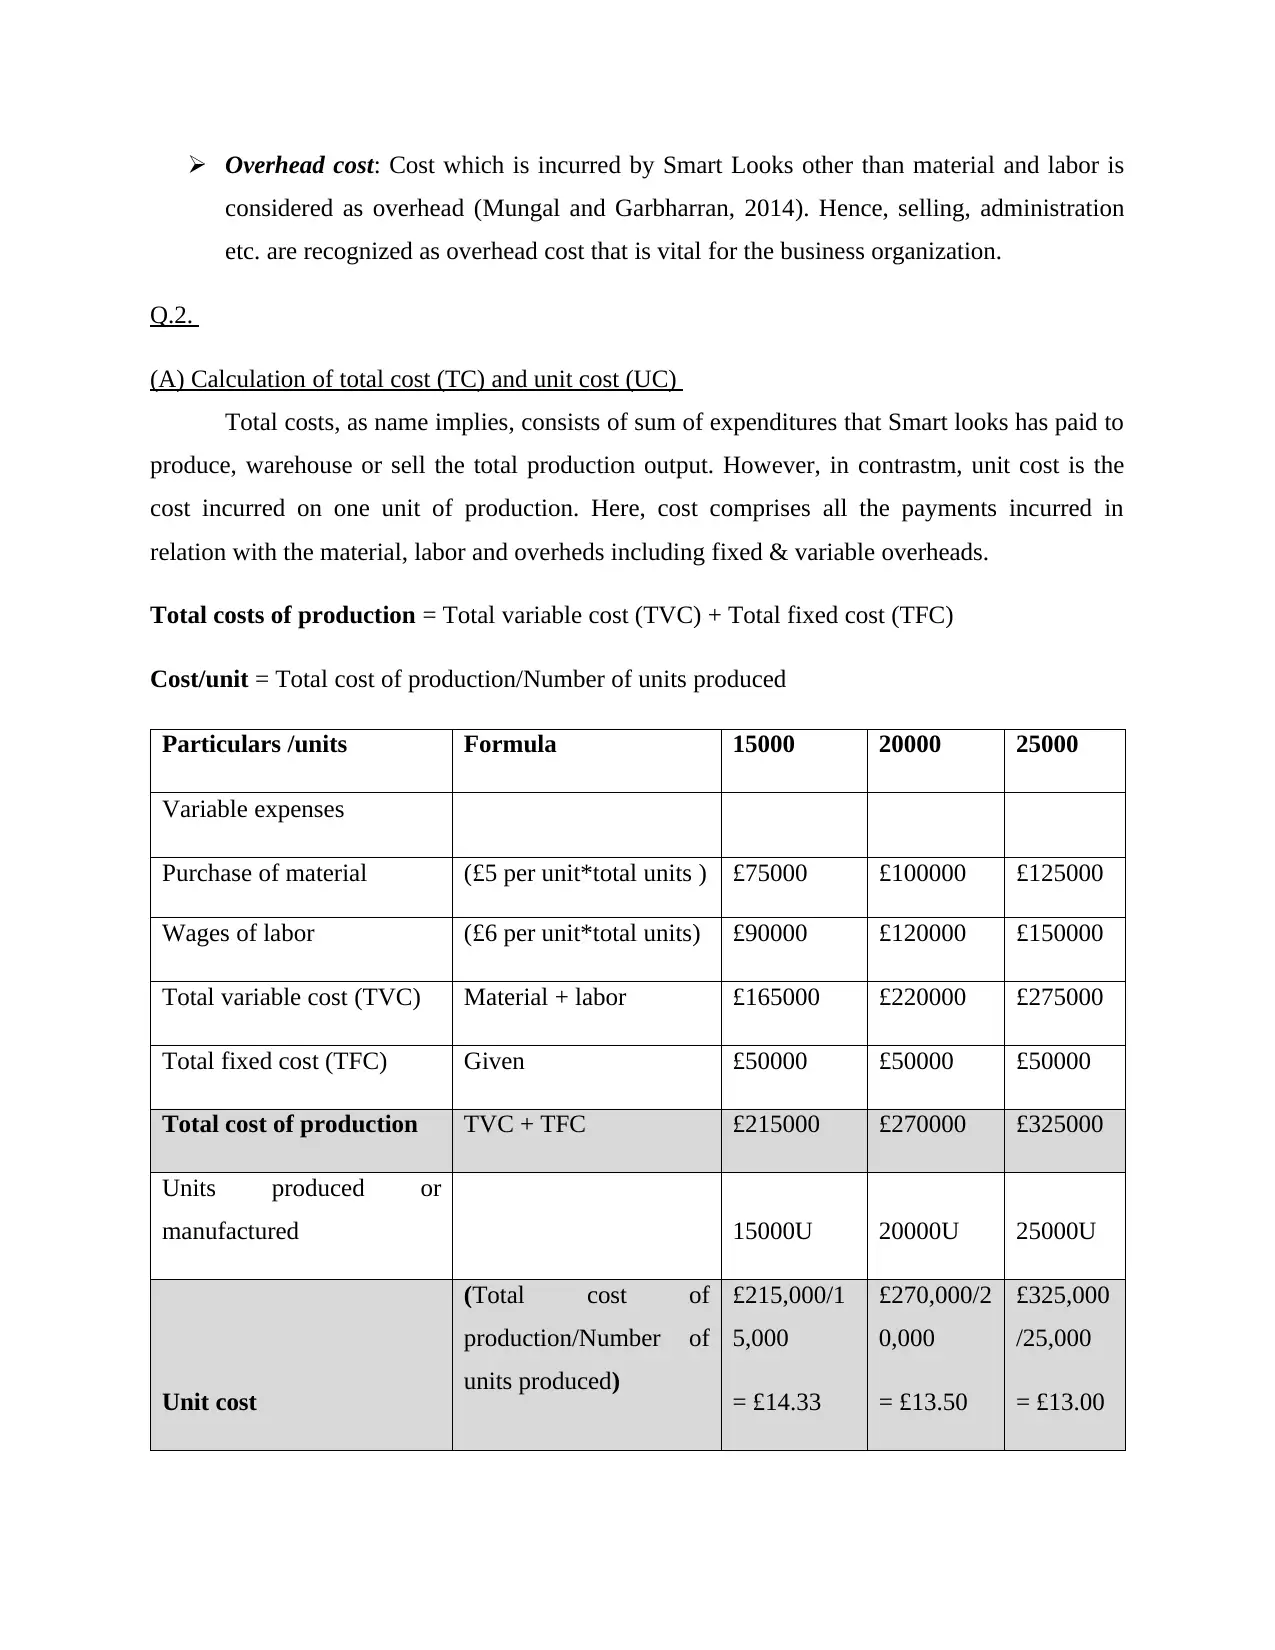
Total costs, as name implies, consists of sum of expenditures that Smart looks has paid to
produce, warehouse or sell the total production output. However, in contrastm, unit cost is the
cost incurred on one unit of production. Here, cost comprises all the payments incurred in
relation with the material, labor and overheds including fixed & variable overheads.
Total costs of production = Total variable cost (TVC) + Total fixed cost (TFC)
Cost/unit = Total cost of production/Number of units produced
Particulars /units Formula 15000 20000 25000
Variable expenses
Purchase of material (£5 per unit*total units ) £75000 £100000 £125000
Wages of labor (£6 per unit*total units) £90000 £120000 £150000
Total variable cost (TVC) Material + labor £165000 £220000 £275000
Total fixed cost (TFC) Given £50000 £50000 £50000
Total cost of production TVC + TFC £215000 £270000 £325000
Units produced or
manufactured 15000U 20000U 25000U
Unit cost
(Total cost of
production/Number of
units produced)
£215,000/1
5,000
= £14.33
£270,000/2
0,000
= £13.50
£325,000
/25,000
= £13.00
considered as overhead (Mungal and Garbharran, 2014). Hence, selling, administration
etc. are recognized as overhead cost that is vital for the business organization.
Q.2.
(A) Calculation of total cost (TC) and unit cost (UC)
Total costs, as name implies, consists of sum of expenditures that Smart looks has paid to
produce, warehouse or sell the total production output. However, in contrastm, unit cost is the
cost incurred on one unit of production. Here, cost comprises all the payments incurred in
relation with the material, labor and overheds including fixed & variable overheads.
Total costs of production = Total variable cost (TVC) + Total fixed cost (TFC)
Cost/unit = Total cost of production/Number of units produced
Particulars /units Formula 15000 20000 25000
Variable expenses
Purchase of material (£5 per unit*total units ) £75000 £100000 £125000
Wages of labor (£6 per unit*total units) £90000 £120000 £150000
Total variable cost (TVC) Material + labor £165000 £220000 £275000
Total fixed cost (TFC) Given £50000 £50000 £50000
Total cost of production TVC + TFC £215000 £270000 £325000
Units produced or
manufactured 15000U 20000U 25000U
Unit cost
(Total cost of
production/Number of
units produced)
£215,000/1
5,000
= £14.33
£270,000/2
0,000
= £13.50
£325,000
/25,000
= £13.00
⊘ This is a preview!⊘
Do you want full access?
Subscribe today to unlock all pages.
Trusted by 1+ million students worldwide
(B) Cost data analysis
15000 units 20000 units 25000 units
0
50000
100000
150000
200000
250000
300000
350000
Total costs
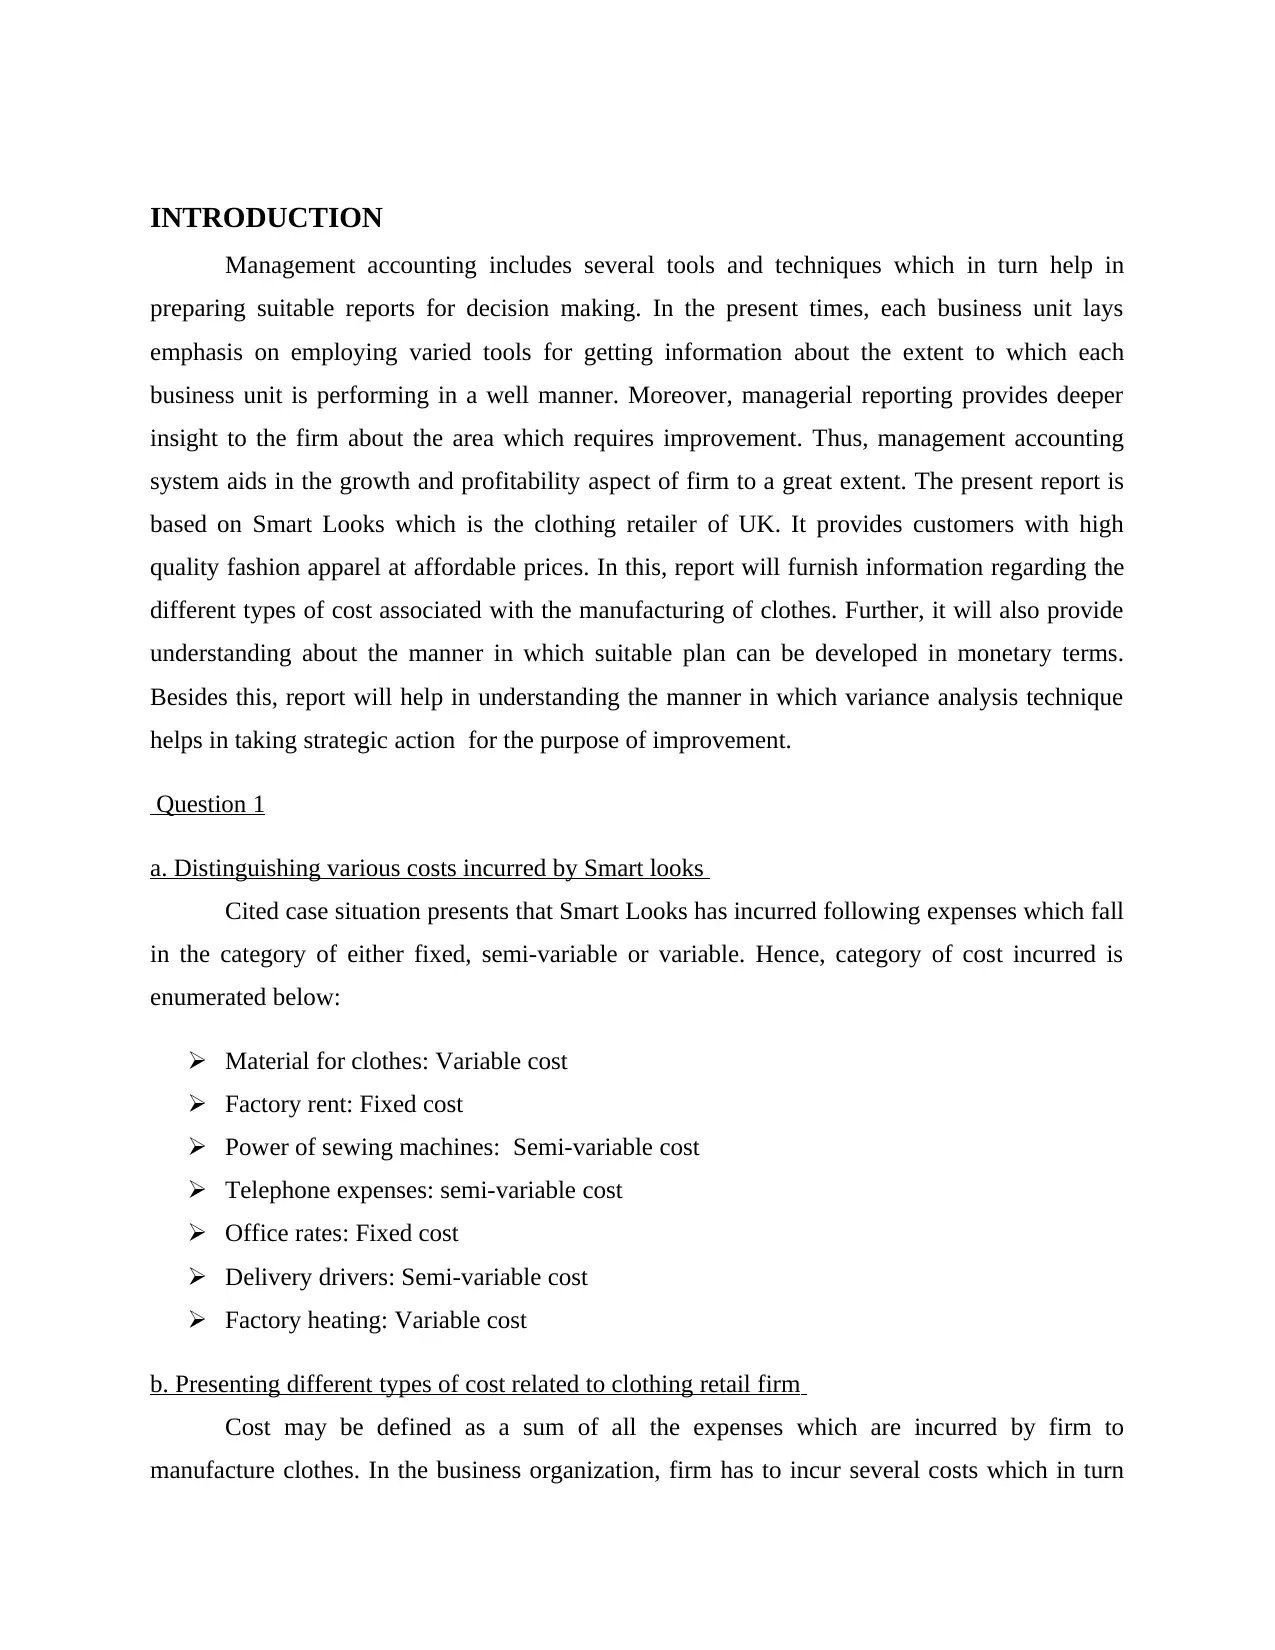
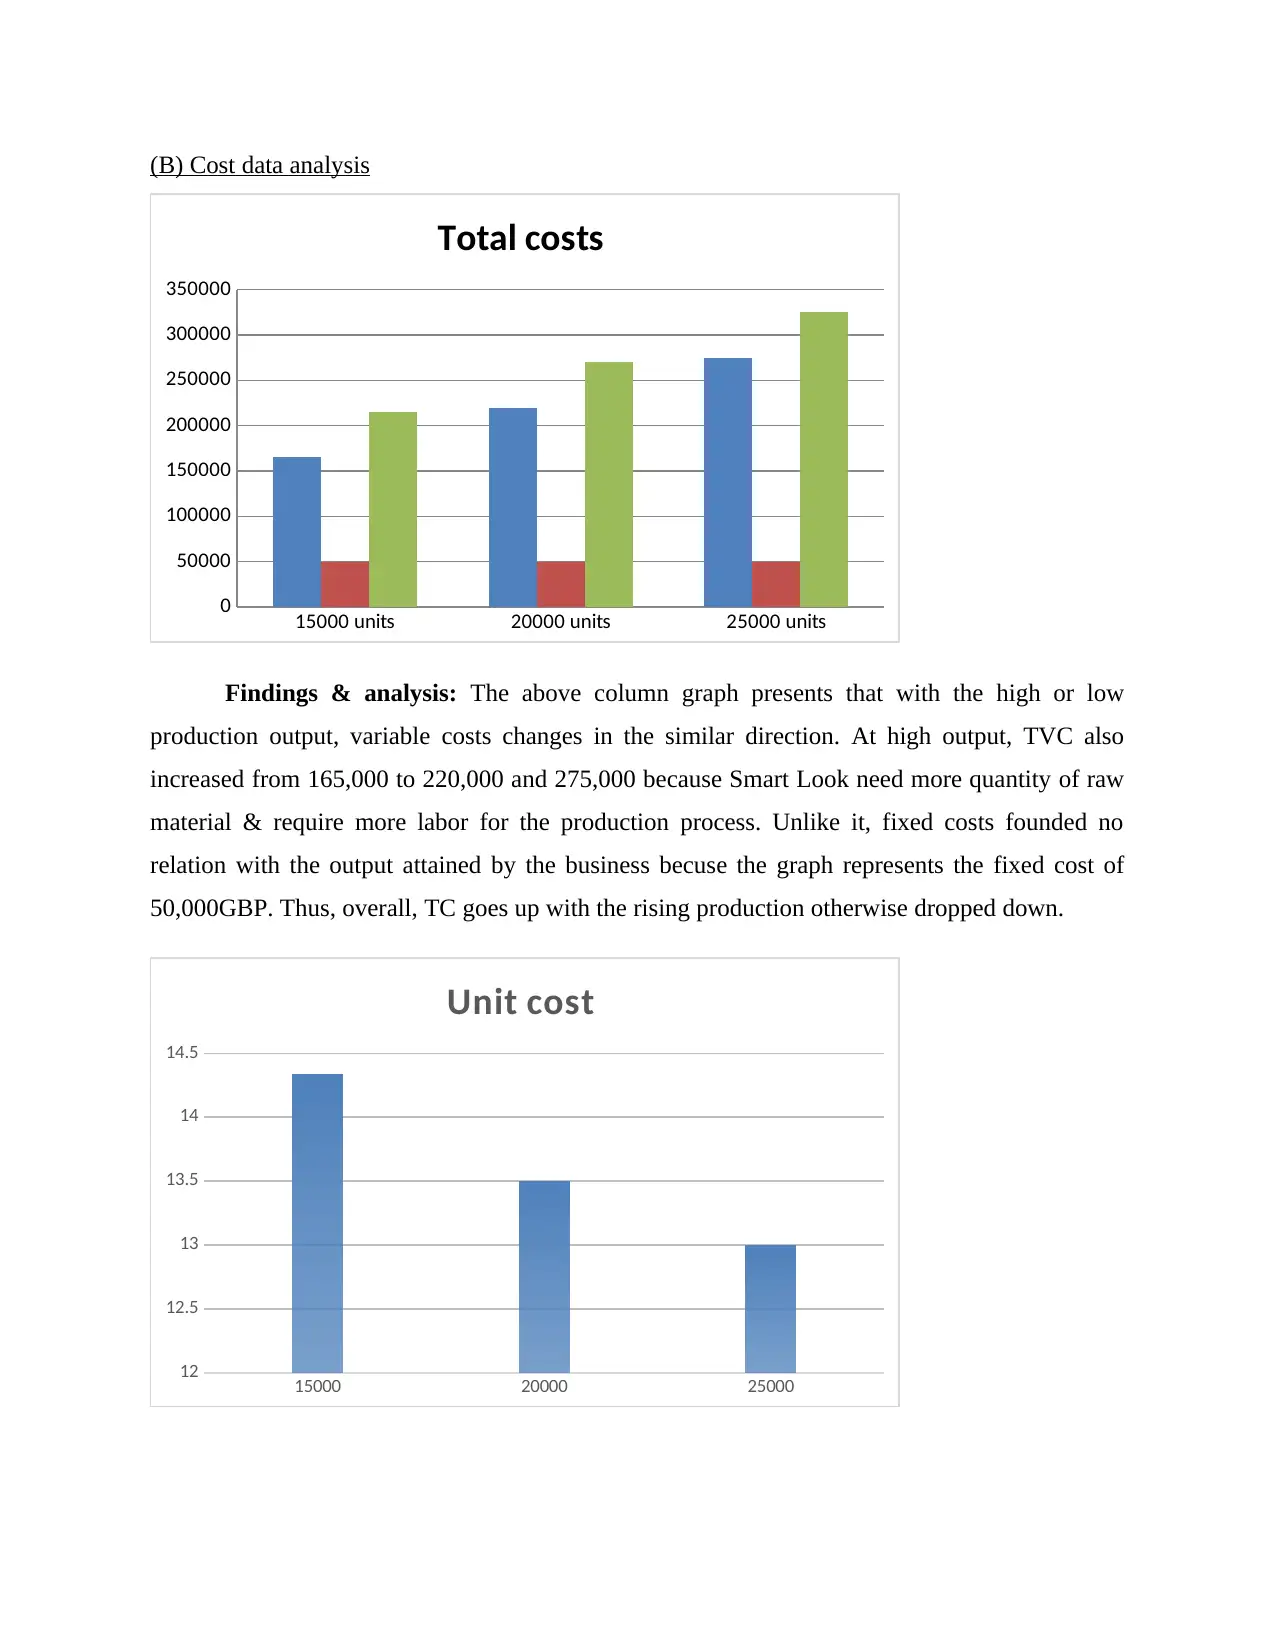
Findings & analysis: The above column graph presents that with the high or low
production output, variable costs changes in the similar direction. At high output, TVC also
increased from 165,000 to 220,000 and 275,000 because Smart Look need more quantity of raw
material & require more labor for the production process. Unlike it, fixed costs founded no
relation with the output attained by the business becuse the graph represents the fixed cost of
50,000GBP. Thus, overall, TC goes up with the rising production otherwise dropped down.
15000 20000 25000
12
12.5
13
13.5
14
14.5
Unit cost
15000 units 20000 units 25000 units
0
50000
100000
150000
200000
250000
300000
350000
Total costs
Findings & analysis: The above column graph presents that with the high or low
production output, variable costs changes in the similar direction. At high output, TVC also
increased from 165,000 to 220,000 and 275,000 because Smart Look need more quantity of raw
material & require more labor for the production process. Unlike it, fixed costs founded no
relation with the output attained by the business becuse the graph represents the fixed cost of
50,000GBP. Thus, overall, TC goes up with the rising production otherwise dropped down.
15000 20000 25000
12
12.5
13
13.5
14
14.5
Unit cost
Paraphrase This Document
Need a fresh take? Get an instant paraphrase of this document with our AI Paraphraser
Findings & analysis: Unit costs at 15000 units is figured to 14.33 GBP which came
downward to 13.5 and 13 GBP at 20,000 & 25000 units of output. The reason is that TFC of
50,000 is allocated and spreaded to more number of units which resulted less cost each unit.
Q.3 Inventory valuation
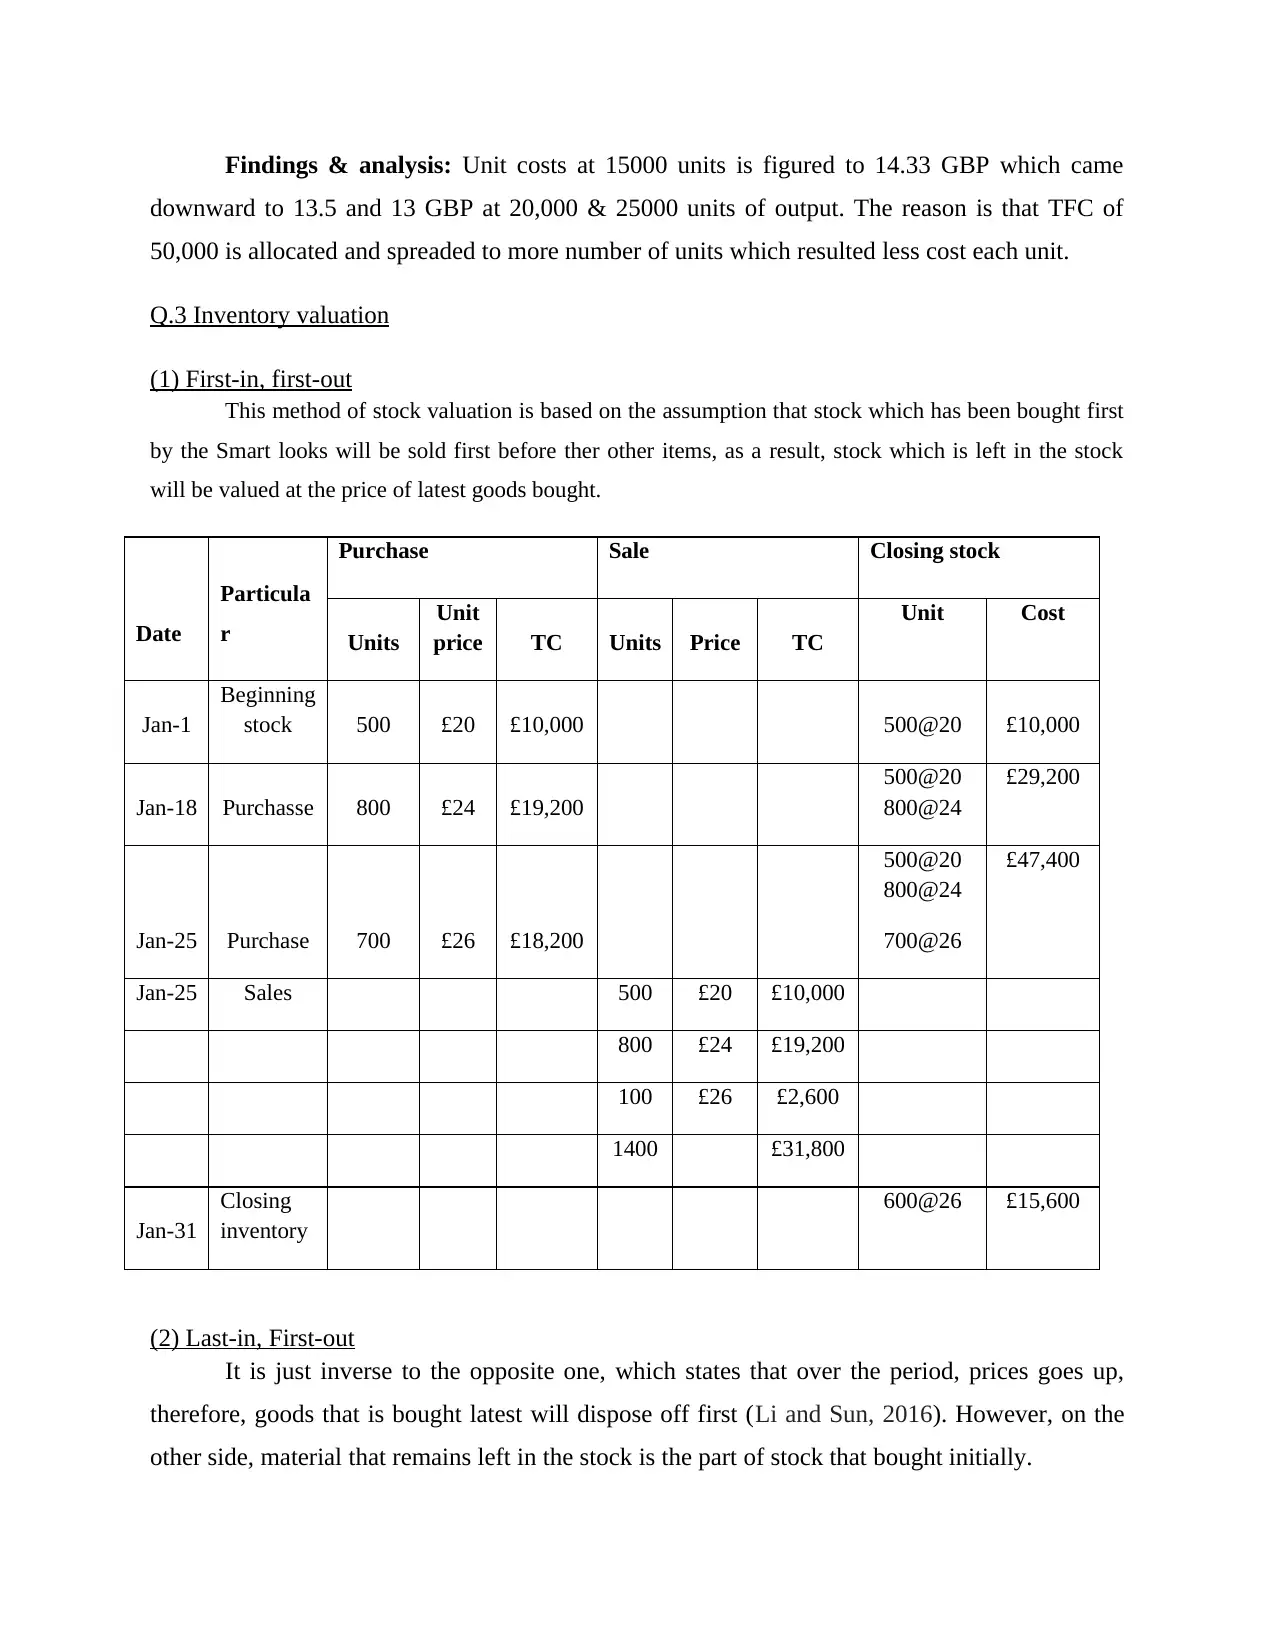
(1) First-in, first-out
This method of stock valuation is based on the assumption that stock which has been bought first
by the Smart looks will be sold first before ther other items, as a result, stock which is left in the stock
will be valued at the price of latest goods bought.
Date
Particula
r
Purchase Sale Closing stock
Units
Unit
price TC Units Price TC
Unit Cost
Jan-1
Beginning
stock 500 £20 £10,000 500@20 £10,000
Jan-18 Purchasse 800 £24 £19,200
500@20
800@24
£29,200
Jan-25 Purchase 700 £26 £18,200
500@20
800@24
700@26
£47,400
Jan-25 Sales 500 £20 £10,000
800 £24 £19,200
100 £26 £2,600
1400 £31,800
Jan-31
Closing
inventory
600@26 £15,600
(2) Last-in, First-out
It is just inverse to the opposite one, which states that over the period, prices goes up,
therefore, goods that is bought latest will dispose off first (Li and Sun, 2016). However, on the
other side, material that remains left in the stock is the part of stock that bought initially.
downward to 13.5 and 13 GBP at 20,000 & 25000 units of output. The reason is that TFC of
50,000 is allocated and spreaded to more number of units which resulted less cost each unit.
Q.3 Inventory valuation
(1) First-in, first-out
This method of stock valuation is based on the assumption that stock which has been bought first
by the Smart looks will be sold first before ther other items, as a result, stock which is left in the stock
will be valued at the price of latest goods bought.
Date
Particula
r
Purchase Sale Closing stock
Units
Unit
price TC Units Price TC
Unit Cost
Jan-1
Beginning
stock 500 £20 £10,000 500@20 £10,000
Jan-18 Purchasse 800 £24 £19,200
500@20
800@24
£29,200
Jan-25 Purchase 700 £26 £18,200
500@20
800@24
700@26
£47,400
Jan-25 Sales 500 £20 £10,000
800 £24 £19,200
100 £26 £2,600
1400 £31,800
Jan-31
Closing
inventory
600@26 £15,600
(2) Last-in, First-out
It is just inverse to the opposite one, which states that over the period, prices goes up,
therefore, goods that is bought latest will dispose off first (Li and Sun, 2016). However, on the
other side, material that remains left in the stock is the part of stock that bought initially.
Date
Particul
ar
Purchase Sale Closing stock
Units
Unit
price
Total
cost Units
Unit
price
Total
cost
Unit with
rate
Total
cost
Jan-1
Beginning
stock 500 £20 £10,000 500@20 £10,000
Jan-18 Purchase 800 £24 £19,200
500@20
800@24
£29,200
Jan-25 Purchase 700 £26 £18,200
500 units
at 20
800 units
at 24
700 units
at 26
£47,400
Jan-25 Sales 700 £26 £18,200
700 £24 £16,800
1400 £35,000
Jan-31
Closing
stock
100 at 24
500 at 20
£12,400
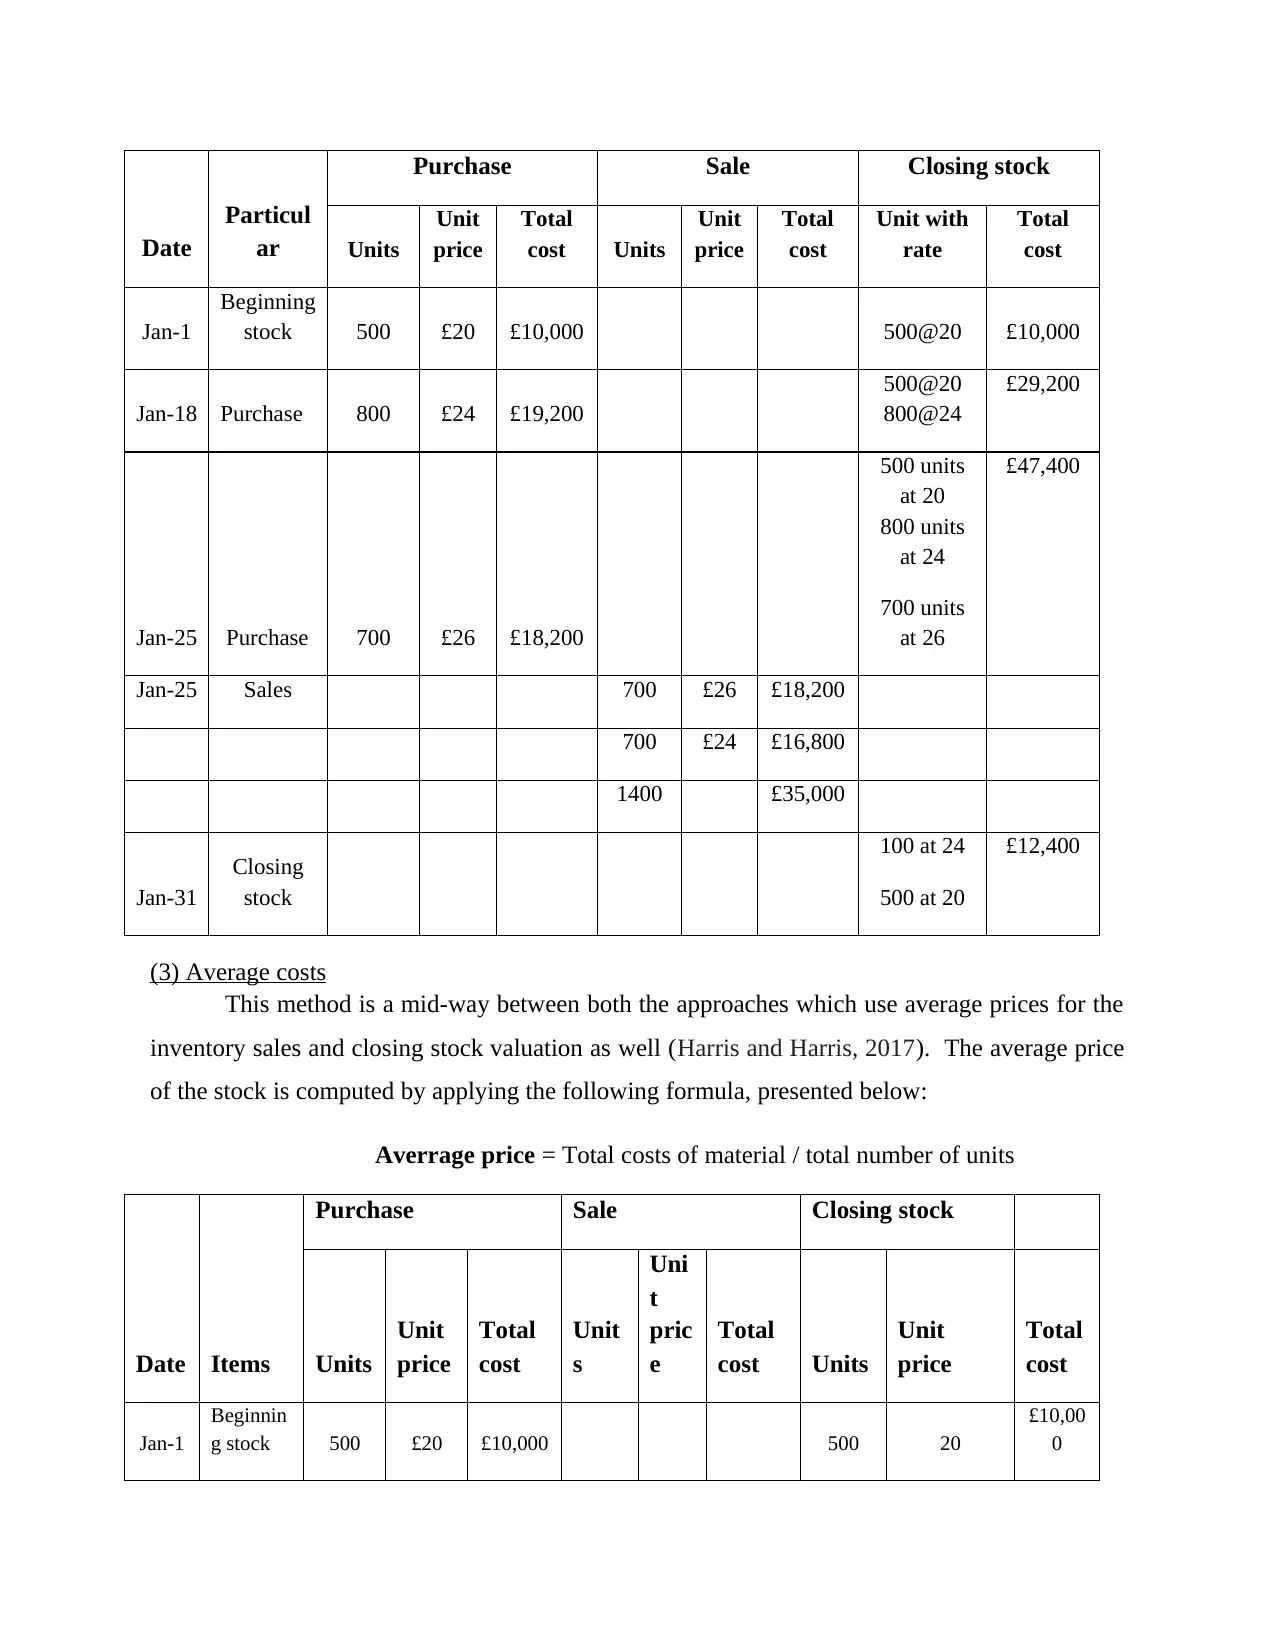
(3) Average costs
This method is a mid-way between both the approaches which use average prices for the
inventory sales and closing stock valuation as well (Harris and Harris, 2017). The average price
of the stock is computed by applying the following formula, presented below:
Averrage price = Total costs of material / total number of units
Date Items
Purchase Sale Closing stock
Units
Unit
price
Total
cost
Unit
s
Uni
t
pric
e
Total
cost Units
Unit
price
Total
cost
Jan-1
Beginnin
g stock 500 £20 £10,000 500 20
£10,00
0
Particul
ar
Purchase Sale Closing stock
Units
Unit
price
Total
cost Units
Unit
price
Total
cost
Unit with
rate
Total
cost
Jan-1
Beginning
stock 500 £20 £10,000 500@20 £10,000
Jan-18 Purchase 800 £24 £19,200
500@20
800@24
£29,200
Jan-25 Purchase 700 £26 £18,200
500 units
at 20
800 units
at 24
700 units
at 26
£47,400
Jan-25 Sales 700 £26 £18,200
700 £24 £16,800
1400 £35,000
Jan-31
Closing
stock
100 at 24
500 at 20
£12,400
(3) Average costs
This method is a mid-way between both the approaches which use average prices for the
inventory sales and closing stock valuation as well (Harris and Harris, 2017). The average price
of the stock is computed by applying the following formula, presented below:
Averrage price = Total costs of material / total number of units
Date Items
Purchase Sale Closing stock
Units
Unit
price
Total
cost
Unit
s
Uni
t
pric
e
Total
cost Units
Unit
price
Total
cost
Jan-1
Beginnin
g stock 500 £20 £10,000 500 20
£10,00
0
⊘ This is a preview!⊘
Do you want full access?
Subscribe today to unlock all pages.
Trusted by 1+ million students worldwide
Jan-
18 purchase 800 £24 £19,200
1,300 29,200/1300
= 22.46
£29,20
0
Jan-
25 Purchase 700 £26 £18,200
2,000 47,400/2000
= 23.7
£47,40
0
Jan-
25 Sales 1400 23.7 £33,180
Jan-
31
Closing
inventory
600 23.7 14,220
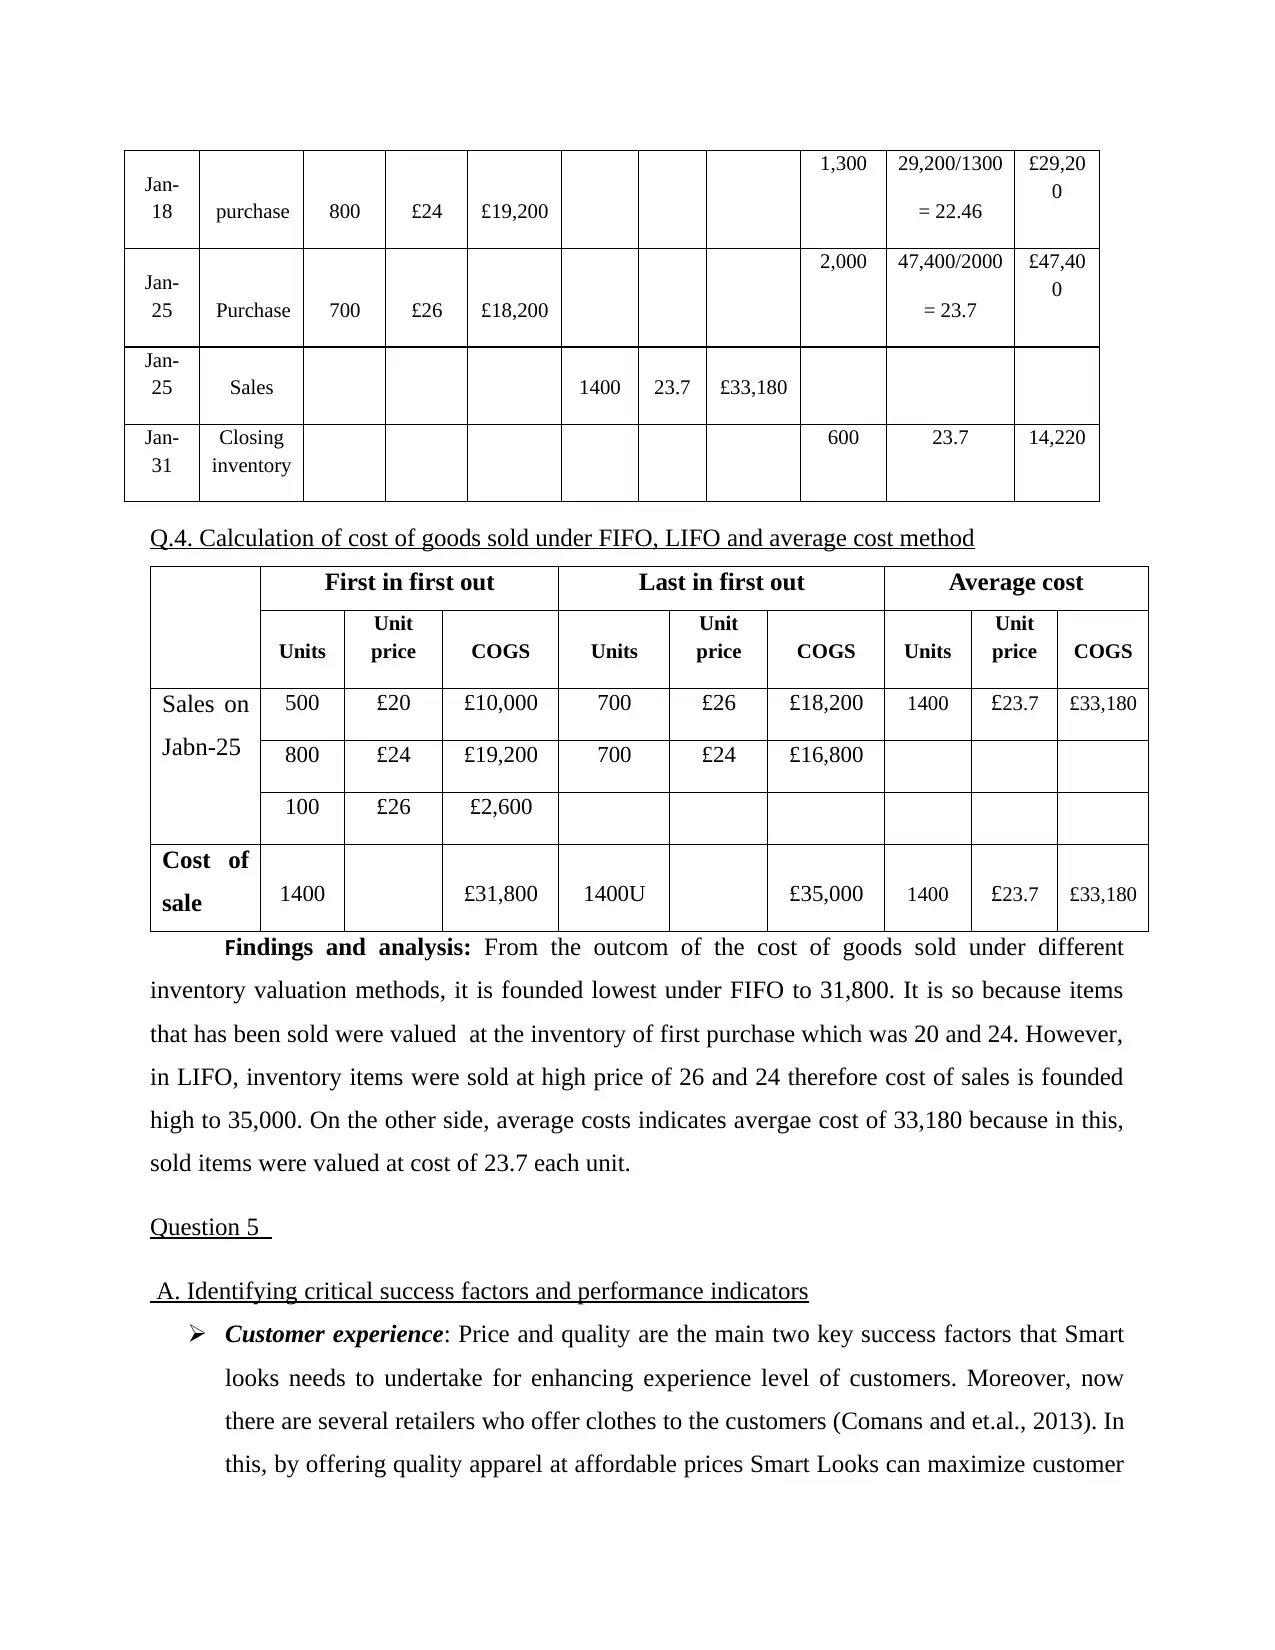
Q.4. Calculation of cost of goods sold under FIFO, LIFO and average cost method
First in first out Last in first out Average cost
Units
Unit
price COGS Units
Unit
price COGS Units
Unit
price COGS
Sales on
Jabn-25
500 £20 £10,000 700 £26 £18,200 1400 £23.7 £33,180
800 £24 £19,200 700 £24 £16,800
100 £26 £2,600
Cost of
sale 1400 £31,800 1400U £35,000 1400 £23.7 £33,180
Findings and analysis: From the outcom of the cost of goods sold under different
inventory valuation methods, it is founded lowest under FIFO to 31,800. It is so because items
that has been sold were valued at the inventory of first purchase which was 20 and 24. However,
in LIFO, inventory items were sold at high price of 26 and 24 therefore cost of sales is founded
high to 35,000. On the other side, average costs indicates avergae cost of 33,180 because in this,
sold items were valued at cost of 23.7 each unit.
Question 5
A. Identifying critical success factors and performance indicators
Customer experience: Price and quality are the main two key success factors that Smart
looks needs to undertake for enhancing experience level of customers. Moreover, now
there are several retailers who offer clothes to the customers (Comans and et.al., 2013). In
this, by offering quality apparel at affordable prices Smart Looks can maximize customer
18 purchase 800 £24 £19,200
1,300 29,200/1300
= 22.46
£29,20
0
Jan-
25 Purchase 700 £26 £18,200
2,000 47,400/2000
= 23.7
£47,40
0
Jan-
25 Sales 1400 23.7 £33,180
Jan-
31
Closing
inventory
600 23.7 14,220
Q.4. Calculation of cost of goods sold under FIFO, LIFO and average cost method
First in first out Last in first out Average cost
Units
Unit
price COGS Units
Unit
price COGS Units
Unit
price COGS
Sales on
Jabn-25
500 £20 £10,000 700 £26 £18,200 1400 £23.7 £33,180
800 £24 £19,200 700 £24 £16,800
100 £26 £2,600
Cost of
sale 1400 £31,800 1400U £35,000 1400 £23.7 £33,180
Findings and analysis: From the outcom of the cost of goods sold under different
inventory valuation methods, it is founded lowest under FIFO to 31,800. It is so because items
that has been sold were valued at the inventory of first purchase which was 20 and 24. However,
in LIFO, inventory items were sold at high price of 26 and 24 therefore cost of sales is founded
high to 35,000. On the other side, average costs indicates avergae cost of 33,180 because in this,
sold items were valued at cost of 23.7 each unit.
Question 5
A. Identifying critical success factors and performance indicators
Customer experience: Price and quality are the main two key success factors that Smart
looks needs to undertake for enhancing experience level of customers. Moreover, now
there are several retailers who offer clothes to the customers (Comans and et.al., 2013). In
this, by offering quality apparel at affordable prices Smart Looks can maximize customer
Paraphrase This Document
Need a fresh take? Get an instant paraphrase of this document with our AI Paraphraser
experience. Further, by making evaluation of sales revenue and profitability aspect with
the historical values Smart Looks can assess the impact of action undertaken.
Supplier and product quality: Clothing retailer can build highly prominent relationship
with the suppliers by making payment on time. Besides this, smart looks can enhance and
maintain the quality of clothes by using relevant tools and techniques such TQM (Kaplan
and Atkinson, 2015). Company can measure the satisfaction level of customers in relation
to product quality by taking feedback from them.
Operations efficiency: Smart looks can increase operational efficiency by making high
care of manufacturing equipments. Further, by encouraging personnel towards better
performance operational efficiency can be enhanced (Li, Richardson and Tuna, 2014).
Output generated by the firm is a main indicator which in turn helps in assessing the
extent to which operational efficiency is increased.
Reducing maintenance spending: Smart Looks can control spending by using high tech
equipments and employing budgetary control tool. By comparing the current spending
level of maintenance with planned Smart Looks can assess the level of deviations. In this
way, by undertaking strategic action for improvement Smart Look can attain success.
Cost reduction and profit maximization: By employing budgeting techniques Smart
Looks can make control on cost level. Further, by eliminating undesirable activities from
plan firm can reduce the level of cost significantly (Lord, 2007). This in turn helps in
maximizing profit to a great extent and thereby helps in achieving success.
B.
1. Identifying the ways through which cost level can be reduced
Cost is the one of the main elements that has direct impact on the profit margin
generated by firm. Hence, it is vital for Smart looks to make control on cost level and thereby
enjoys high profit margin. In this regard, by employing variance analysis or standard costing
method business unit make evaluation of performance of each department on a periodical basis.
By making assessment and identifying deviations Smart looks can strategic action for
improvement within the suitable time frame (What is Budgeting? What is a Budget, 2017). In
this way, by taking timely action level of overspending can be reduced to a great extent. In
addition to this, by employing zero bases budgeting technique clothing retailer can make suitable
allocation and thereby would become able to spend money in an effectual way. All such
techniques provide high level of assistance in avoid high spending and thereby helps in
maintaining suitable cost level.
2. Assessing the manner in which quality can be enhanced
Quality of the fabric is one of the main factors that have great impact on the decision
making of customers. Hence, by undertaking total quality management technique Smart Looks
can evolve high level of satisfaction among the customers. It is continual improvement technique
which places emphasis on making improvement in the process, products or services. Hence,
TQM may be served as a strategic and systematic approach which lays high level of focus on
identifying defects and thereby helps in taking action for improvement within the suitable time
fame (What is total quality management (TQM), 2017). Hence, expectation level of stakeholders
can be met by Smart Looks through the means of total quality management technique. Moreover,
such technique enables firm to enhance the efficiency level of operations.
TASK 2
Q.6.
(A). Meaning of budget
Budget is a financial plan that is prepared by the business manmagers to find out the
amount of money being available for the spending purpose and also estimates the projected
expenditures in the future period. Thus, the key focus of it is to figure out the amount of expected
earnings of the business from sales and the prospective expenses as a result of material purchase,
labor’s wages and other fixed & varible spending (Deegan, 2013). The excess of incoming of
revenues over the monetary outgoings, expenses is reported as surplus or deficit, and helps in
making proper planning & strategies for optimum allocation and use of funds for curtailing cost
and maximizing sales to assure adequate surplus.
(B). Purpose or objectives of budgetary planning
The main key objectives or purpose behind constructing budgets are enumerated here
below:
⊘ This is a preview!⊘
Do you want full access?
Subscribe today to unlock all pages.
Trusted by 1+ million students worldwide
1 out of 23