ECON6000: Report on Factors Influencing Schmeckt Gut Energy Bar Demand
VerifiedAdded on 2021/05/31
|14
|4400
|71
Report
AI Summary
This report, prepared for the board of directors of Schmeckt Gut, analyzes the factors influencing the demand for a new energy bar. The report examines macroeconomic variables like income growth, inflation, and import tariffs, using market analysis data and regression analysis to understand their impact on product demand. It discusses the interrelation of these variables, referencing economic theories and models to explain the linkages. The findings reveal that inflation, income, and tariffs significantly affect demand. The study provides a detailed analysis of the data, including a table showing the demand for the product of Schmeckt Gut corresponding to the income, inflation, number of gyms and the import tariff in different quarters between the year 2011 and 2015. The report also includes recommendations based on the analysis and matching estimations of the variables that influence the demand for the products, offering insights into how Schmeckt Gut can optimize its marketing strategies and anticipate market changes. The report utilizes data and information from journals and articles related to the topic and online sources to understand the marketing analysis of organizations for the purpose of new product introduction in the market. The analysis helps to understand the impact of different predictions on the demand for the product.

Page 1 of 14
ECON6000 ECONOMIC PRINCIPLES & DECISION MAKING
ASSESSMENT 3: REPORT
ECON6000 ECONOMIC PRINCIPLES & DECISION MAKING
ASSESSMENT 3: REPORT
Paraphrase This Document
Need a fresh take? Get an instant paraphrase of this document with our AI Paraphraser
Page 2 of 14
Executive summary
This paper contains a report which is directed to the board of directors of Schmeckt Gut
regarding the introduction of the new energy bars. The marketing department of the company
carries out analysis and finds out estimation of the changes in the values of the variable and
the changes in the demand for the product. This paper aims at discussing the linkages
between variables that influence the demand for the product. The linkages among the
variables and the possibilities of different values of the variables have also been discussed
referring to the theories and models of macroeconomics. Subsequently, the paper carries out
regression analyses on the data provided by the marketing department of Schmeckt Gut to
find out that the inflation has the impact on the changes in the demand for the product. The
paper also includes recommendations based on the different matching estimation of the
variables that have the capabilities to influence the demand for the products.
Page 3 of 14
Table of contents
1.0 Introduction..........................................................................................................................4
2.0 Methods................................................................................................................................4
3.0 Findings................................................................................................................................4
3.1 Matching of the figures and the explanation....................................................................5
3.2 The impacts of different predictions on the demand for the product...............................6
4.0 Recommendations..............................................................................................................10
5.0 Conclusion..........................................................................................................................11
Reference..................................................................................................................................12
⊘ This is a preview!⊘
Do you want full access?
Subscribe today to unlock all pages.
Trusted by 1+ million students worldwide
Page 4 of 14
1.0 Introduction
Market analysis is an important function for any organization before the introduction of new
product in the market. This analysis allows the management of the organization to study
different factors of economy and their impacts on the demand for the upcoming products.
Among the economic factors, the income growth of the consumers of the market, inflation
rate and the tariff on import plays an important role. The income growth is the direct
influence of the demand for goods and services of the market as with the higher income the
customers of the market would be more likely to buy goods. The inflation rate can help the
management to understand the unemployment rate in the economy which has a negative
relation to the demand for goods and services. Lastly, the tariff on the import in a particular
industry shapes the competition among different types of sellers of the market. This paper
aims at analyzing the case of Schmeckt Gut which is planning to introduce a new energy bar
in the market. Taking into consideration the results of the market analysis, this paper
discusses how different external factors influence the potential demand for the energy bar of
the company.
2.0 Methods
This paper uses the data and information presented in other journal and article related to the
topic of the paper. Apart from that, information has also been collected from online sources
as well which discusses the process of marketing analysis of the organizations for the purpose
of new product introduction in the market. The study uses the marketing analysis data for the
process of multiple linear regressions in order to understand the relationship between the
variables. Apart from that, the study also uses the content analysis technique to analyze
descriptive data presented in the related journals and articles.
3.0 Findings
As per the findings from the study, there are a number of variables which influences the
demand for the product of Schmeckt Gut. While the inflation has the indirect impact on the
demand through the increased employment, the tariff also plays a part in generating the
demand for the product. The regression analysis suggests that although the income is one of
the important factors that determine the demand for the product, changes in the income
changes the demand for the product slightly. Apart from that, the number of gyms also has its
part to play in the changes in demand for the product of Schmeckt Gut.
3.1 Matching of the figures and the explanation
Yes, the figures of the estimation can be linked with each other with the help of different
economic theories and models. It is important to note that the macroeconomic variables are
Paraphrase This Document
Need a fresh take? Get an instant paraphrase of this document with our AI Paraphraser
Page 5 of 14
interrelated to each other and hence the changes in one variable influence the other variables
of the economy. Galí (2015) stated that this interrelation provides a challenge to the business
owners and the government to decide on the policies to be taken for the organization and for
the country respectively.
The income of the people of the economy and the inflation is related to each other in a strong
way. This can be shown using the aggregate demand and supply for the products and the
services of the economy. As the income of the customers of the market rises, they demand
more of products and services which are being sold in the market. Mokyr (2018) highlighted
that this is due to the immediate increase in the purchasing powers of the consumers of the
market. Consequently, the demand for the products of the economy increases leading to a
rightward shift in the aggregate demand, while the supply of the market remains constant.
This results in an increased price for the goods and services of the market and the increased
consumption. Thus, the income of the people of the economy also allows the economy to
grow. However, as Tomczak, Reinecke & Kuss (2018) pointed out that this growth of the
economy comes with a cost those higher prices of the products and services of the market
corresponding to higher incomes of the consumer, increases the inflation as well.
Furthermore, the Phillips curve shows the relationship between the unemployment level of
the economy and the inflation rate. As per the theory, the inflation is also dependent on the
unemployment rate of the economy. At a low level of unemployment, the growth of wage is
the most and hence this also influences the inflation of the economy. Bloom, Sadun & Van
Reenen (2015) stated that these are all the basic characteristics of boom phase of a business
cycle where the economic production increases. With the increase in the production the
demand for the labor increases and with the bargaining power the labor unions enjoy even
more wages. It is assumed that maximum part of the income of the people of the economy is
from the wage they receive (Juster, 2015). Thus, in the boom phase, as the labor demand
rises, the demand for the products and the services of the economy also raises leading to an
increase in the price and eventually an increase in the inflation rate of the economy.
Additionally, the intention of the government to generate high tax revenue can bring down
the wages of the labors of the market. According to the Laffer curve, with the increase in the
government tax rate, the revenue of the government increases till a certain point after which it
starts to fall (Hicks, 2018). This is due to the fact that high taxes can discourage the people of
the economy to work as most part of the wage would be taken away by the government.
Thus, after a certain point, the tax revenue would start to fall. Kagel & Roth (2016) stated that
the objective of the government is to determine a golden level of tax rate so that the tax
Page 6 of 14
revenue collected by the government is the maximum. This theory states why inflation does
not grow in equal magnitude as the increase in the wages of the labor. As the labors of the
economy start to earn more wages, they also become liable to pay taxes to the government
and hence a part of the increase in wage that would potentially increase the inflation of the
economy would be siphoned off as a form of tax by the government (Fuller, 2016).
In terms of tariff rate which provides opportunities to the domestic organization to enjoy the
market share and becomes able to enjoy the control over the market. Kuratko, Hornsby &
Hayton (2015) higher income tariff discourages the importers and demand for the domestic
product rises. Consequently, the rise in the production and its associated benefits which have
been discussed above is accrued mainly to the home economy benefiting the domestic
consumers rather than the foreign economy and their consumers (Nandy et al.2015). In
general, the higher the tariff rate the more would be the increase in the wage of the domestic
labor following the increase in the demand for the goods and service produced by the
domestic producers (Berry & Kato, 2018). Therefore, each economic variable is linked to
each other and changes in one variable changes the other variables either directly or
indirectly.
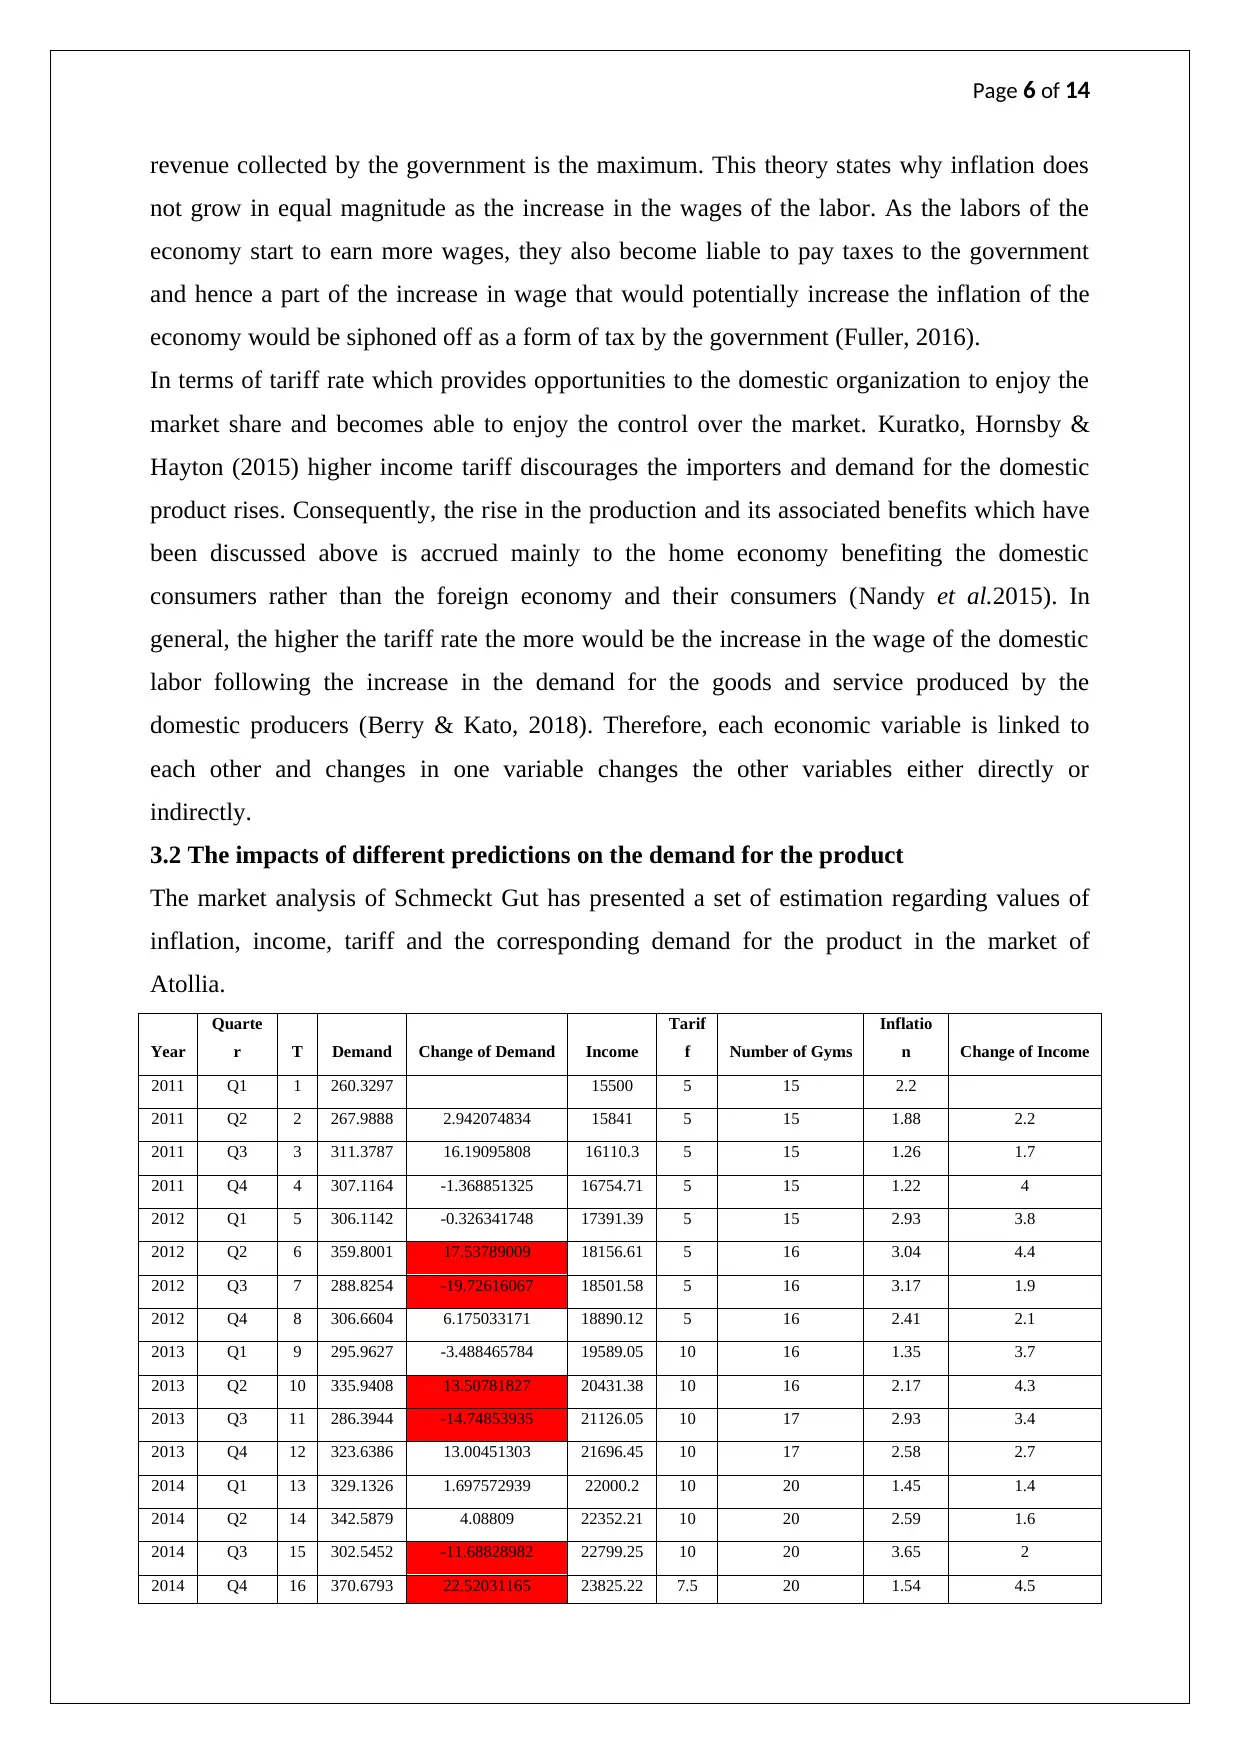
3.2 The impacts of different predictions on the demand for the product
The market analysis of Schmeckt Gut has presented a set of estimation regarding values of
inflation, income, tariff and the corresponding demand for the product in the market of
Atollia.
Year
Quarte
r T Demand Change of Demand Income
Tarif
f Number of Gyms
Inflatio
n Change of Income
2011 Q1 1 260.3297 15500 5 15 2.2
2011 Q2 2 267.9888 2.942074834 15841 5 15 1.88 2.2
2011 Q3 3 311.3787 16.19095808 16110.3 5 15 1.26 1.7
2011 Q4 4 307.1164 -1.368851325 16754.71 5 15 1.22 4
2012 Q1 5 306.1142 -0.326341748 17391.39 5 15 2.93 3.8
2012 Q2 6 359.8001 17.53789009 18156.61 5 16 3.04 4.4
2012 Q3 7 288.8254 -19.72616067 18501.58 5 16 3.17 1.9
2012 Q4 8 306.6604 6.175033171 18890.12 5 16 2.41 2.1
2013 Q1 9 295.9627 -3.488465784 19589.05 10 16 1.35 3.7
2013 Q2 10 335.9408 13.50781827 20431.38 10 16 2.17 4.3
2013 Q3 11 286.3944 -14.74853935 21126.05 10 17 2.93 3.4
2013 Q4 12 323.6386 13.00451303 21696.45 10 17 2.58 2.7
2014 Q1 13 329.1326 1.697572939 22000.2 10 20 1.45 1.4
2014 Q2 14 342.5879 4.08809 22352.21 10 20 2.59 1.6
2014 Q3 15 302.5452 -11.68828982 22799.25 10 20 3.65 2
2014 Q4 16 370.6793 22.52031165 23825.22 7.5 20 1.54 4.5
revenue collected by the government is the maximum. This theory states why inflation does
not grow in equal magnitude as the increase in the wages of the labor. As the labors of the
economy start to earn more wages, they also become liable to pay taxes to the government
and hence a part of the increase in wage that would potentially increase the inflation of the
economy would be siphoned off as a form of tax by the government (Fuller, 2016).
In terms of tariff rate which provides opportunities to the domestic organization to enjoy the
market share and becomes able to enjoy the control over the market. Kuratko, Hornsby &
Hayton (2015) higher income tariff discourages the importers and demand for the domestic
product rises. Consequently, the rise in the production and its associated benefits which have
been discussed above is accrued mainly to the home economy benefiting the domestic
consumers rather than the foreign economy and their consumers (Nandy et al.2015). In
general, the higher the tariff rate the more would be the increase in the wage of the domestic
labor following the increase in the demand for the goods and service produced by the
domestic producers (Berry & Kato, 2018). Therefore, each economic variable is linked to
each other and changes in one variable changes the other variables either directly or
indirectly.
3.2 The impacts of different predictions on the demand for the product
The market analysis of Schmeckt Gut has presented a set of estimation regarding values of
inflation, income, tariff and the corresponding demand for the product in the market of
Atollia.
Year
Quarte
r T Demand Change of Demand Income
Tarif
f Number of Gyms
Inflatio
n Change of Income
2011 Q1 1 260.3297 15500 5 15 2.2
2011 Q2 2 267.9888 2.942074834 15841 5 15 1.88 2.2
2011 Q3 3 311.3787 16.19095808 16110.3 5 15 1.26 1.7
2011 Q4 4 307.1164 -1.368851325 16754.71 5 15 1.22 4
2012 Q1 5 306.1142 -0.326341748 17391.39 5 15 2.93 3.8
2012 Q2 6 359.8001 17.53789009 18156.61 5 16 3.04 4.4
2012 Q3 7 288.8254 -19.72616067 18501.58 5 16 3.17 1.9
2012 Q4 8 306.6604 6.175033171 18890.12 5 16 2.41 2.1
2013 Q1 9 295.9627 -3.488465784 19589.05 10 16 1.35 3.7
2013 Q2 10 335.9408 13.50781827 20431.38 10 16 2.17 4.3
2013 Q3 11 286.3944 -14.74853935 21126.05 10 17 2.93 3.4
2013 Q4 12 323.6386 13.00451303 21696.45 10 17 2.58 2.7
2014 Q1 13 329.1326 1.697572939 22000.2 10 20 1.45 1.4
2014 Q2 14 342.5879 4.08809 22352.21 10 20 2.59 1.6
2014 Q3 15 302.5452 -11.68828982 22799.25 10 20 3.65 2
2014 Q4 16 370.6793 22.52031165 23825.22 7.5 20 1.54 4.5
⊘ This is a preview!⊘
Do you want full access?
Subscribe today to unlock all pages.
Trusted by 1+ million students worldwide
Page 7 of 14
2015 Q1 17 371.3411 0.17854018 24635.27 7.5 20 3.63 3.4
2015 Q2 18 445.1766 19.88346994 25423.6 7.5 20 2.22 3.2
2015 Q3 19 441.171 -0.899786865 26338.85 7.5 23 2.82 3.6
2015 Q4 20 446.9891 1.318787198 27471.42 7.5 23 3.26 4.3
Table 1: the schedule for the dependant and the independent variables
(Source: Developed by the learner)
This table shows the demand for the product of Schmeckt Gut corresponding to the income,
inflation, number of gyms and the import tariff in different quarters between the year 2011
and 2015. As per the data of the table 1, there has been a constant positive increase in the
income of the consumers of the economy (Boserup, 2017). However, corresponding demand
for the product of Schmeckt Gut has experienced a reduction in demand in some of the
quarters. This implies that, income of the consumers is not a single variable that significantly
influences the demand for the product of the company. Along with the income of the
consumers the tariff rate on the import and the number of gyms has also increased over the
years and quarters (Parker, 2018). Only variable that has fluctuated over the years is the
inflation level of the economy which has significantly influenced the demand for the product
of the company. In this case, the changes in the inflation rate of the economy changed the real
income of the consumers and hence demand altered (Mittal & Lassar, 2015).
0 0.1 0.2 0.3 0.4 0.5 0.6 0.7 0.8 0.9 1
0
0.5
1
1.5
2
2.5
3
3.5
4
Inflation
Inflation
Figure 1: the changes in the inflation rate
(Source: Developed by the learner)
The table marks the abrupt changes in the demand for products with red colors. These abrupt
changes have been due to the collective force of the independent variables on the demand.
For example, the quarter 2 of 2012 experienced an increase in the demand by 17.53% which
Paraphrase This Document
Need a fresh take? Get an instant paraphrase of this document with our AI Paraphraser
Page 8 of 14
is significantly more than the previous changes (Tietenberg & Lewis, 2016). It is also
important to note that in the since the quarter 4 of 2011 the increase in the income of the
consumer has been more than that of the inflation (Demil et al. 2015). That implies a
significant increase in the real income of the consumer. This trend continued until the 2nd
quarter of the year 2012 and after that, the inflation of the economy outpaced the increase in
the income of the consumer of the economy. The effects of this can clearly be seen in the
changes in demand column which shows that the demand has decreased by 19.72%. This has
been the collective movement of the income of the consumer and the inflation of the
economy (Kempadoo, Sanghera & Pattanaik, 2015).
This also repeated in the 2nd and the 3rd quarter of the next year as well due to the same
reason. However, it is notable, that the magnitude of the changes in demand has been lower
than the magnitude of the last year. This is justified due to the increase in the import tariff
which is raised to 10% since the year 2013.
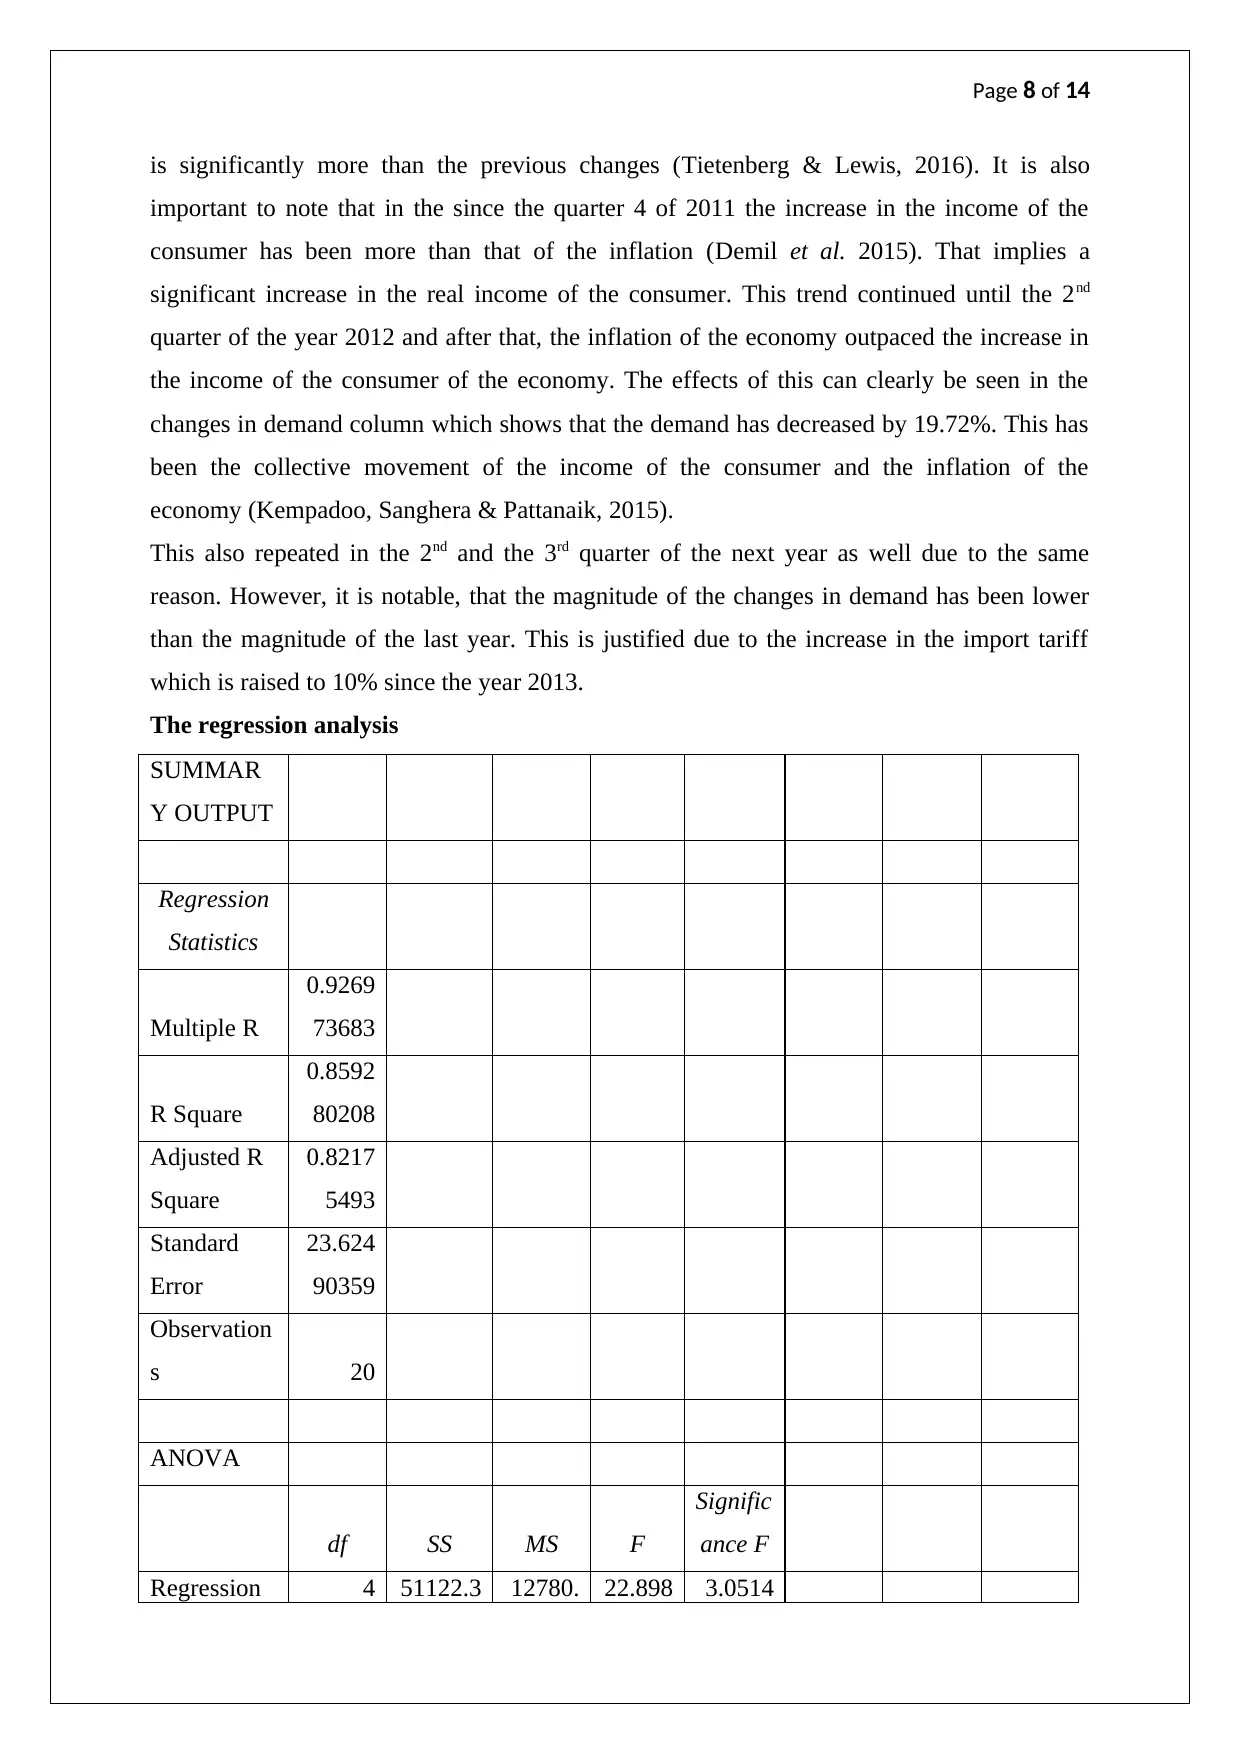
The regression analysis
SUMMAR
Y OUTPUT
Regression
Statistics
Multiple R
0.9269
73683
R Square
0.8592
80208
Adjusted R
Square
0.8217
5493
Standard
Error
23.624
90359
Observation
s 20
ANOVA
df SS MS F
Signific
ance F
Regression 4 51122.3 12780. 22.898 3.0514
is significantly more than the previous changes (Tietenberg & Lewis, 2016). It is also
important to note that in the since the quarter 4 of 2011 the increase in the income of the
consumer has been more than that of the inflation (Demil et al. 2015). That implies a
significant increase in the real income of the consumer. This trend continued until the 2nd
quarter of the year 2012 and after that, the inflation of the economy outpaced the increase in
the income of the consumer of the economy. The effects of this can clearly be seen in the
changes in demand column which shows that the demand has decreased by 19.72%. This has
been the collective movement of the income of the consumer and the inflation of the
economy (Kempadoo, Sanghera & Pattanaik, 2015).
This also repeated in the 2nd and the 3rd quarter of the next year as well due to the same
reason. However, it is notable, that the magnitude of the changes in demand has been lower
than the magnitude of the last year. This is justified due to the increase in the import tariff
which is raised to 10% since the year 2013.
The regression analysis
SUMMAR
Y OUTPUT
Regression
Statistics
Multiple R
0.9269
73683
R Square
0.8592
80208
Adjusted R
Square
0.8217
5493
Standard
Error
23.624
90359
Observation
s 20
ANOVA
df SS MS F
Signific
ance F
Regression 4 51122.3 12780. 22.898 3.0514
Page 9 of 14
6935 59234 70344 4E-06
Residual 15
8372.04
1044
558.13
60696
Total 19
59494.4
104
Coeffic
ients
Standar
d Error t Stat
P-
value
Lower
95%
Upper
95%
Lower
95.0%
Upper
95.0%
Intercept
96.594
41264
37.7236
3519
2.5605
80712
0.0217
36985
16.188
38794
177.00
04373
16.188
38794
177.00
04373
Income
0.0213
03405
0.00511
5048
4.1648
49735
0.0008
29812
0.0104
00939
0.0322
05871
0.0104
00939
0.0322
05871
Tariff
-
12.566
96474
3.07298
953
-
4.0894
91556
0.0009
66638
-
19.116
88684
-
6.0170
42629
-
19.116
88684
-
6.0170
42629
Number of
Gyms
-
4.2298
05825
6.22534
3614
-
0.6794
49375
0.5072
0338
-
17.498
81158
9.0391
99931
-
17.498
81158
9.0391
99931
Inflation
-
14.788
77013
7.76889
4901
-
1.9035
87359
0.0763
31026
-
31.347
77756
1.7702
37299
-
31.347
77756
1.7702
37299
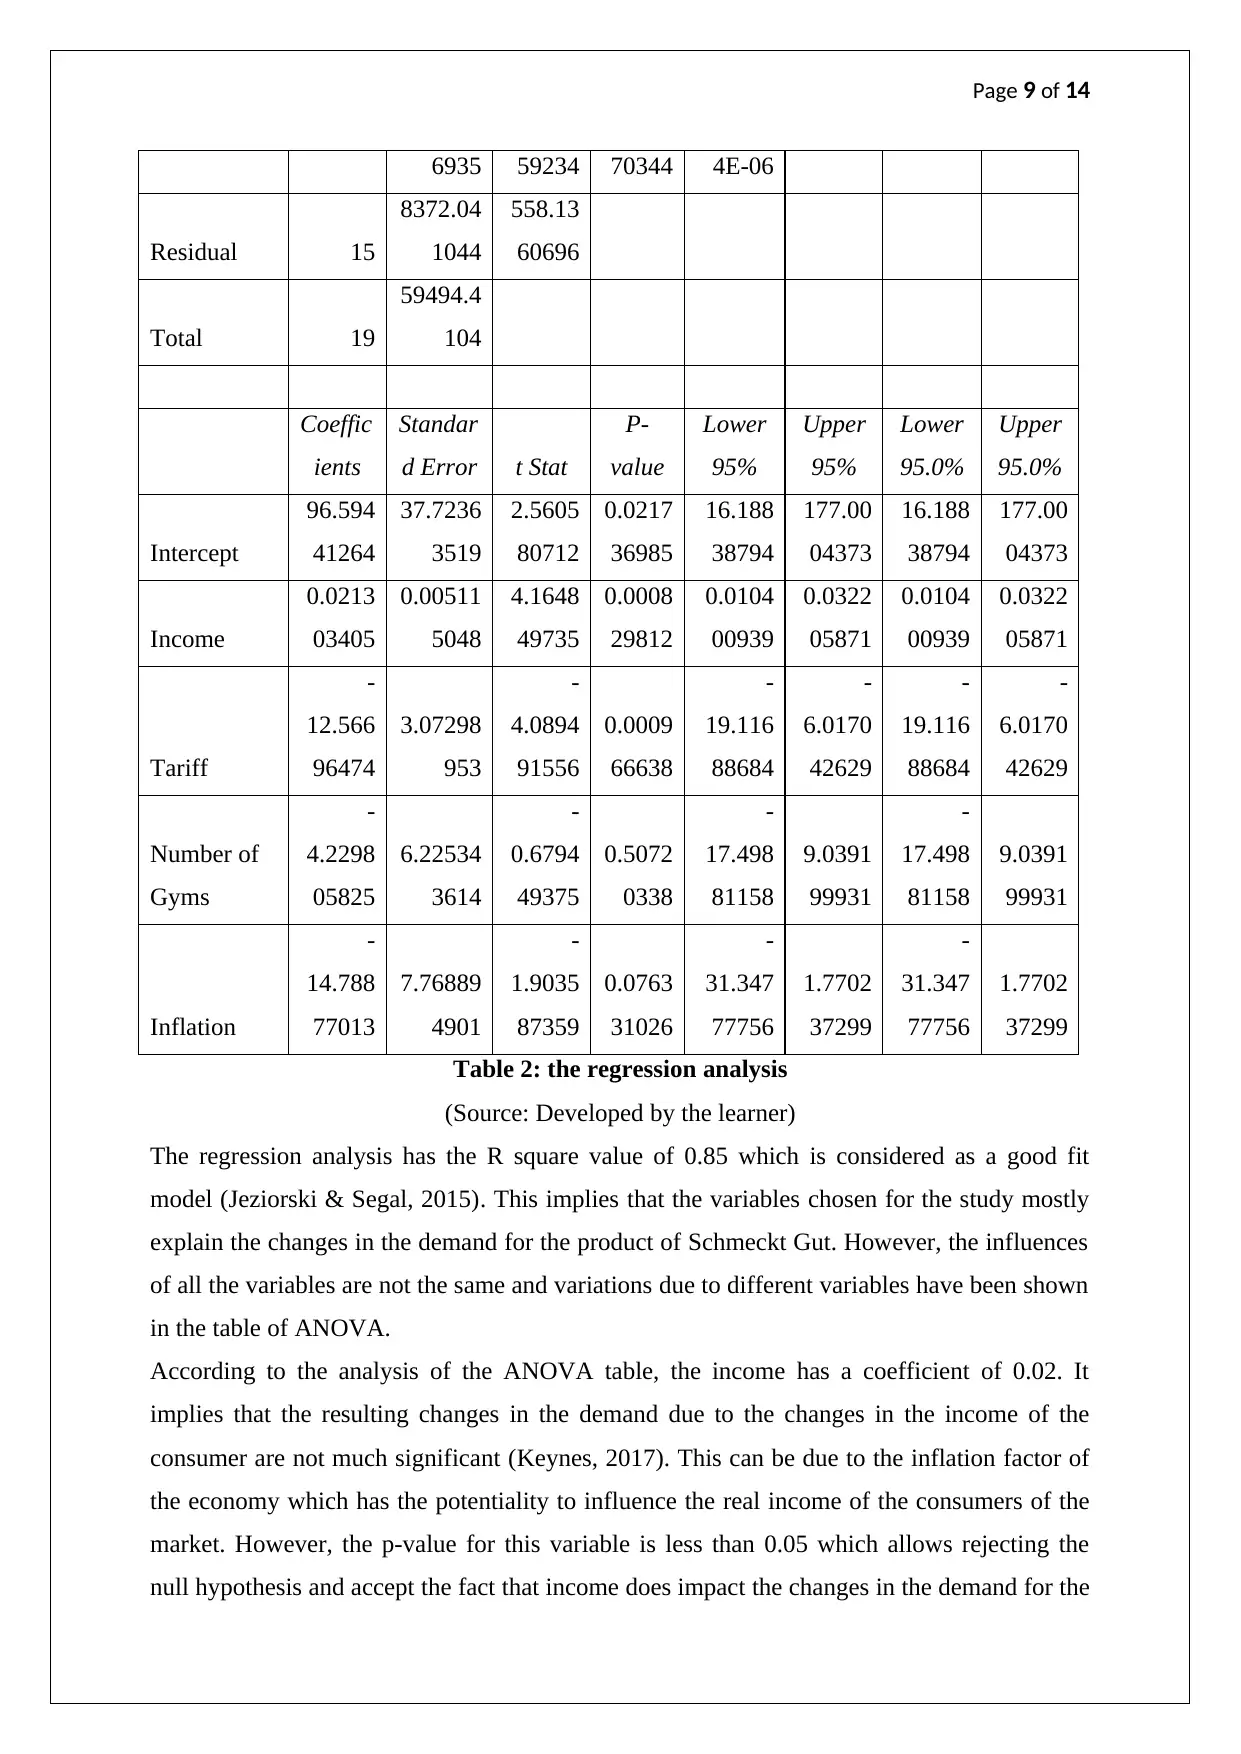
Table 2: the regression analysis
(Source: Developed by the learner)
The regression analysis has the R square value of 0.85 which is considered as a good fit
model (Jeziorski & Segal, 2015). This implies that the variables chosen for the study mostly
explain the changes in the demand for the product of Schmeckt Gut. However, the influences
of all the variables are not the same and variations due to different variables have been shown
in the table of ANOVA.
According to the analysis of the ANOVA table, the income has a coefficient of 0.02. It
implies that the resulting changes in the demand due to the changes in the income of the
consumer are not much significant (Keynes, 2017). This can be due to the inflation factor of
the economy which has the potentiality to influence the real income of the consumers of the
market. However, the p-value for this variable is less than 0.05 which allows rejecting the
null hypothesis and accept the fact that income does impact the changes in the demand for the
6935 59234 70344 4E-06
Residual 15
8372.04
1044
558.13
60696
Total 19
59494.4
104
Coeffic
ients
Standar
d Error t Stat
P-
value
Lower
95%
Upper
95%
Lower
95.0%
Upper
95.0%
Intercept
96.594
41264
37.7236
3519
2.5605
80712
0.0217
36985
16.188
38794
177.00
04373
16.188
38794
177.00
04373
Income
0.0213
03405
0.00511
5048
4.1648
49735
0.0008
29812
0.0104
00939
0.0322
05871
0.0104
00939
0.0322
05871
Tariff
-
12.566
96474
3.07298
953
-
4.0894
91556
0.0009
66638
-
19.116
88684
-
6.0170
42629
-
19.116
88684
-
6.0170
42629
Number of
Gyms
-
4.2298
05825
6.22534
3614
-
0.6794
49375
0.5072
0338
-
17.498
81158
9.0391
99931
-
17.498
81158
9.0391
99931
Inflation
-
14.788
77013
7.76889
4901
-
1.9035
87359
0.0763
31026
-
31.347
77756
1.7702
37299
-
31.347
77756
1.7702
37299
Table 2: the regression analysis
(Source: Developed by the learner)
The regression analysis has the R square value of 0.85 which is considered as a good fit
model (Jeziorski & Segal, 2015). This implies that the variables chosen for the study mostly
explain the changes in the demand for the product of Schmeckt Gut. However, the influences
of all the variables are not the same and variations due to different variables have been shown
in the table of ANOVA.
According to the analysis of the ANOVA table, the income has a coefficient of 0.02. It
implies that the resulting changes in the demand due to the changes in the income of the
consumer are not much significant (Keynes, 2017). This can be due to the inflation factor of
the economy which has the potentiality to influence the real income of the consumers of the
market. However, the p-value for this variable is less than 0.05 which allows rejecting the
null hypothesis and accept the fact that income does impact the changes in the demand for the
⊘ This is a preview!⊘
Do you want full access?
Subscribe today to unlock all pages.
Trusted by 1+ million students worldwide
Page 10 of 14
product of the company (Migliore, Schifani & Cembalo, 2015). It is important to note that,
the most effective variable which has the highest power to influence the demand for the
product is the inflation having the coefficient 14.78. That implies, for one unit increase in the
inflation of the economy, the demand for the product of the company would increase by 14
units (Şeref, Carrillo & Yenipazarli, 2016). Although, it can be confusing as to how the
inflation level of the economy can influence the demand. For that, the Phillips curve which
has been addressed in the earlier part of the study needs to be referred (Hitomi, 2017). The
reduction in the unemployment increases the inflation of the economy which in turn, in this
case, influences the demand for the product.
Additionally, the analysis also shows that the tariff rate of the industry also has a positive
impact on the change in the demand for the product. The table shows that the coefficient of
the tariff is 12.56 which are the second largest (Chua, Chrisman & De Massis, 2015). That
means with one unit increase in the tariff rate, the demand for the product increases. This is
due to the fact that tariff allows the producer to compete steadily with the foreign
organizations. Lastly, the variable number of gyms also has its impact on the demand for the
number of gyms increases the demand for the energy bar increases (Liu & Lu, 2015). The
coefficient of this variable is 4.22 which is significant to influence the demand for the
product.
4.0 Recommendations
Based on the study of the paper and the result of the regression analysis, it is clear that there
are some of the market variables that influences and triggers the demand for the new product
of Schmeckt Gut. However, to ensure a smooth increase in the demand for the product there
are many of the things that the board of the director of the organization keeps in mind.
Scenario 1: The income growth =1%, inflation= 3% the tariff rate= 5%
In this scenario, the management of Schmeckt Gut needs to understand that the inflation is
more than the growth in the income of the consumers of the economy. Therefore, the real
income of the consumers is decreasing in this phases. Apart from that, low rate of tariff also
makes it easier for the consumers to import cheap substitute product from the foreign
economy which can reduce the demand for the product of the company. Given that situation,
it is recommended to reduce the price of the product in order to compete with the foreign
players.
Scenario 2: Income growth= 4%, inflation= 2% tariff rate= 5%
This is a scenario where the income of the consumers of the market is more than the inflation
rate. Therefore the real income of the consumers is high. However, low inflation rate suggests
Paraphrase This Document
Need a fresh take? Get an instant paraphrase of this document with our AI Paraphraser
Page 11 of 14
that the economy is not in the full employment. Nevertheless, the demand for the product is
still high and given the fact that the tariff rate is low it is recommended to the management of
Schmeckt Gut to increase the price of the product in order to enjoy the higher revenue from
the sales of the product.
Scenario 3: Income growth rate =2% inflation= 2% the tariff rate= 10%
This is a scenario where the income growth of the consumer matches with the inflation rate of
the economy and the real income of the consumers remain the same. However, it needs to be
noted that the Tariff rate set for the industry, in this case, is very high discouraging any kinds
of import activities of any substitute products. Therefore it is recommended to the company
to take advantage of this scenario and increase the price of the product in order to extract
gains from the market.
5.0 Conclusion
Therefore the paper furnishes that the projected variables are all linked with each other and
changes in one variable causes the other variable to change. The theories of economics
suggested that in the boom phase of the economy the demand for the product and the services
of the economy increases leading to an increase in the labor demand and hence the reduction
in the unemployment rate. In turn, the unemployment rate is also related to the inflation
through the Phillips curve. This shows as the unemployment reduces the economy the
inflation rate of the economy rises up. Given this information, the data of the marketing
department of the company is subsequently analysed. According to the results of the
regression analysis, the inflation is the strongest variable that influences the demand for the
product of Schmeckt Gut. In addition to that the tariff rate imposed by the industry is also
significant when it comes to the case of impact on the change of demand for the product of
the company. Lastly, based on the analysis, the paper furnishes recommendations to the board
of directors regarding how each of the matching prediction can be dealt with by the company.
Page 12 of 14
Reference
Berry, D., & Kato, T. (2018). Introduction. In Employee Ownership and Employee
Involvement at Work: Case Studies(pp. 1-6). Emerald Publishing Limited.
Bloom, N., Sadun, R., & Van Reenen, J. (2015). Do private equity owned firms have better
management practices?. American Economic Review, 105(5), 442-46.
Boserup, E. (2017). The conditions of agricultural growth: The economics of agrarian
change under population pressure. Routledge.
Chua, J. H., Chrisman, J. J., & De Massis, A. (2015). A closer look at socioemotional wealth:
Its flows, stocks, and prospects for moving forward. Entrepreneurship Theory and
Practice, 39(2), 173-182.
Demil, B., Lecocq, X., Ricart, J. E., & Zott, C. (2015). Introduction to the SEJ special issue
on business models: business models within the domain of strategic
entrepreneurship. Strategic Entrepreneurship Journal, 9(1), 1-11.
Fuller, G. W. (2016). New food product development: from concept to marketplace. CRC
Press.
Galí, J. (2015). Monetary policy, inflation, and the business cycle: an introduction to the new
Keynesian framework and its applications. Princeton University Press.
Hicks, A. L. (2018). Saving energy through multifunctional consumer products: an analysis
utilizing current literature and life cycle assessment methodology. The International
Journal of Life Cycle Assessment, 23(2), 267-278.
Hitomi, K. (2017). Manufacturing Systems Engineering: A Unified Approach to
Manufacturing Technology, Production Management and Industrial Economics.
Routledge.
Jeziorski, P., & Segal, I. (2015). What makes them click: Empirical analysis of consumer
demand for search advertising. American Economic Journal: Microeconomics, 7(3),
24-53.
Juster, F. T. (2015). Anticipations and purchases: An analysis of consumer behavior.
Princeton University Press.
⊘ This is a preview!⊘
Do you want full access?
Subscribe today to unlock all pages.
Trusted by 1+ million students worldwide
1 out of 14
Related Documents


Your All-in-One AI-Powered Toolkit for Academic Success.
+13062052269
info@desklib.com
Available 24*7 on WhatsApp / Email
![[object Object]](/_next/static/media/star-bottom.7253800d.svg)
Unlock your academic potential
Copyright © 2020–2026 A2Z Services. All Rights Reserved. Developed and managed by ZUCOL.