Traffic Monitoring System for Mobile Apps
VerifiedAdded on 2019/09/16
|12
|2854
|316
Report
AI Summary
The assignment content is about developing a traffic monitoring system that prevents the web server from mistaking it as an attack. The project will be developed solo and will incorporate agile methodologies such as Scrum and Extreme Programming to ensure user-friendly, easy-to-use, flexible, and anticipatory of changing user demands. The project's workflow will consist of 26 weeks, starting with design and testing, followed by system testing reports, and finally, submitting the work. The technologies used will be PHP, HTML5, CSS, and Google Maps API.
Contribute Materials
Your contribution can guide someone’s learning journey. Share your
documents today.
Page 1 of 12
FACULTY OF SCIENCE, ENGINEERING
AND COMPUTING
School of Computing and Information Systems
BSc DEGREE
IN
Software engineering
PROJECT PROPOSAL
Name: Mohamed Amiin Mahmoud Ali
ID Number: K1463130
Project Title: U.K. road traffic monitoring website
Project type: Build
Date: 14/10/2016
Supervisor: Paul Neve
Did you discuss and agree the viability of your project idea with your supervisor? Yes
Did you submit a draft of your proposal to your supervisor? Yes
Did you receive feedback from your supervisor on any submitted draft? Yes
Secure Best Marks with AI Grader
Need help grading? Try our AI Grader for instant feedback on your assignments.
Page 2 of 12
PROPOSAL FEEDBACK
Student: Mohamed Amiin Mahmoud Ali
ID Number: K1463130
Supervisor: Paul Neve
Criteria Feedback
Abstract / Introduction
Aims & Objectives
Methodology
Data collection
Technology and resources /
Ethical Issues
Content
Abstract & Extension P3
Introduction P4
Objectives P4 - 5
Aims P5
Data collection P6
Methodology P7 - 8
Workflow P9 - 10
Abstract
Traffic blockage and congestion is a circumstance on transport networks that
happens as road use rises, and is described by slower speeds, longer journey
times, and vehicle queues. When traffic demand is high, the interaction between
vehicles slows the speed of the traffic stream, this results in congestion [1].
Technology & resources P11
Ethical issues P11
Bibliography P12
Page 3 of 12
When vehicles are fully stopped for periods of time are known as traffic
jam or traffic blockage. Traffic congestion can lead to drivers becoming frustrated
and being involved in road rage [1].
Yahoo! Traffic and Traffic.com are traffic information services that only provide
current information about traffic conditions in a specific area or region. Current
traffic information is still important and essential, but these reports sometimes
tend to be partial or incomplete, because their sources most of the time fails to
report the current traffic conditions. As a consequence, the user cannot assume
that there is no heavy traffic in a given location because that location was not
reported by these services.
Abstract extension
Nowadays, the users are only able to view and access past info statistics however not
present traffic or weather information. The system I will be offering will allow users
to look at the present information for traffic and weather reports. This could be
helpful when viewing data on a selected route, therefore users will be able to
determine the present conditions.
I don’t know in what way it would be helpful to drivers to view historic reports of
traffic. This description provides suggestions, and I should interview drivers to
explore with different ways to process with traffic info. There also are some issues
regarding current user interfaces, a way to style the system so it is quickly and safely
useable from an integral and touch screen while driving on a full or jammed road.
Studying traffic statistics is fascinating in its claim. My aim is to design a system to
help in studying traffic related figures from incidents and other causes of congestion.
Introduction
Congestion is costly for people who live in our city regions too, who find
themselves stuck in traffic when they should be at work or simply frustrated at
the time wasted in trying to get from point A to B [3].
Traffic on roads are made up of vehicles, cars, buses and other means of
transports, either singly or together, while using the public way for purposes of
travel. Traffic laws are the laws which govern traffic and regulate vehicles,
Page 4 of 12
while rules of the road are both the laws and the informal rules that may have
developed over time to facilitate the orderly and timely flow of traffic.
Traffic could also potentially slow into congestion and become disrupted from
reasons such as road works, or collisions. To prevent those kinds of events,
organisations usually produce better combinations of travel safety and efficiency;
they also have well established priorities such as right of way, lanes, and traffic
control at junctions.
Objectives
The aim of the project will be to deliver and provide useful information and data
about traffic in a specific geographical area in the U.K based on the history of
present-day weather, the time of the day and patterns of flowing traffic. This
information and data could then be used by road users (car drivers and
motorcycle riders) which could allow them to plan their journey ahead, and
choose the best time and alternative routes for their convenience at a chosen and
specified time.
The idea is to analyse historic traffic information collected over a period of time to
highlight locations which appear most frequently in the traffic advisories and thus
are likely to be subject to heavy traffic conditions even if they do not appear in
the current traffic suggested. Here are specific examples of services that could be
offered in the system:
- A traffic map which analyses traffic history across a specific area, depending
on the choice of the day or days of the week, weather conditions, and
severity of incidents,
- Traffic pattern history along a route between two end points, depending of
the time of the day and weather conditions,
If users preferred route could potentially suffer from heavy traffic for the specified
travel period, the website traffic system could:
- Allow the user to be offered an alternative diversion route,
- Recommend an alternative time to travel along a current route.
Traffic pattern is a function that describes the number of reported traffic incidents
depending on weather conditions and the time of day.
Paraphrase This Document
Need a fresh take? Get an instant paraphrase of this document with our AI Paraphraser
Page 5 of 12
Aims
The system I will be developing will gather and continuously collect weather and
traffic information from any geographical area within the U.K. Users will also be
able to access and view two types of statistic data of traffic events.
Users will be able to make some choices such as choosing the day of the week
including week-ends, event or incident severity from good to critical and of course
the condition of the weather on the chosen day (clear/sunny, rain, snow, mist).
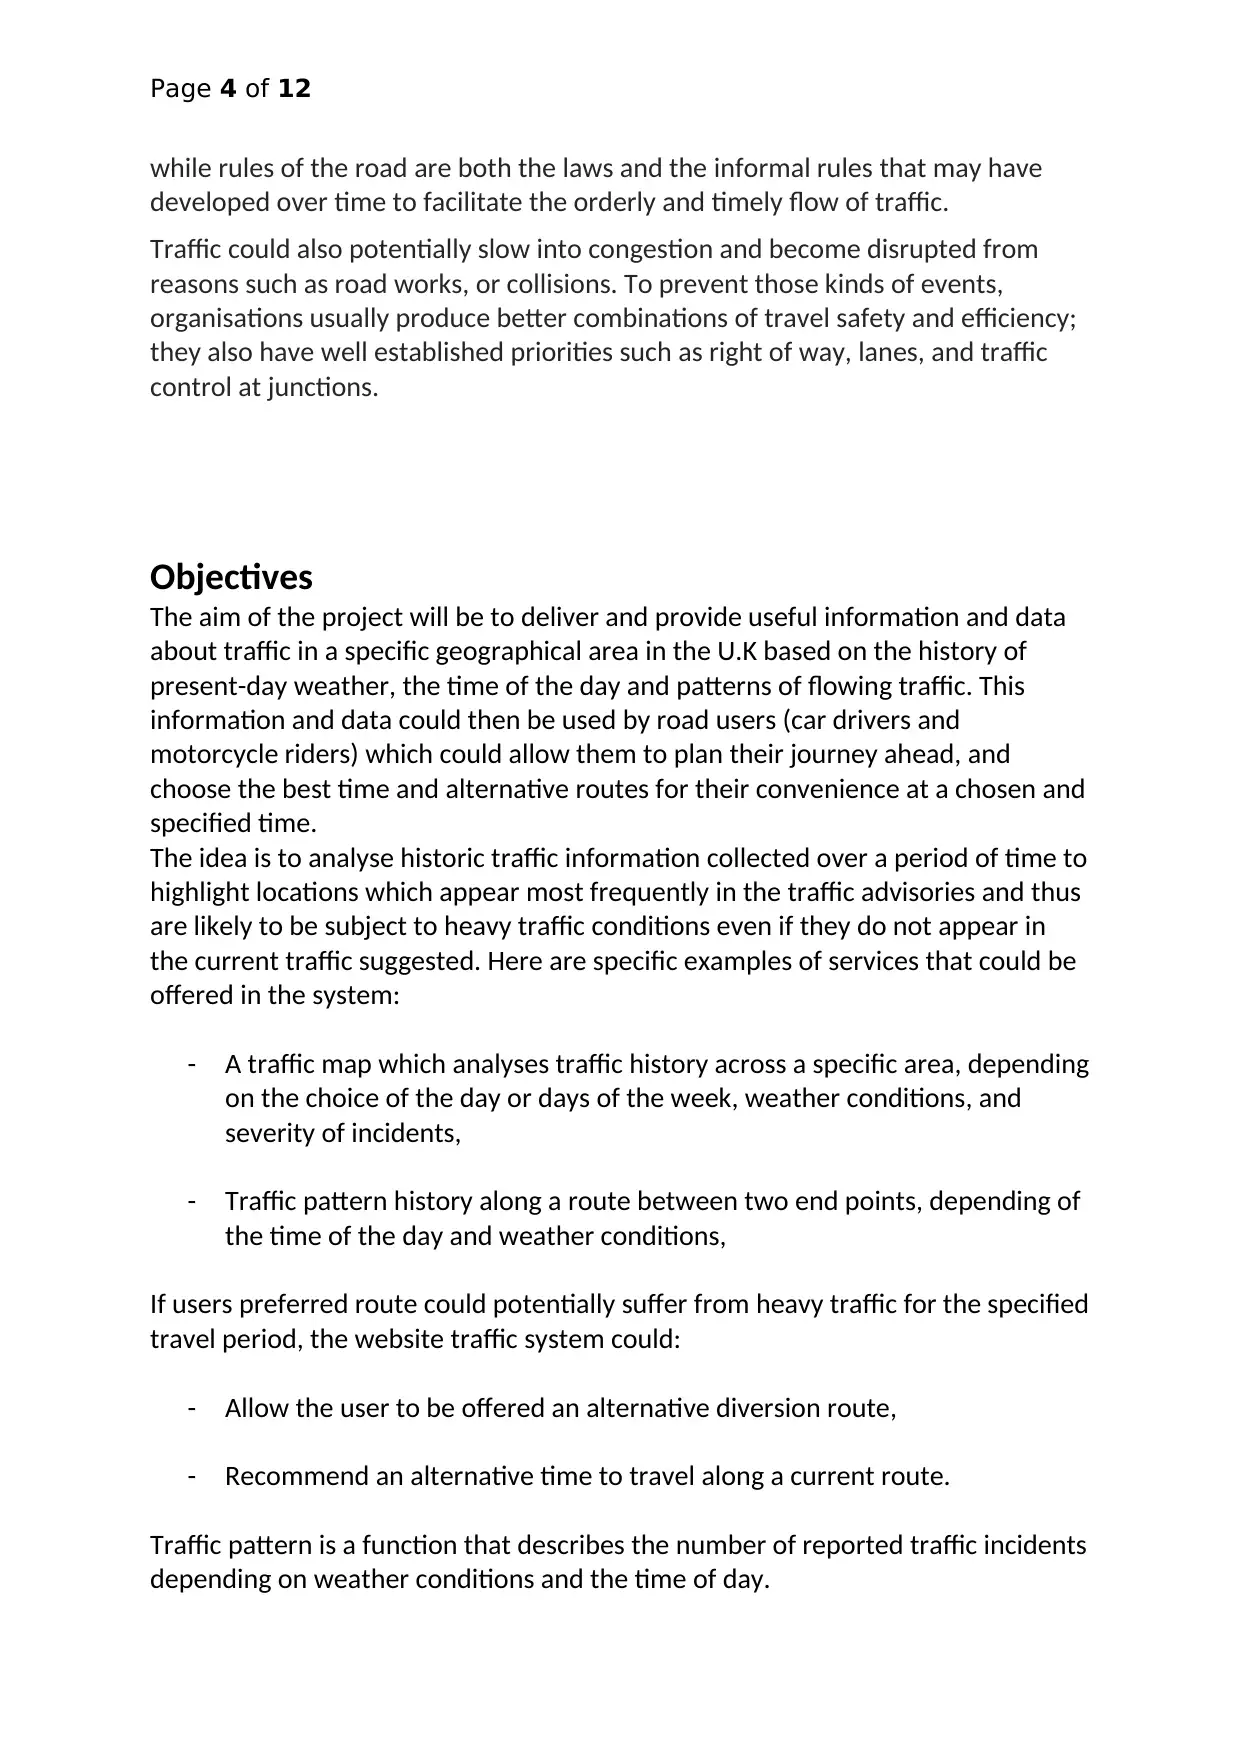
Depending on the input parameters selected by the user for example if they
would like to know the severity of an event or incident for a rainy week-end
across an area, then the system will extract statistic history and view it as a result
at the top of the area on a geographical map view for the user to see on the
interface. Similar to the image below:
Severity of incidents and congestion will be spread and shown on the interface
based on 10 levels with markers, for example a level 1 marker would be shown
green which means that congestion is low, while a level 10 marker (red) would
the highest level of congestion in a chosen area selected by the user. Users would
be able to choose the 10 level markers any of them and hide or show them, they
can also check or uncheck the boxes below each level marker shown next or
below the map (screenshot above).
Data collection Weather records
By postal code
Input postal
code, query web
server
Page 6 of 12
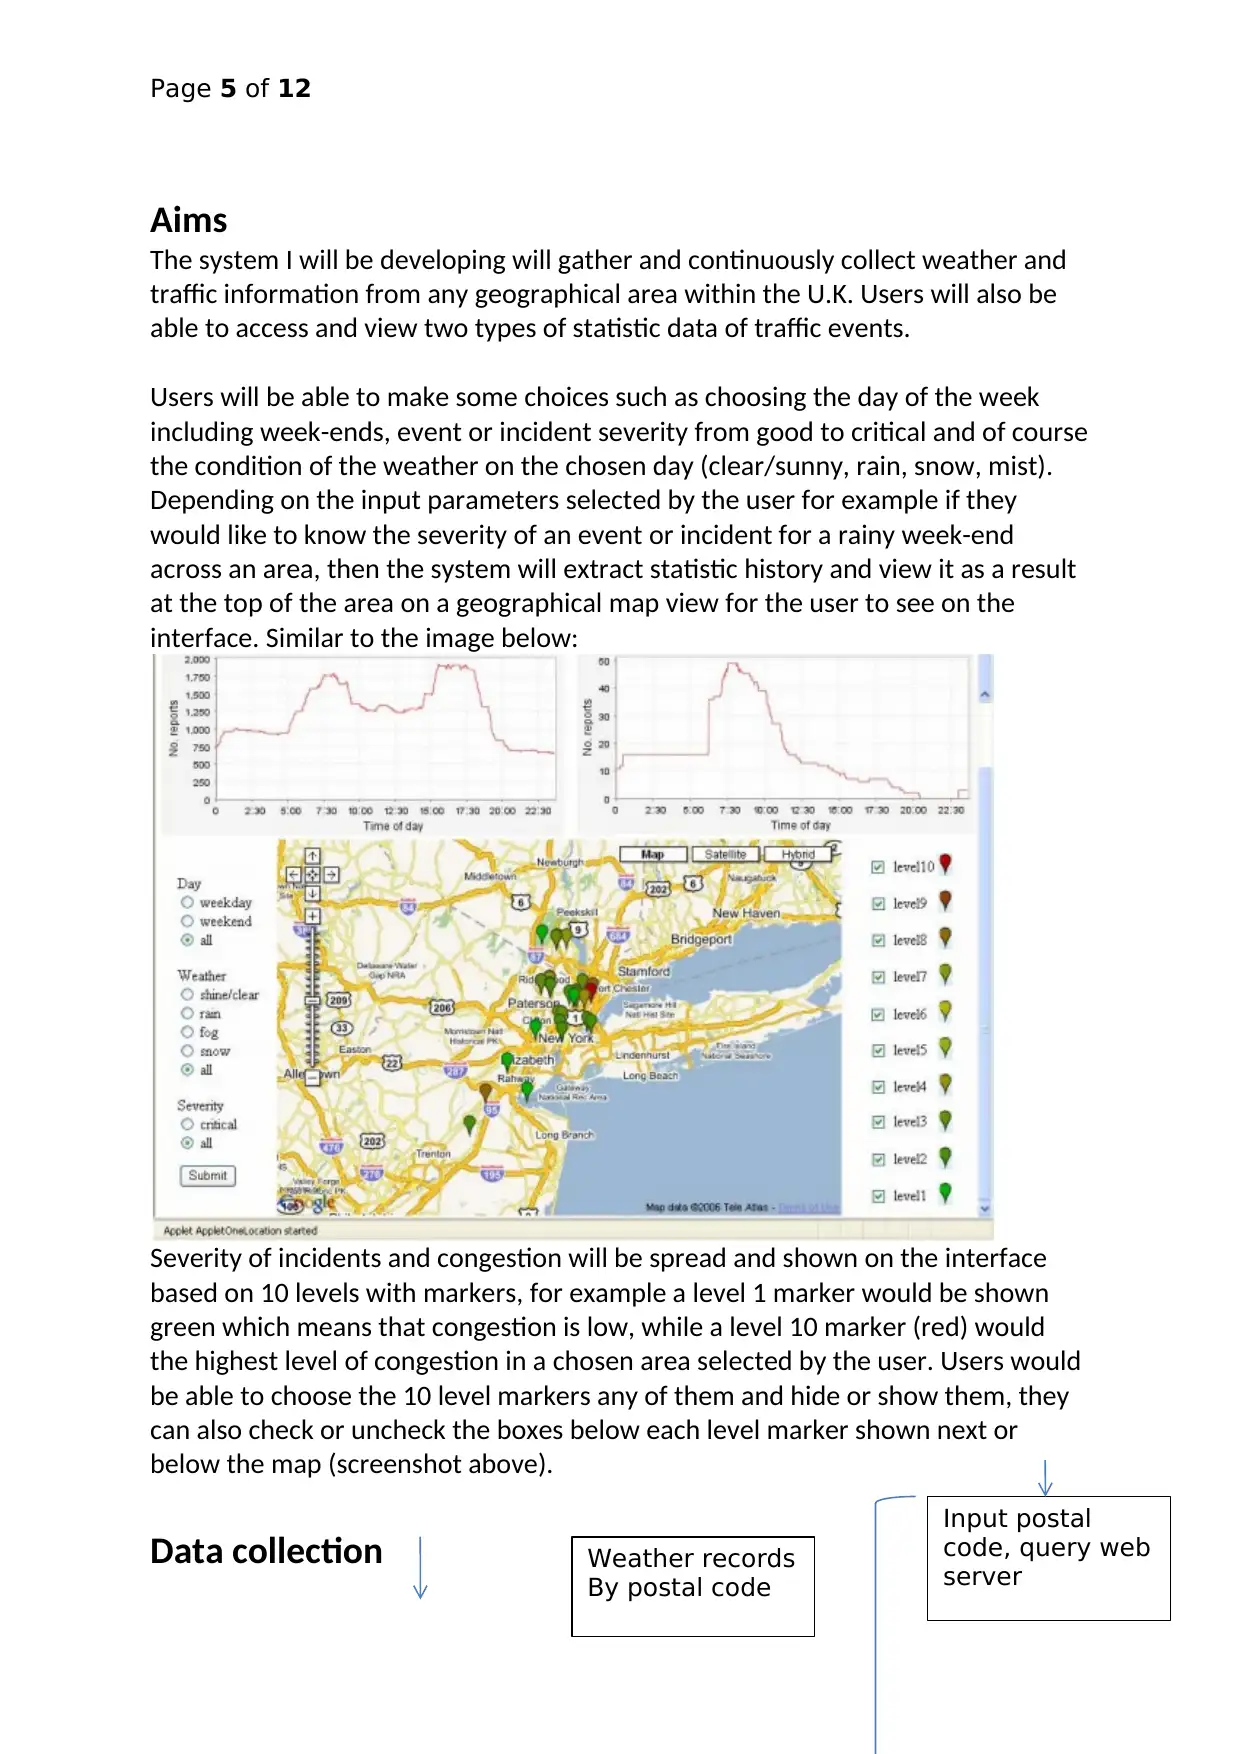
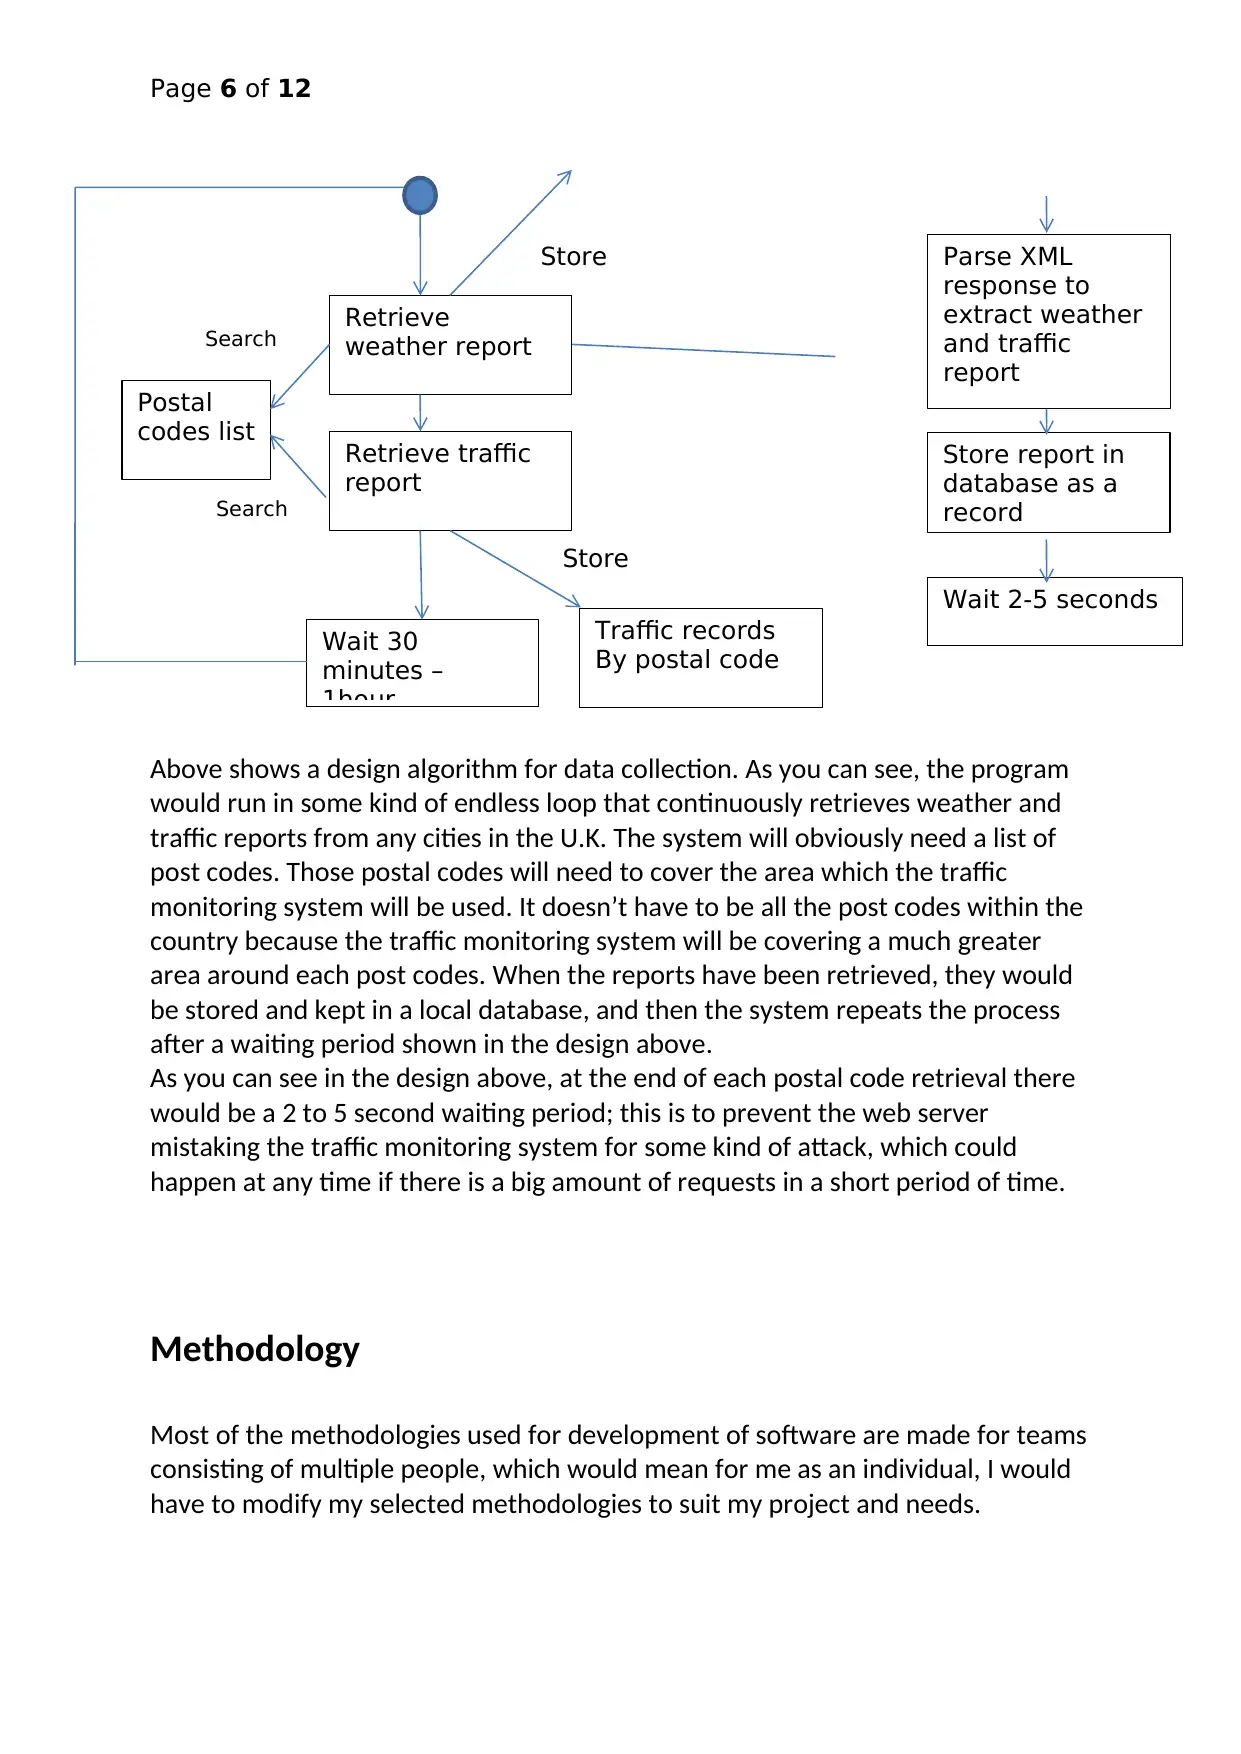
Above shows a design algorithm for data collection. As you can see, the program
would run in some kind of endless loop that continuously retrieves weather and
traffic reports from any cities in the U.K. The system will obviously need a list of
post codes. Those postal codes will need to cover the area which the traffic
monitoring system will be used. It doesn’t have to be all the post codes within the
country because the traffic monitoring system will be covering a much greater
area around each post codes. When the reports have been retrieved, they would
be stored and kept in a local database, and then the system repeats the process
after a waiting period shown in the design above.
As you can see in the design above, at the end of each postal code retrieval there
would be a 2 to 5 second waiting period; this is to prevent the web server
mistaking the traffic monitoring system for some kind of attack, which could
happen at any time if there is a big amount of requests in a short period of time.
Methodology
Most of the methodologies used for development of software are made for teams
consisting of multiple people, which would mean for me as an individual, I would
have to modify my selected methodologies to suit my project and needs.
Postal
codes list Retrieve traffic
report
Retrieve
weather report
Traffic records
By postal code
Wait 2-5 seconds
Store report in
database as a
record
Parse XML
response to
extract weather
and traffic
report
Search
Search
Store
Store
Wait 30
minutes –
1hour
Page 7 of 12
As I will be doing and performing this project solo (on my own), I will be
incorporating many approaches from agile methodologies. The reason why I will
be using agile approaches is because it would be particularly useful for my web
based mobile app development, it would also provide my users with some sort of
continued feedback loop, and they would not be left until the end of my project.
An agile development for my project would also mean that my users would
provide me with feedback every step of the way to ensure that my project
becomes a success.
Those attributes I mentioned above would lead to my web based app to become
user friendly, easy to use, flexible and anticipatory of changing user demands.
Mobile users of apps nowadays are less tolerant of errors and crashes in mobile
apps than they are in the non-mobile application world. The first few times an app
starts to crash, users would just delete the app and move on. In app stores such
as Google play that have hundreds and thousands of other alternative apps just
have plenty of alternative choices of apps for users [6]. Agile development, with
its multiple cycles of testing and quality assurance, will enable me to develop and
build my app in more quality and reliability through repeated testing.
The first methodology I will be implementing for my project will be Scrum which is
a structure from agile of course, which would break up the development of my
web based app into smaller pieces instead of a formal project plan.
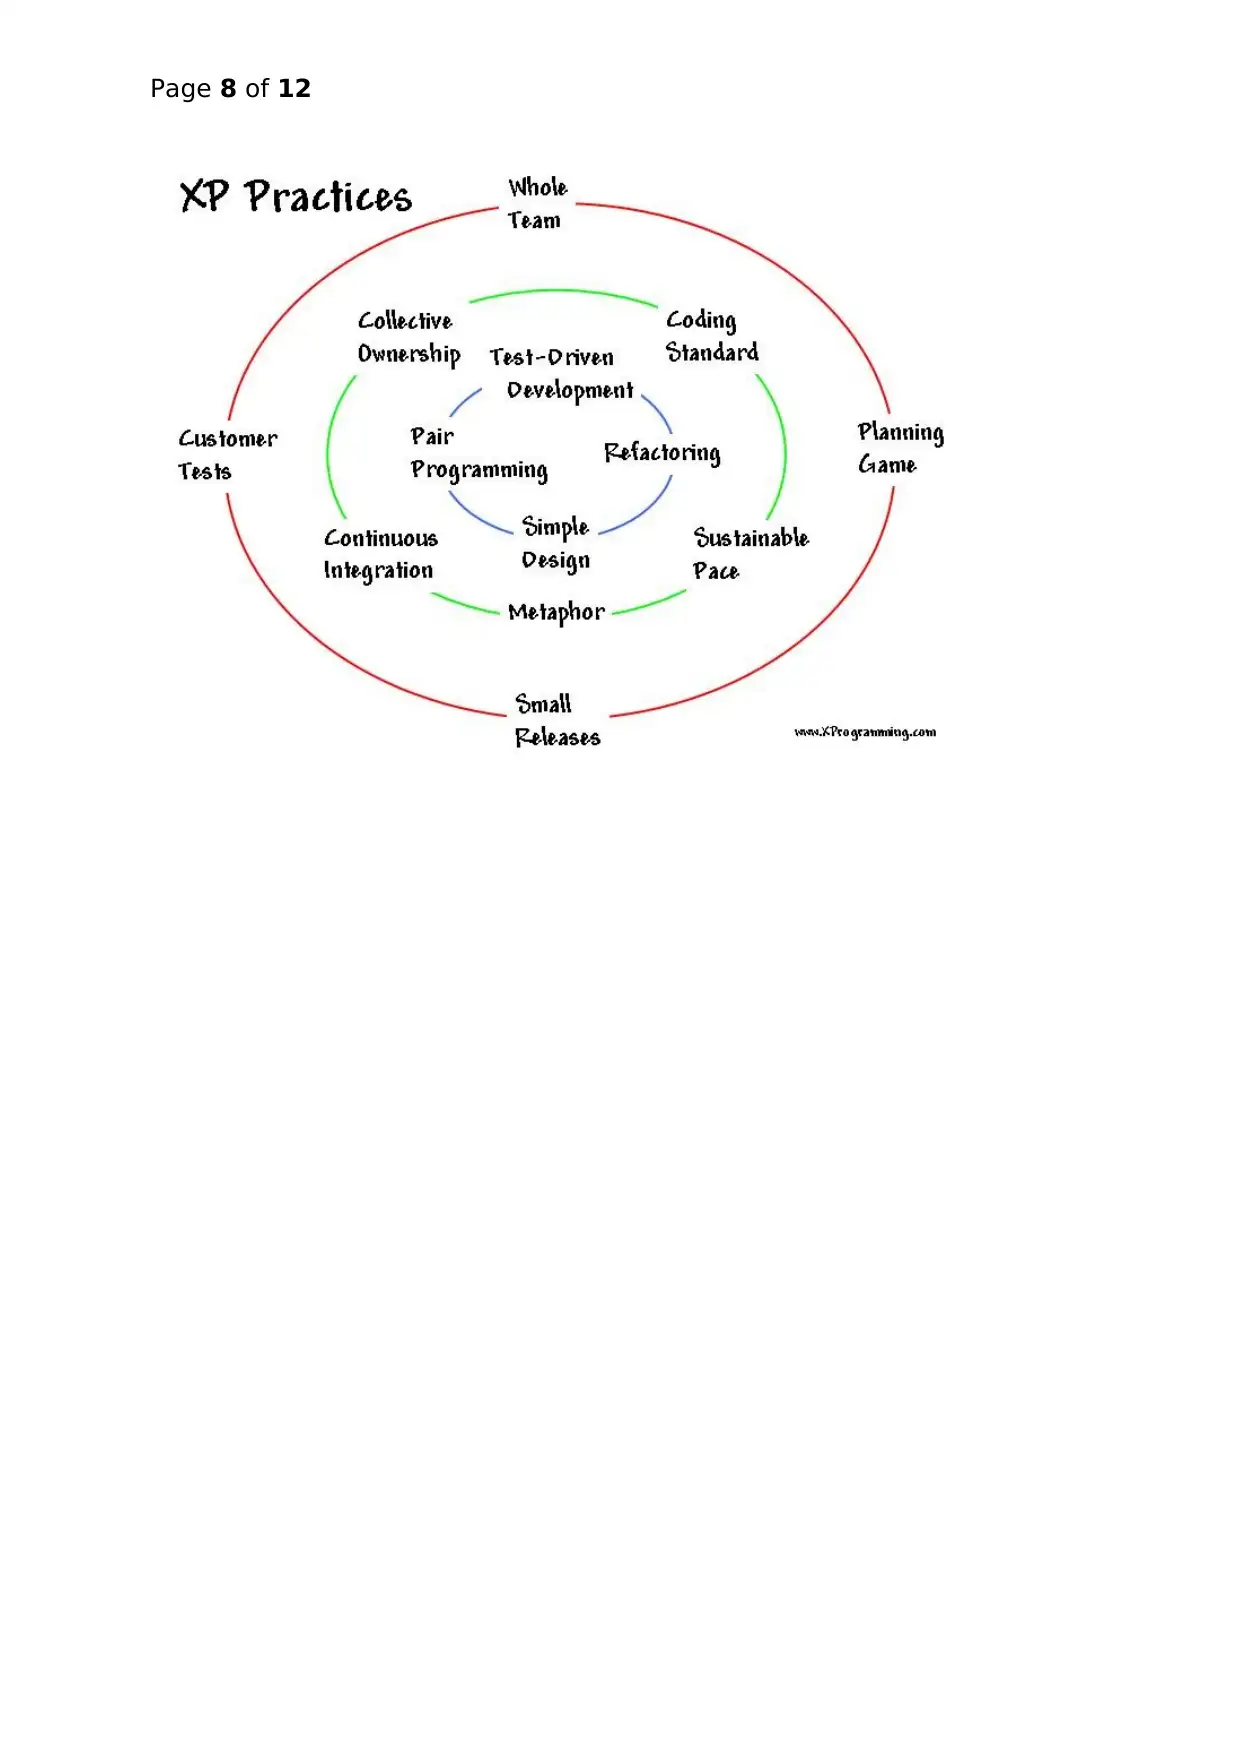
The second methodology from agile I’m going to be using would be extreme
programming, this methodology will allow me to improve the system’s quality
and its responsiveness as well as changing my future users requirements from
user stories and story cards. This methodology will be particularly useful because
it is based on values, simplicity, feedback and communication.
Secure Best Marks with AI Grader
Need help grading? Try our AI Grader for instant feedback on your assignments.
Page 8 of 12
Page 9 of 12
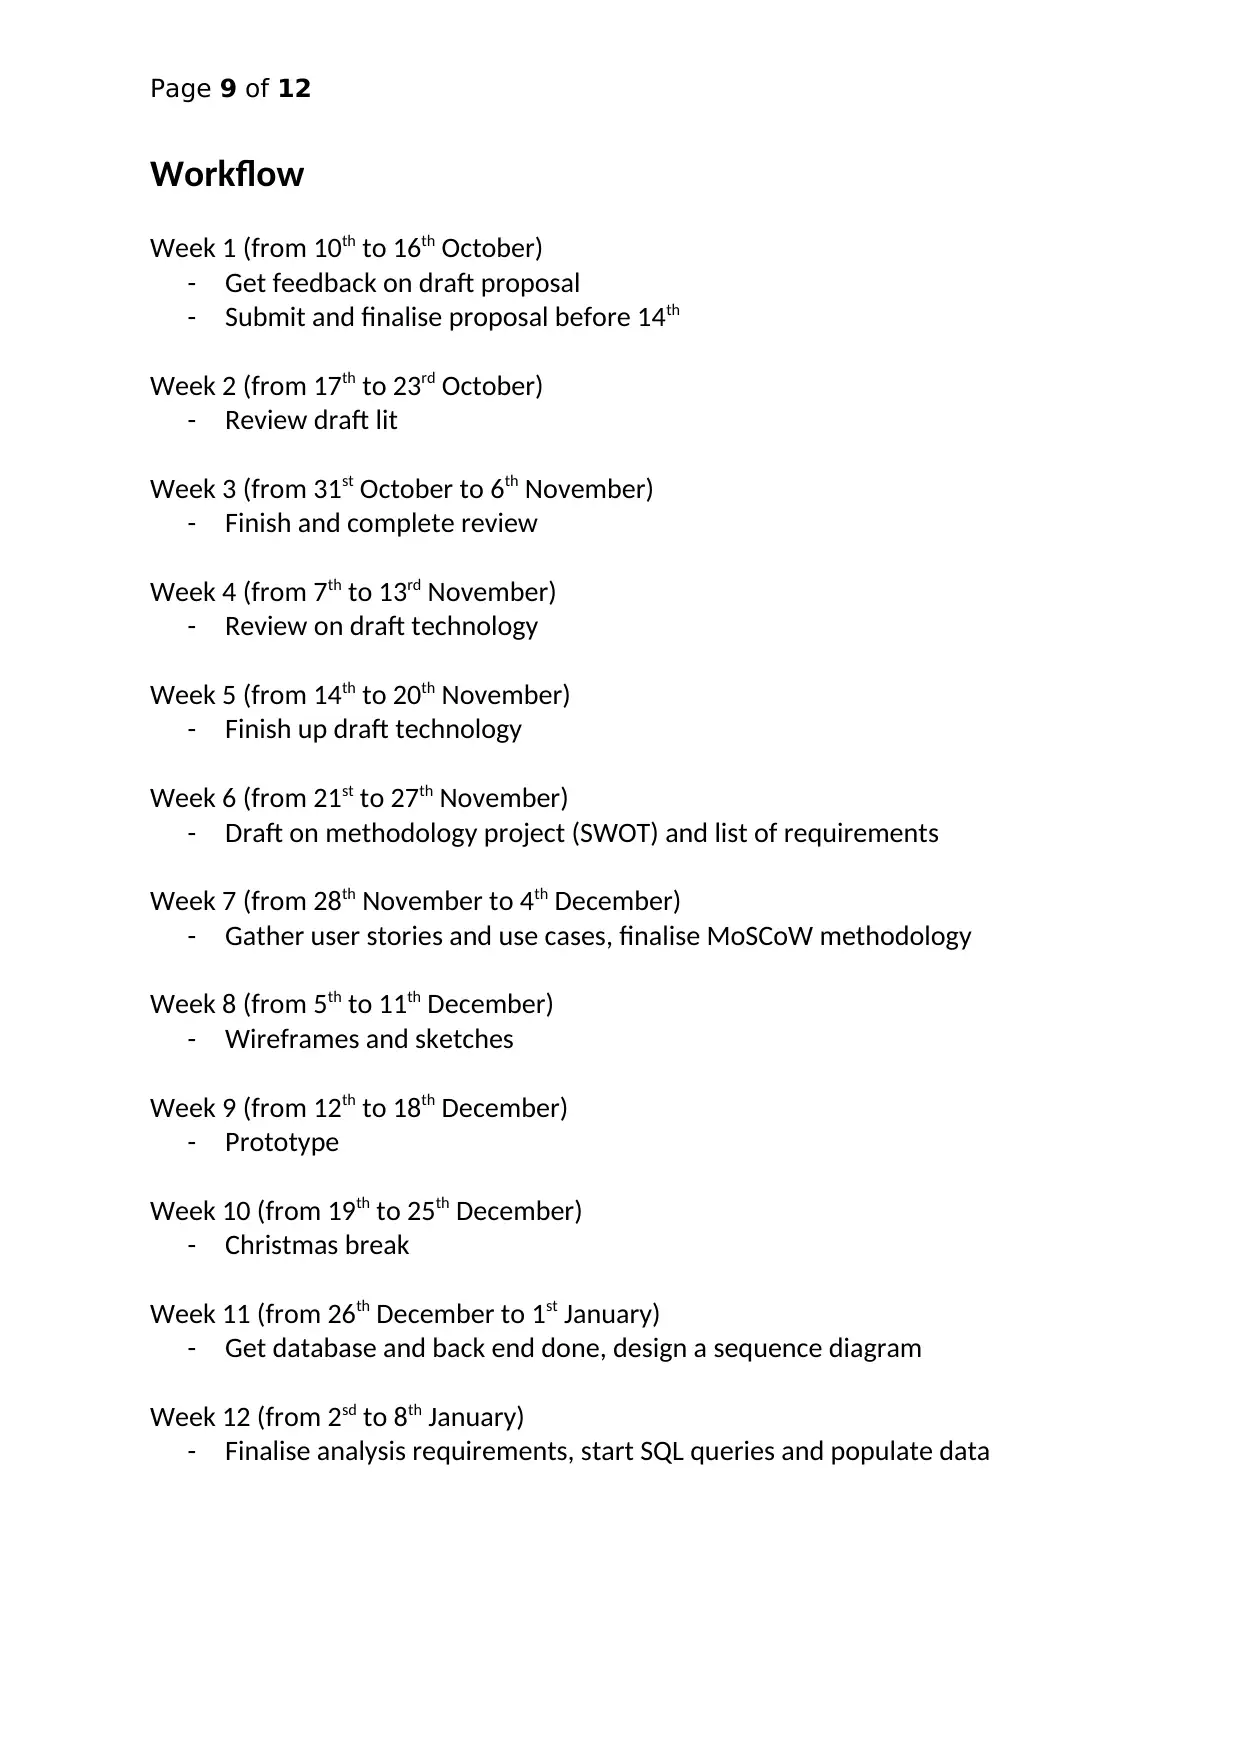
Workflow
Week 1 (from 10th to 16th October)
- Get feedback on draft proposal
- Submit and finalise proposal before 14th
Week 2 (from 17th to 23rd October)
- Review draft lit
Week 3 (from 31st October to 6th November)
- Finish and complete review
Week 4 (from 7th to 13rd November)
- Review on draft technology
Week 5 (from 14th to 20th November)
- Finish up draft technology
Week 6 (from 21st to 27th November)
- Draft on methodology project (SWOT) and list of requirements
Week 7 (from 28th November to 4th December)
- Gather user stories and use cases, finalise MoSCoW methodology
Week 8 (from 5th to 11th December)
- Wireframes and sketches
Week 9 (from 12th to 18th December)
- Prototype
Week 10 (from 19th to 25th December)
- Christmas break
Week 11 (from 26th December to 1st January)
- Get database and back end done, design a sequence diagram
Week 12 (from 2sd to 8th January)
- Finalise analysis requirements, start SQL queries and populate data
Page 10 of 12
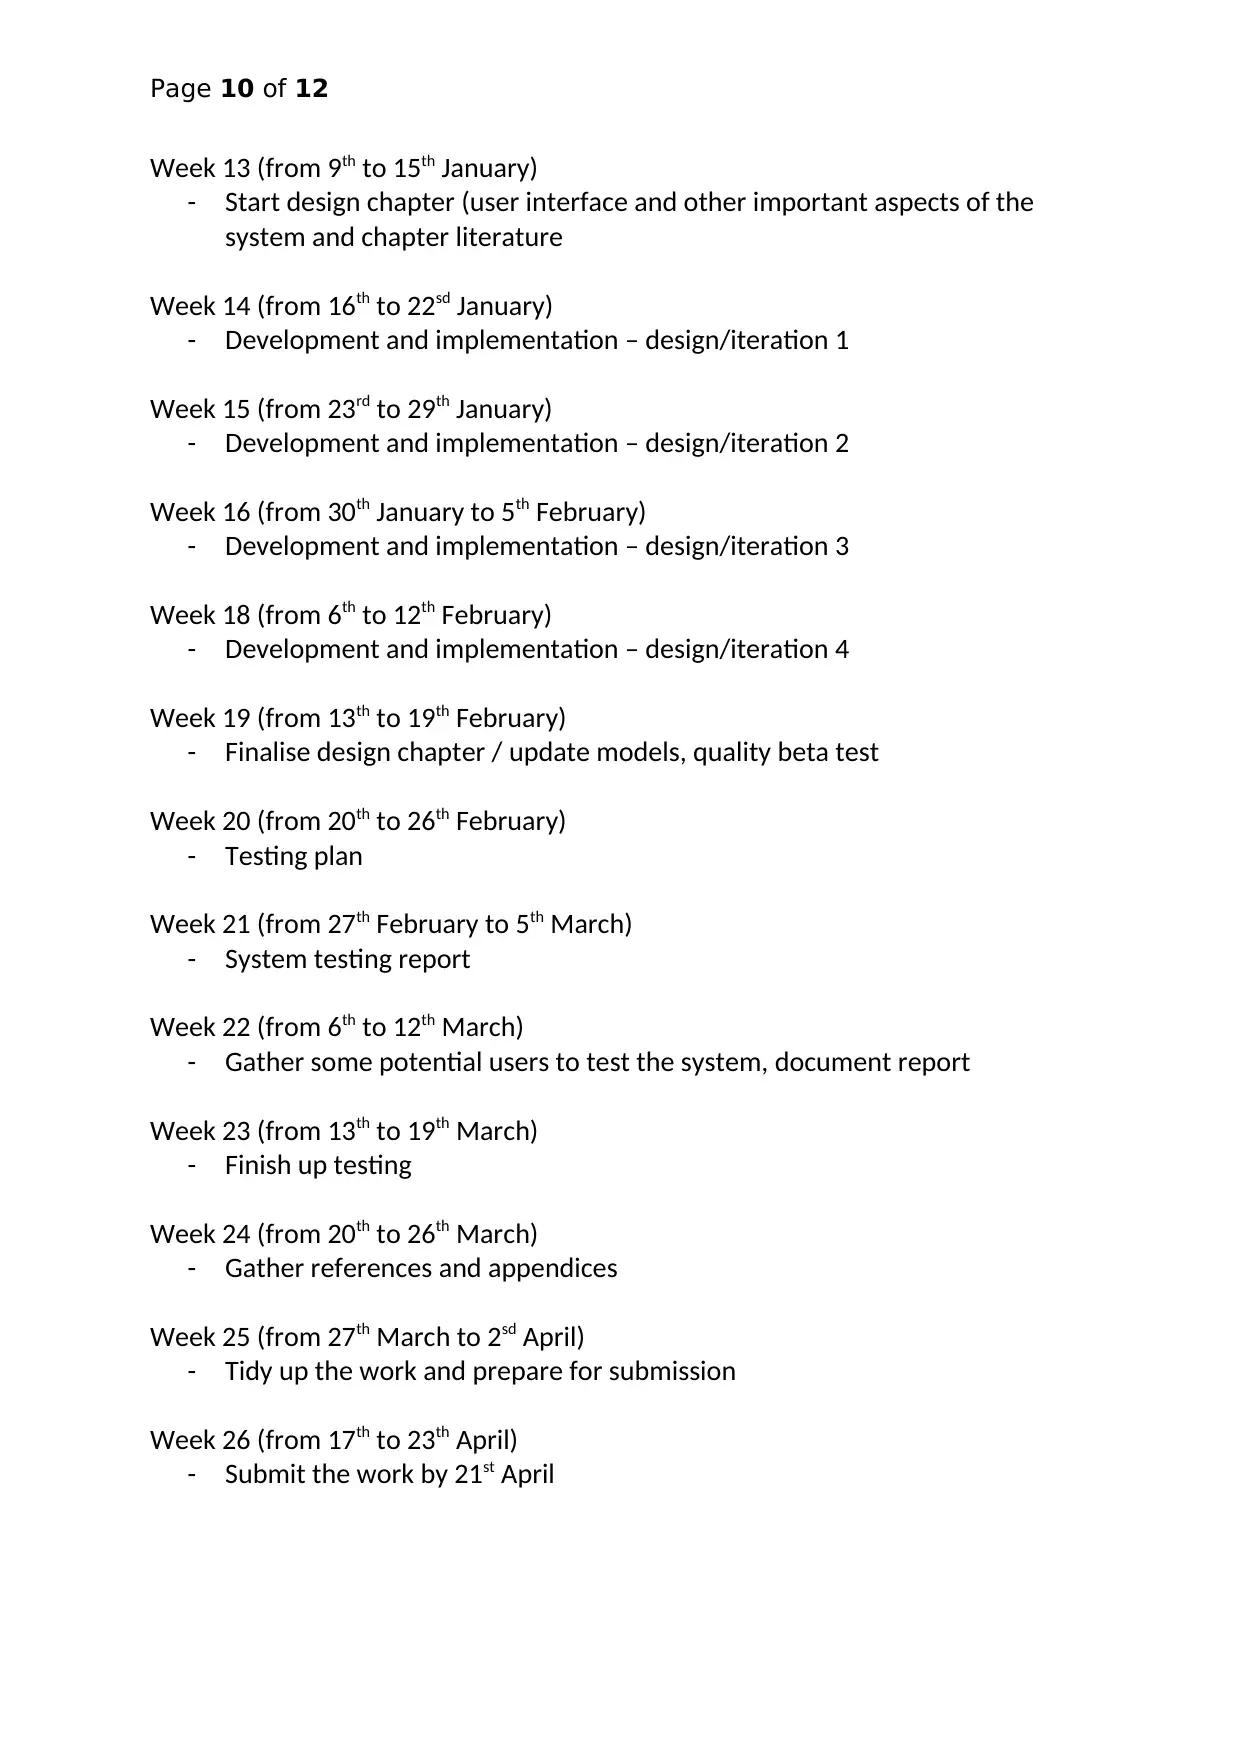
Week 13 (from 9th to 15th January)
- Start design chapter (user interface and other important aspects of the
system and chapter literature
Week 14 (from 16th to 22sd January)
- Development and implementation – design/iteration 1
Week 15 (from 23rd to 29th January)
- Development and implementation – design/iteration 2
Week 16 (from 30th January to 5th February)
- Development and implementation – design/iteration 3
Week 18 (from 6th to 12th February)
- Development and implementation – design/iteration 4
Week 19 (from 13th to 19th February)
- Finalise design chapter / update models, quality beta test
Week 20 (from 20th to 26th February)
- Testing plan
Week 21 (from 27th February to 5th March)
- System testing report
Week 22 (from 6th to 12th March)
- Gather some potential users to test the system, document report
Week 23 (from 13th to 19th March)
- Finish up testing
Week 24 (from 20th to 26th March)
- Gather references and appendices
Week 25 (from 27th March to 2sd April)
- Tidy up the work and prepare for submission
Week 26 (from 17th to 23th April)
- Submit the work by 21st April
Paraphrase This Document
Need a fresh take? Get an instant paraphrase of this document with our AI Paraphraser
Page 11 of 12
Technology and resources
The technologies that are going to be used in this project will be PHP, HTML5, CSS
and Google maps API.
To meet the requirements while developing this system may not be the simplest
task in this project, there are some questions I have been asking myself, who is
going to take full advantages of this system and also in what way? Maybe it could
be useful for someone who just moved in some new region or city within the U.K,
to look and see how traffic has changed from the past couple years? I am not
really sure if the system is going to benefit local commuters or people who are
not familiar in an area such as tourists, or if someone is going to move in a new
home to consider driving long distances during rushing hours along some routes
that have been known to be busy from the past couple of months? That is why as
a developer, I am going to need to interview various potential users to give their
suggestions and their own opinion about features I am going to include. Focus
groups and brainstorming would be good options to consider as well and
demonstrating a prototype of the system to my potential users would be a good
idea to get important feedback from them and improve to system even further
later as the project goes and moves on.
Ethical issues
In this project no human subjects are going to be used to gather data as no ethical
issues are to be anticipated because no personal or sensitive data that identifies
individuals will be kept or stored in the system in any way. Instead when users will
be using the system, they will be assigned an anonymous ID rather than their
name and I will also be referencing them that way as well.
Page 12 of 12
Bibliography
[1] ‘Traffic congestion’, Wikipedia, the free encyclopaedia. [Online]. Available:
https://en.wikipedia.org/wiki/Traffic_congestion.
[Accessed: 09/10/2016].
[2] ‘Traffic’, Wikipedia, the free encyclopaedia. [Online]. Available:
https://en.wikipedia.org/wiki/Traffic. [Accessed: 09/10/2016].
[3]’Reducing congestion’, Transport Works. [Online]. Available:
http://www.transportworks.org/about-transport-works/reducing-congestion.
[Accessed: 10/10/2016].
[4] ‘What is Agile development for Mobile Apps?’, source bits. [Online].
Available: http://sourcebits.com/app-development-design-blog/what-is-agile-
development-for-mobile-apps/. [Accessed: 11/10/2016].
[5]’Agile methodology for mobile application development’, LinkedIn. [Online].
Available: https://www.linkedin.com/pulse/agile-methodology-mobile-
application-development-salman-shahid. [Accessed: 11/10/2016].
[6]’Mobile development: Why using an Agile methodology makes sense’,
SearchSoftwareQuality. [Online]. Available:
http://searchsoftwarequality.techtarget.com/tip/Mobile-development-Why-
using-an-Agile-methodology-makes-sense. [Accessed: 11/10/2016].
1 out of 12
Related Documents
Your All-in-One AI-Powered Toolkit for Academic Success.
+13062052269
info@desklib.com
Available 24*7 on WhatsApp / Email
Unlock your academic potential
© 2024 | Zucol Services PVT LTD | All rights reserved.