Assignment 3: Statistical Analysis and Research in Healthcare Studies
VerifiedAdded on 2023/06/03
|8
|1167
|481
Homework Assignment
AI Summary
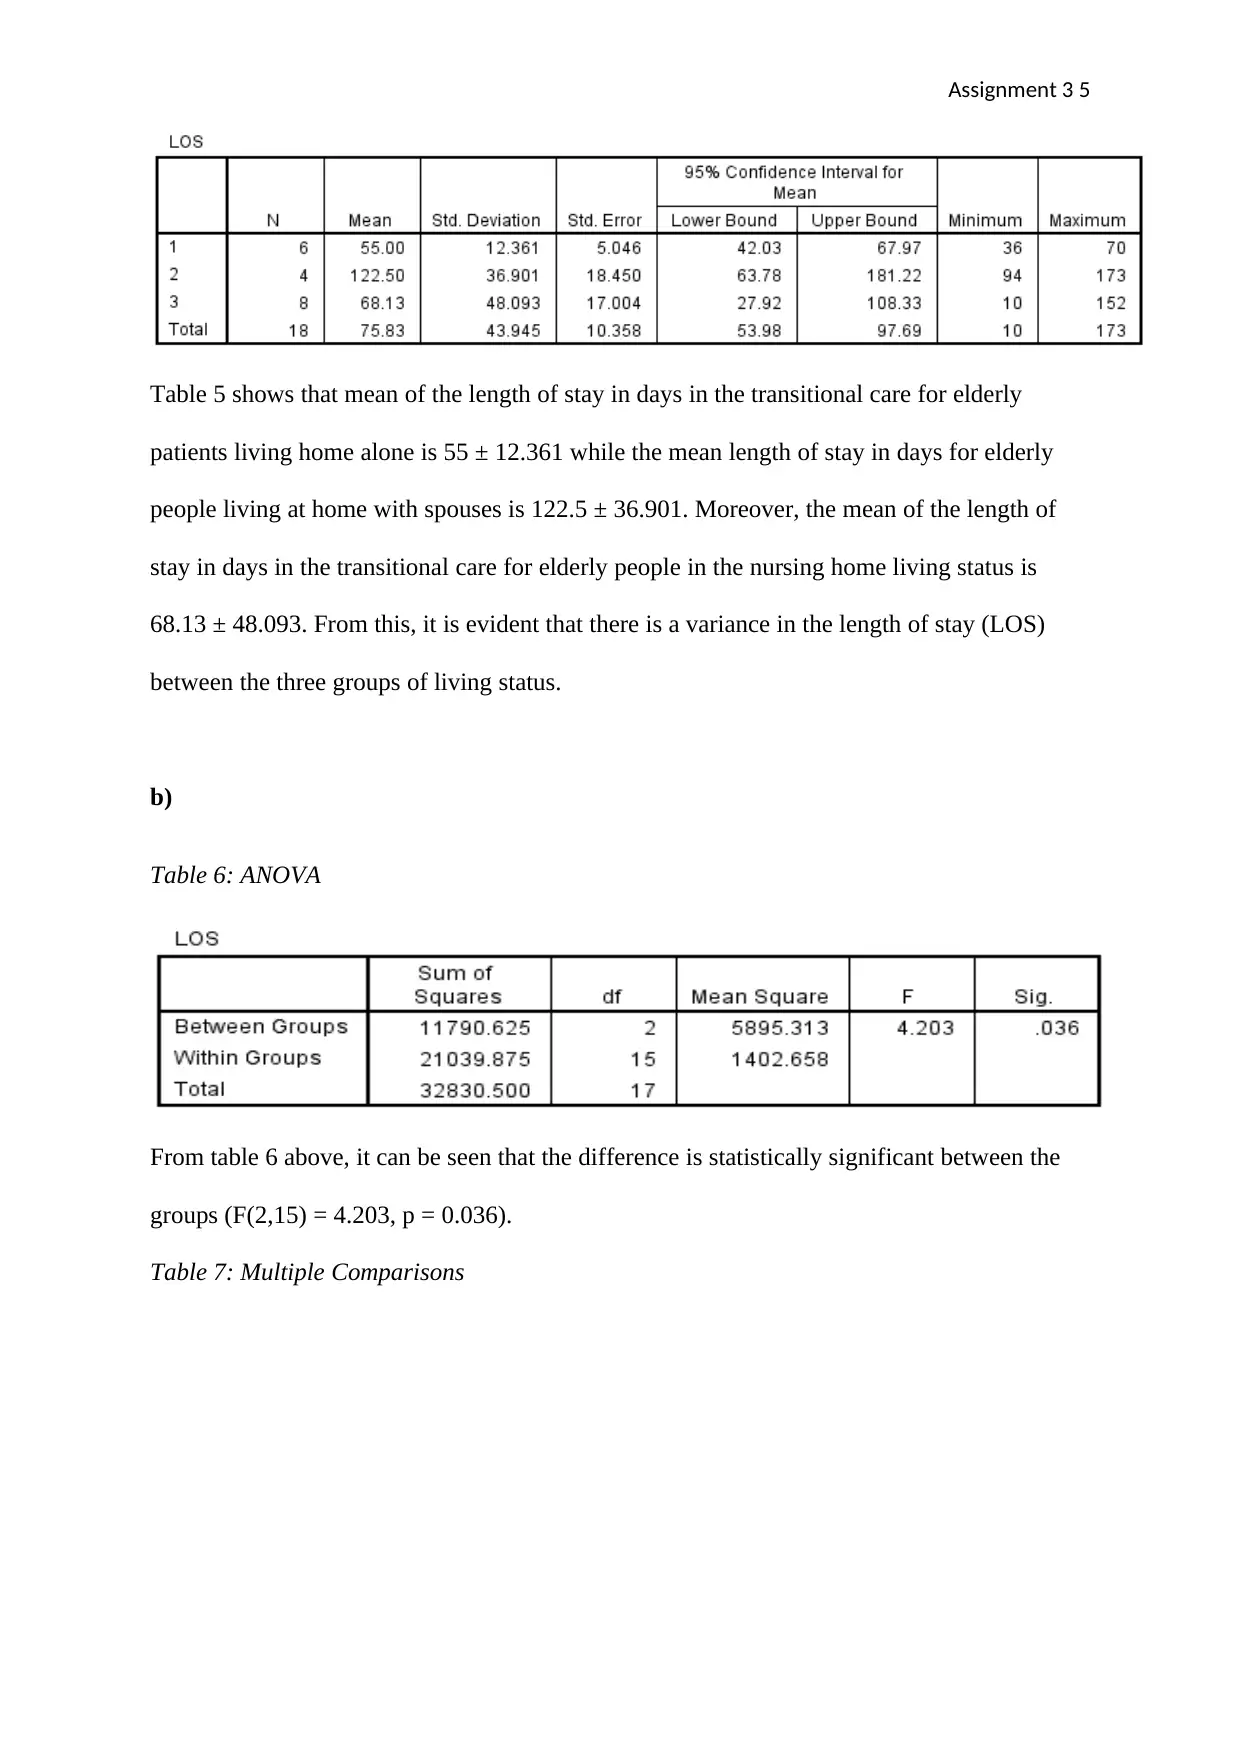
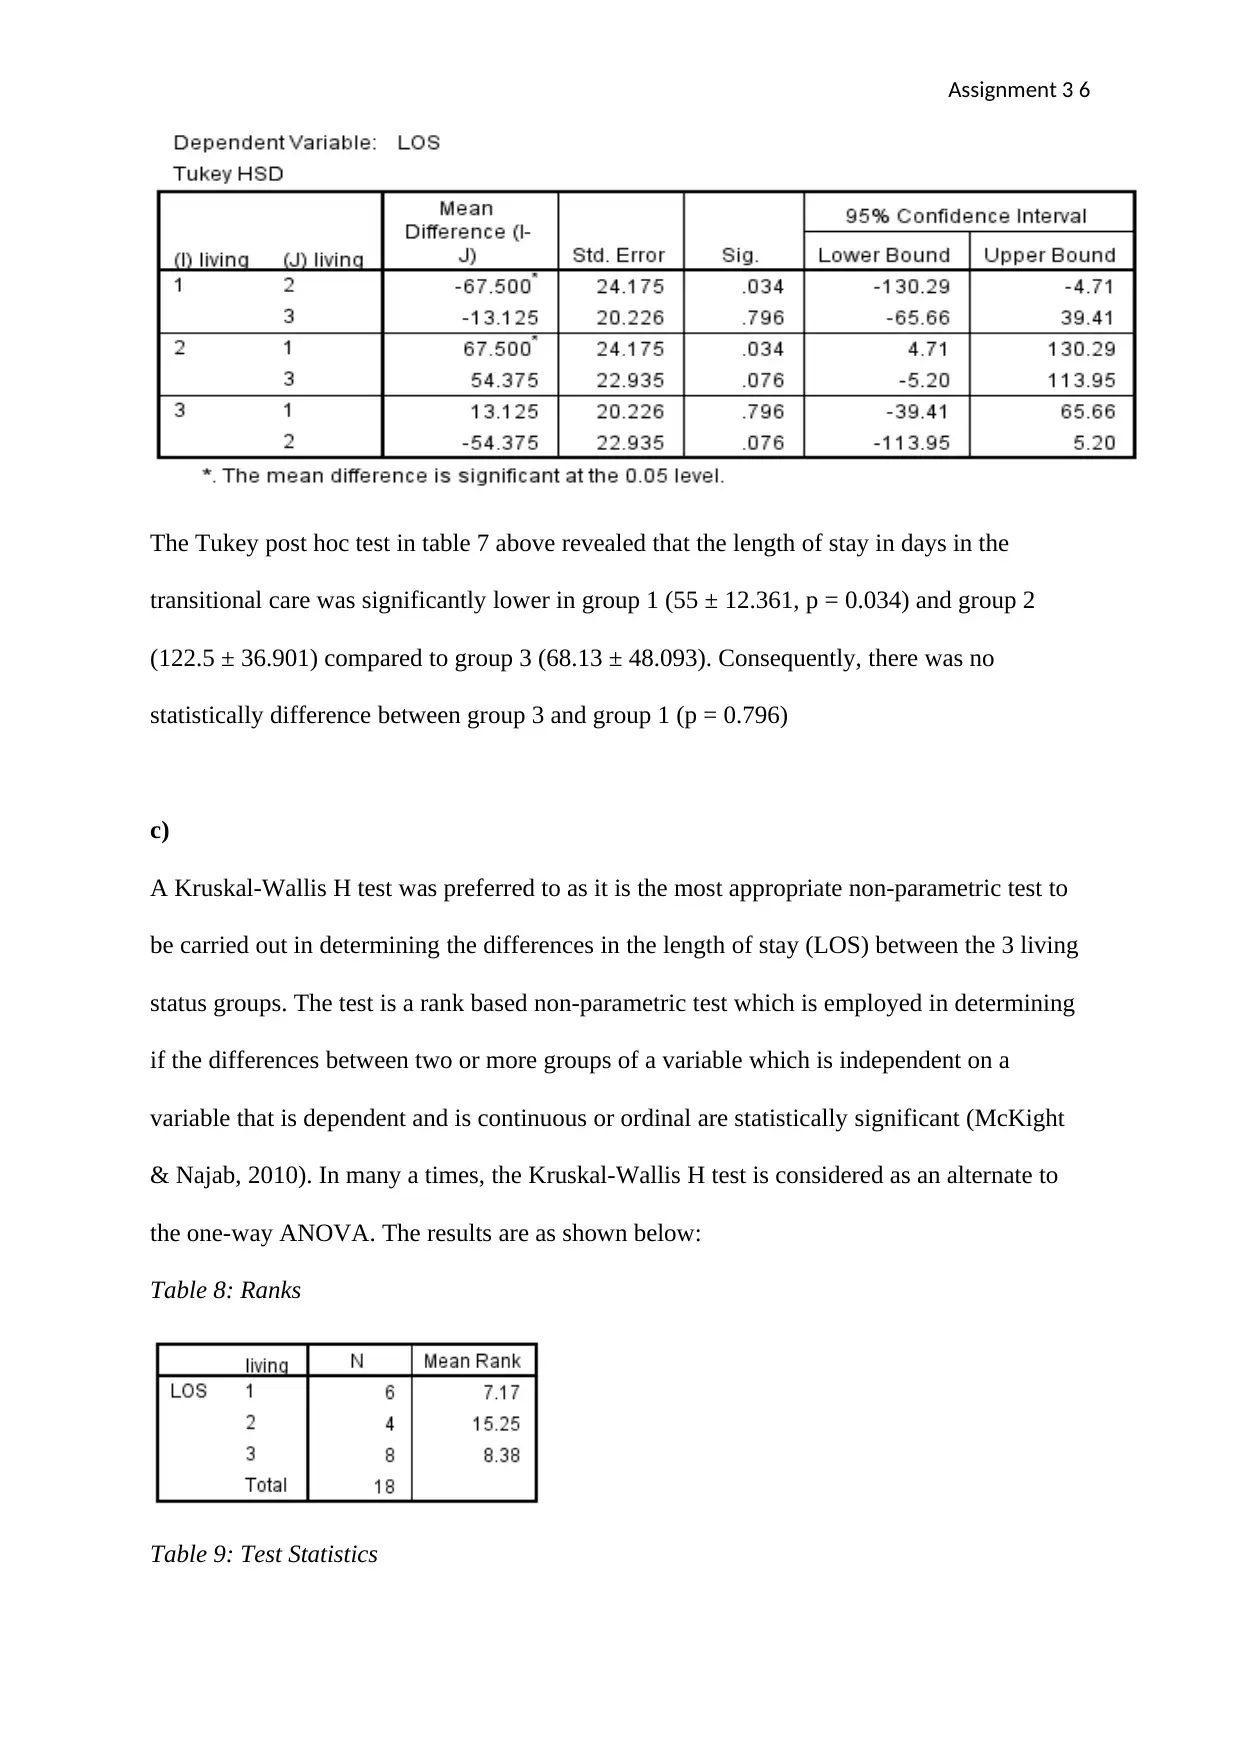
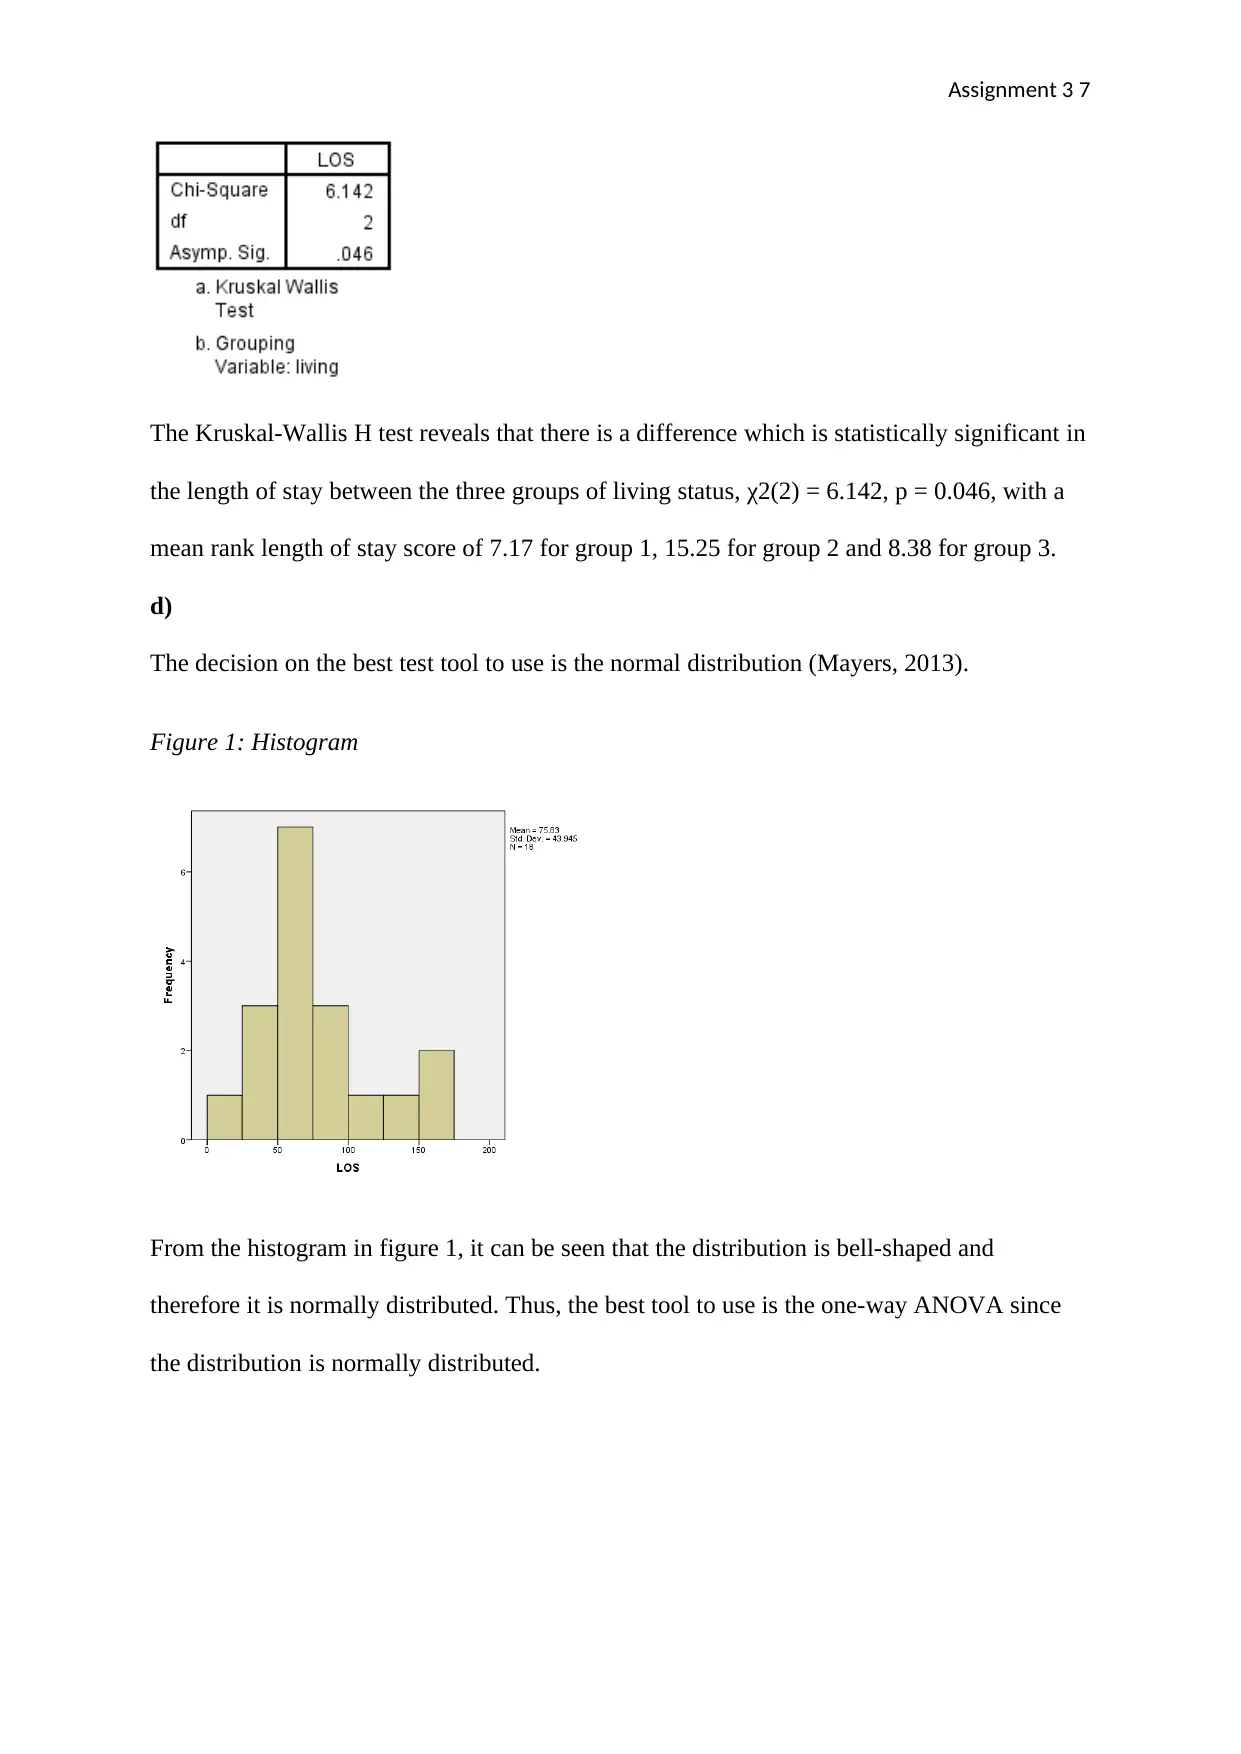
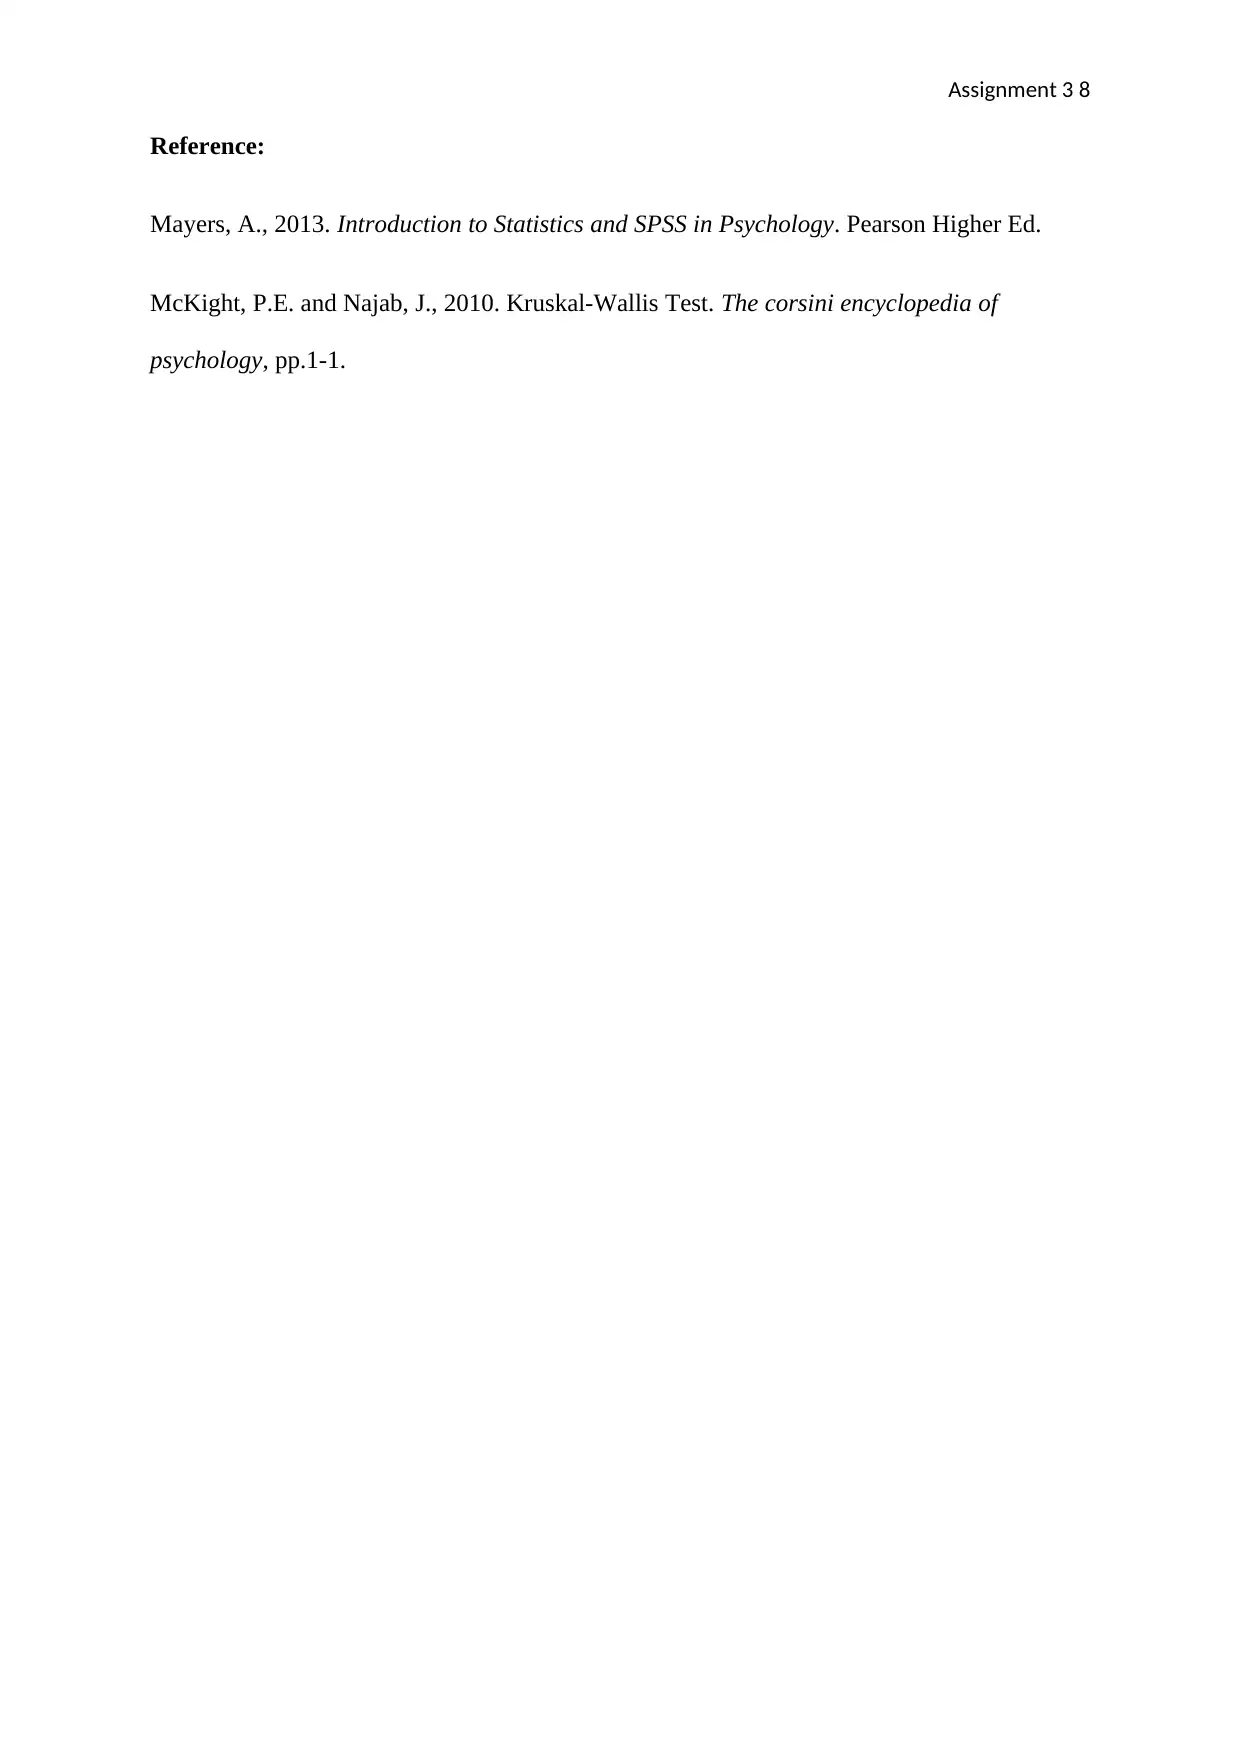
This assignment presents a statistical analysis of healthcare data, focusing on three key areas: the impact of Reiki treatment on pain management, the relationship between cholesterol levels and heart attacks, and the factors affecting the length of stay for elderly patients in transitional care. The analysis includes descriptive statistics, paired samples t-tests, independent samples t-tests, ANOVA, and Kruskal-Wallis H tests. The assignment explores the statistical significance of findings, comparing means and variances across different groups and treatments. The student also addresses the appropriateness of different statistical tests based on the data distribution. Results are presented in tables and figures, providing a comprehensive overview of the data analysis and conclusions drawn from the research.

Running Header: Assignment 3 1
Assignment 3
Student’s names:
Student’s ID:
Institution
Assignment 3
Student’s names:
Student’s ID:
Institution
Paraphrase This Document
Need a fresh take? Get an instant paraphrase of this document with our AI Paraphraser

Assignment 3 2
Question 1
a)
Table 1: Statistics of Paired Samples
Table 2: Test of Paired Samples
b)
From table 1, it is evident that the VAS score is higher after the Reiki treatment compared to
the VAS score before the Reiki treatment. The deduction is based on the fact that the mean of
the VAS before score is 4.00 while the mean of the VAS after score is 2.05. Thus, the Reiki
treatment decreases the VAS. On the other hand, it can be seen that the Likert scale before
the Reiki treatment is higher than the Likert scale after the Reiki treatment. The mean of the
Likert scale before is 2.3 while the mean of the Likert scale after is 1.13.
Consequently in table 2, it can be seen that the mean difference between the VAS before and
the VAS after treatment is positive (1.950). The mean difference can also be seen to be
statistically significant. Thus, this supports the observations made in table and it can be
concluded that the Reiki treatment has a positive impact on the VAS. Thus, Reiki treatment
reduces pain among patients. Conversely, it was seen that the mean of the Likert Scale

Assignment 3 3
decreased after the Reiki treatment. Table 2 shows that the difference in mean between Likert
before and after treatment is 1.175. The result is also statistically significant. Thus, a Reiki
treatment has a decreasing effect on the Likert Scale.
From these results, it can therefore be proved that the Reiki treatment is useful in the
management of pain an adjuvant to opioid therapy.
Question 2
a)
Table 3: Descriptive Statistics
It should be firstly noted that the number of people in the two groups differed with
cholesterol levels being recorded for 19 people who experienced a heart attack in the last 14
days while 30 people were recorded for having no experience of heart attack. From this, it
can be seen that the mean of the cholesterol levels of people who had a heart attack in the last
14 days was 221.21 mg/dL of blood while the cholesterol level of the people in the control
group was 193.13 mg/dL of blood. Evidently, it can be deduced that the people who
experienced a heart attack in the last 14 days had a high cholesterol level while comparing it
with the control group. Thus, there is a cholesterol level difference between the control group
and the experimental group.
⊘ This is a preview!⊘
Do you want full access?
Subscribe today to unlock all pages.

Trusted by 1+ million students worldwide

Assignment 3 4
b)
Table 4: Student t-test
From table 4 above, we can see that the F-value of 14.660 is statistically significant (p <
0.05). Thus the analysis will be based on the second row where equal variances are not
assumed. From this, it was observed that the people in the control group (193.13 ± 22.3
mg/dL of blood) had a lower cholesterol level compared to people who experienced a heart
attack in the last 14 days (221.21 ± 43.152 mg/dL of blood), t(24.175) = 2.623, p = 0.015.
c)
A student t-test is used in comparing the means between two groups (day) which are
unrelated on the same dependent variable which is continuous (cholesterol level). Thus, a
student t-test is the most appropriate in determining if there are any differences in the levels
of cholesterol between the experimental group and the control group.
Question 3
a)
Table 5: Descriptive Statistics
Paraphrase This Document
Need a fresh take? Get an instant paraphrase of this document with our AI Paraphraser

Assignment 3 5
Table 5 shows that mean of the length of stay in days in the transitional care for elderly
patients living home alone is 55 ± 12.361 while the mean length of stay in days for elderly
people living at home with spouses is 122.5 ± 36.901. Moreover, the mean of the length of
stay in days in the transitional care for elderly people in the nursing home living status is
68.13 ± 48.093. From this, it is evident that there is a variance in the length of stay (LOS)
between the three groups of living status.
b)
Table 6: ANOVA
From table 6 above, it can be seen that the difference is statistically significant between the
groups (F(2,15) = 4.203, p = 0.036).
Table 7: Multiple Comparisons

Assignment 3 6
The Tukey post hoc test in table 7 above revealed that the length of stay in days in the
transitional care was significantly lower in group 1 (55 ± 12.361, p = 0.034) and group 2
(122.5 ± 36.901) compared to group 3 (68.13 ± 48.093). Consequently, there was no
statistically difference between group 3 and group 1 (p = 0.796)
c)
A Kruskal-Wallis H test was preferred to as it is the most appropriate non-parametric test to
be carried out in determining the differences in the length of stay (LOS) between the 3 living
status groups. The test is a rank based non-parametric test which is employed in determining
if the differences between two or more groups of a variable which is independent on a
variable that is dependent and is continuous or ordinal are statistically significant (McKight
& Najab, 2010). In many a times, the Kruskal-Wallis H test is considered as an alternate to
the one-way ANOVA. The results are as shown below:
Table 8: Ranks
Table 9: Test Statistics
⊘ This is a preview!⊘
Do you want full access?
Subscribe today to unlock all pages.

Trusted by 1+ million students worldwide

Assignment 3 7
The Kruskal-Wallis H test reveals that there is a difference which is statistically significant in
the length of stay between the three groups of living status, χ2(2) = 6.142, p = 0.046, with a
mean rank length of stay score of 7.17 for group 1, 15.25 for group 2 and 8.38 for group 3.
d)
The decision on the best test tool to use is the normal distribution (Mayers, 2013).
Figure 1: Histogram
From the histogram in figure 1, it can be seen that the distribution is bell-shaped and
therefore it is normally distributed. Thus, the best tool to use is the one-way ANOVA since
the distribution is normally distributed.
Paraphrase This Document
Need a fresh take? Get an instant paraphrase of this document with our AI Paraphraser

Assignment 3 8
Reference:
Mayers, A., 2013. Introduction to Statistics and SPSS in Psychology. Pearson Higher Ed.
McKight, P.E. and Najab, J., 2010. Kruskal‐Wallis Test. The corsini encyclopedia of
psychology, pp.1-1.
Reference:
Mayers, A., 2013. Introduction to Statistics and SPSS in Psychology. Pearson Higher Ed.
McKight, P.E. and Najab, J., 2010. Kruskal‐Wallis Test. The corsini encyclopedia of
psychology, pp.1-1.
1 out of 8
Your All-in-One AI-Powered Toolkit for Academic Success.
+13062052269
info@desklib.com
Available 24*7 on WhatsApp / Email
Unlock your academic potential
Copyright © 2020–2026 A2Z Services. All Rights Reserved. Developed and managed by ZUCOL.


