Health Technology Assessment: Evaluating Cervical Screening
VerifiedAdded on 2023/06/04
|21
|4533
|270
Report
AI Summary
This health technology assessment report evaluates the cost-effectiveness of a new cervical screening test compared to the current screening test. The assessment includes an executive summary with objectives, methods (sensitivity, specificity, decision tree), data analysis, and results (QALY, ICER value). The report details the accuracy of test alternatives, including calculations of sensitivity and specificity, and compares current and old tests. A decision tree model is constructed to assess the tests' efficiency, considering outcomes from chance events, utility, and resource costs. The report also estimates test benefits using QALY, identifies cost elements, and performs a cost-utility analysis. Sensitivity analysis is conducted to address uncertainties and justify cost-effectiveness. The report concludes with recommendations for early cancer detection and the inclusion of the pap smear test to increase accuracy.

Health Technology
HEALTH TECHNOLOGY ASSESSMENT
1
HEALTH TECHNOLOGY ASSESSMENT
1
Paraphrase This Document
Need a fresh take? Get an instant paraphrase of this document with our AI Paraphraser

Health Technology
Executive Summary
Objectives: This study aimed to identify the pre-cancerous stage of affected women to prevent
the occurrence of cervical cancer. The key objectives of this study are-
● To identify the precancerous growth of cervical cells among the suspected women of 30
years of age
● To compare the significance rate and possibility of any errors within the pap smear test
● To calculate sensitivity and specificity test of both current and new pap smear test
● To analyze discounted cost and benefits of pap smear test with the help of calculating the
average QALY
Methods: Sensitivity and specificity test is carried out to analyze the prevalence of cervical
cancerous growth of the patients. Cost-effectiveness of screening women has been evaluated
with the help of a decision tree. Benefit and costs of true positive, true negative, false positive
and false negative are carried out while estimating QALY. Finally, unit costs have been carried
out for both the new and current tests.
Data: The total costs for the current test and new tests have been carried out in this case. GP
appointment and further requirement of any tests are also provided in this case. Furthermore,
delayed treatment is also required in case any patient is not provided with proper tests.
Results: The sensitivity and specificity test results are 57.65% and 99.65% respectively. Apart
from this QALY test has also been carried out to estimate cost-effectiveness. The cost-utility test
has also been carried out in this case, and the ICER value is found out to be $907.
Key areas of uncertainty: Key areas of uncertainty about the areas of the placebo group who do
not undergo screening. This uncertainty provides scope for future study.
Discussion and conclusion: Based on the information studied above, early detection of cancer
helps to reduce the cost of treatment and chance of successful outcomes. The decision tree that
has provided the ICER has shown innovative approaches to increase patient flow and prevent
overcrowding. Reduced rates of false negatives and high benefits have been seen in case of the
new test. It is thereby considered that inclusion of advanced resources helps to diagnose the
disease in a more effective manner.
2

Health Technology
Recommendation: Two main recommendations are suggested in this case. Early detection of
cancer is critical for successful case outcomes. Another recommendation is that the inclusion of
the pap smear test can increase the accuracy of test results.
Key Words: Pap smear test, sensitivity, specificity, decision tree, utility score
3
⊘ This is a preview!⊘
Do you want full access?
Subscribe today to unlock all pages.
Trusted by 1+ million students worldwide

Health Technology
Table of Contents
Introduction......................................................................................................................................5
Part One: Accuracy of test alternatives...........................................................................................5
a) Cervical screening tests............................................................................................................5
b) Calculation of sensitivity and specificity.................................................................................6
c) Comparison between the current and old test..........................................................................6
Part 2: Decision tree.........................................................................................................................7
2.1 Identification of use...............................................................................................................7
2.2 Elements of decision tree.......................................................................................................7
2.3 Decision tree model...............................................................................................................8
2.4 Patient flow............................................................................................................................8
Part Three: Estimating test benefits.................................................................................................9
a) Calculation of average QALY for the below-mentioned individuals-.....................................9
Part Four: Cost estimation...............................................................................................................9
a) Identification of cost elements.................................................................................................9
c) Estimation of cost elements for new test...............................................................................10
Part 5: Cost-utility analysis............................................................................................................11
5A Model parameters.................................................................................................................11
5B. The decision tree with cost-effectiveness............................................................................12
5.1 Parameter allocation.............................................................................................................12
5.2 Expected value.....................................................................................................................12
5.3 ICER.....................................................................................................................................13
5.4 Refined decision tree model.................................................................................................13
5C. Justification of the decision-maker......................................................................................14
Part 6: Sensitivity Analysis............................................................................................................14
A) ICER in high-risk population................................................................................................14
B) Justification of cost-effectiveness.........................................................................................14
4
Paraphrase This Document
Need a fresh take? Get an instant paraphrase of this document with our AI Paraphraser

Health Technology
C) Change in ICER....................................................................................................................15
D) Sensitivity of the model........................................................................................................15
Recommendation...........................................................................................................................16
Conclusion.....................................................................................................................................16
Reference List................................................................................................................................17
Appendices....................................................................................................................................19
Appendix 1: Pap smear test........................................................................................................19
5
Health Technology
Introduction
Cervical screening tests aim to identify the prevalence of precancerous stages within a women's
body. Pap smear test is one of the most effective cervical screening tests that are followed by
clinicians to examine the occurrence of the cancerous stage. Cervical neoplasia could be easily
detected with the help of these screening tests thereby preventing the affected women from
developing cancer. A cohort study has been carried out, and test results will be interpreted in this
current report. Based on the clinical test results, an analysis will be carried out, and finally, a
recommendation will also be provided that will help any women to understand the occurrence of
any cervical cancer.
Part One: Accuracy of test alternatives
In a conventional Pap smear test, the clinician collects cells from the cervix of the presumed
affected patient and smears them on a microscopic slide to test them. Adherence to these cells is
carried out with the help of fixative. These slides are then sent to laboratories for evaluation. In
the test, sensitivity and specificity examination of the smeared cervical cells are carried out to
understand their characteristics.
In the first clinical study, the clinicians observed sensitivity to be 74% while specificity was
about 94%. The high sensitivity of the test denotes that this test was able to identify the total
number of patients without any disease (Rho Cervical Cancer, 2018). However, the clinician was
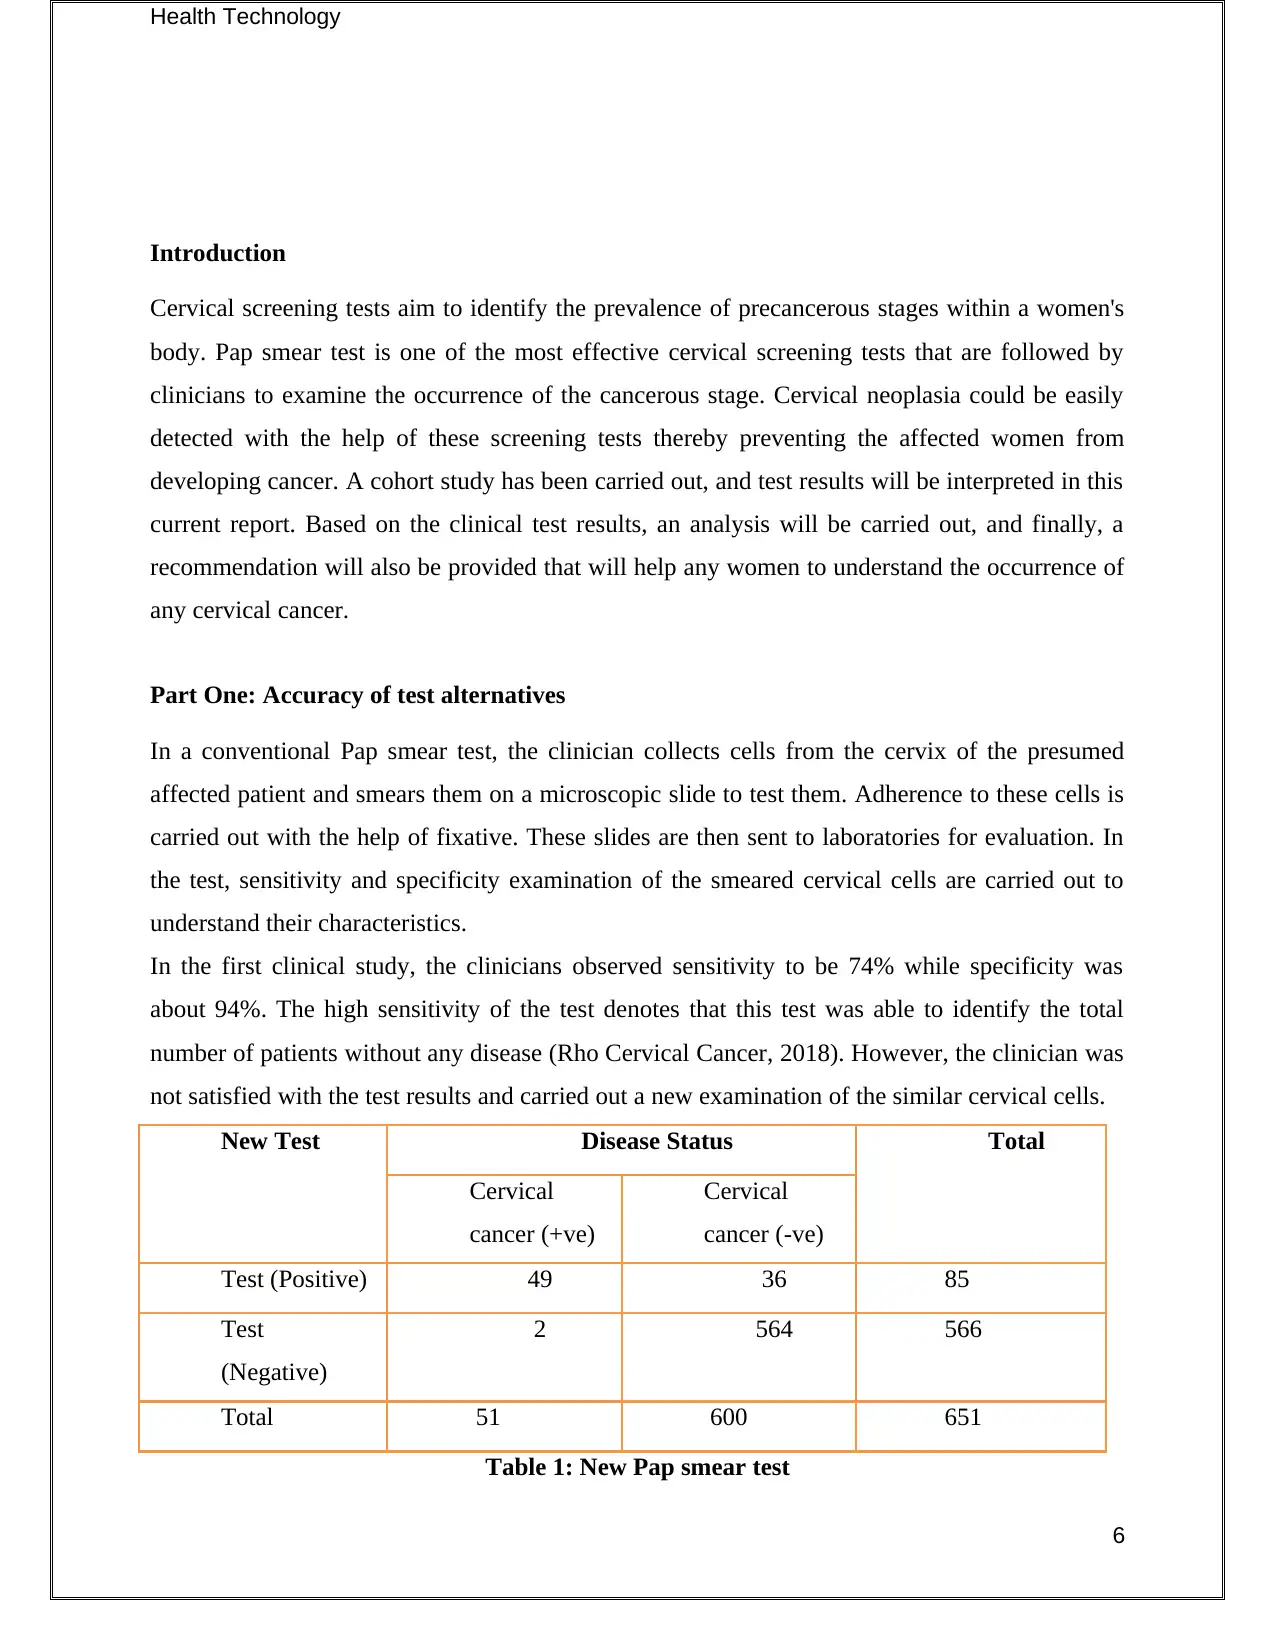
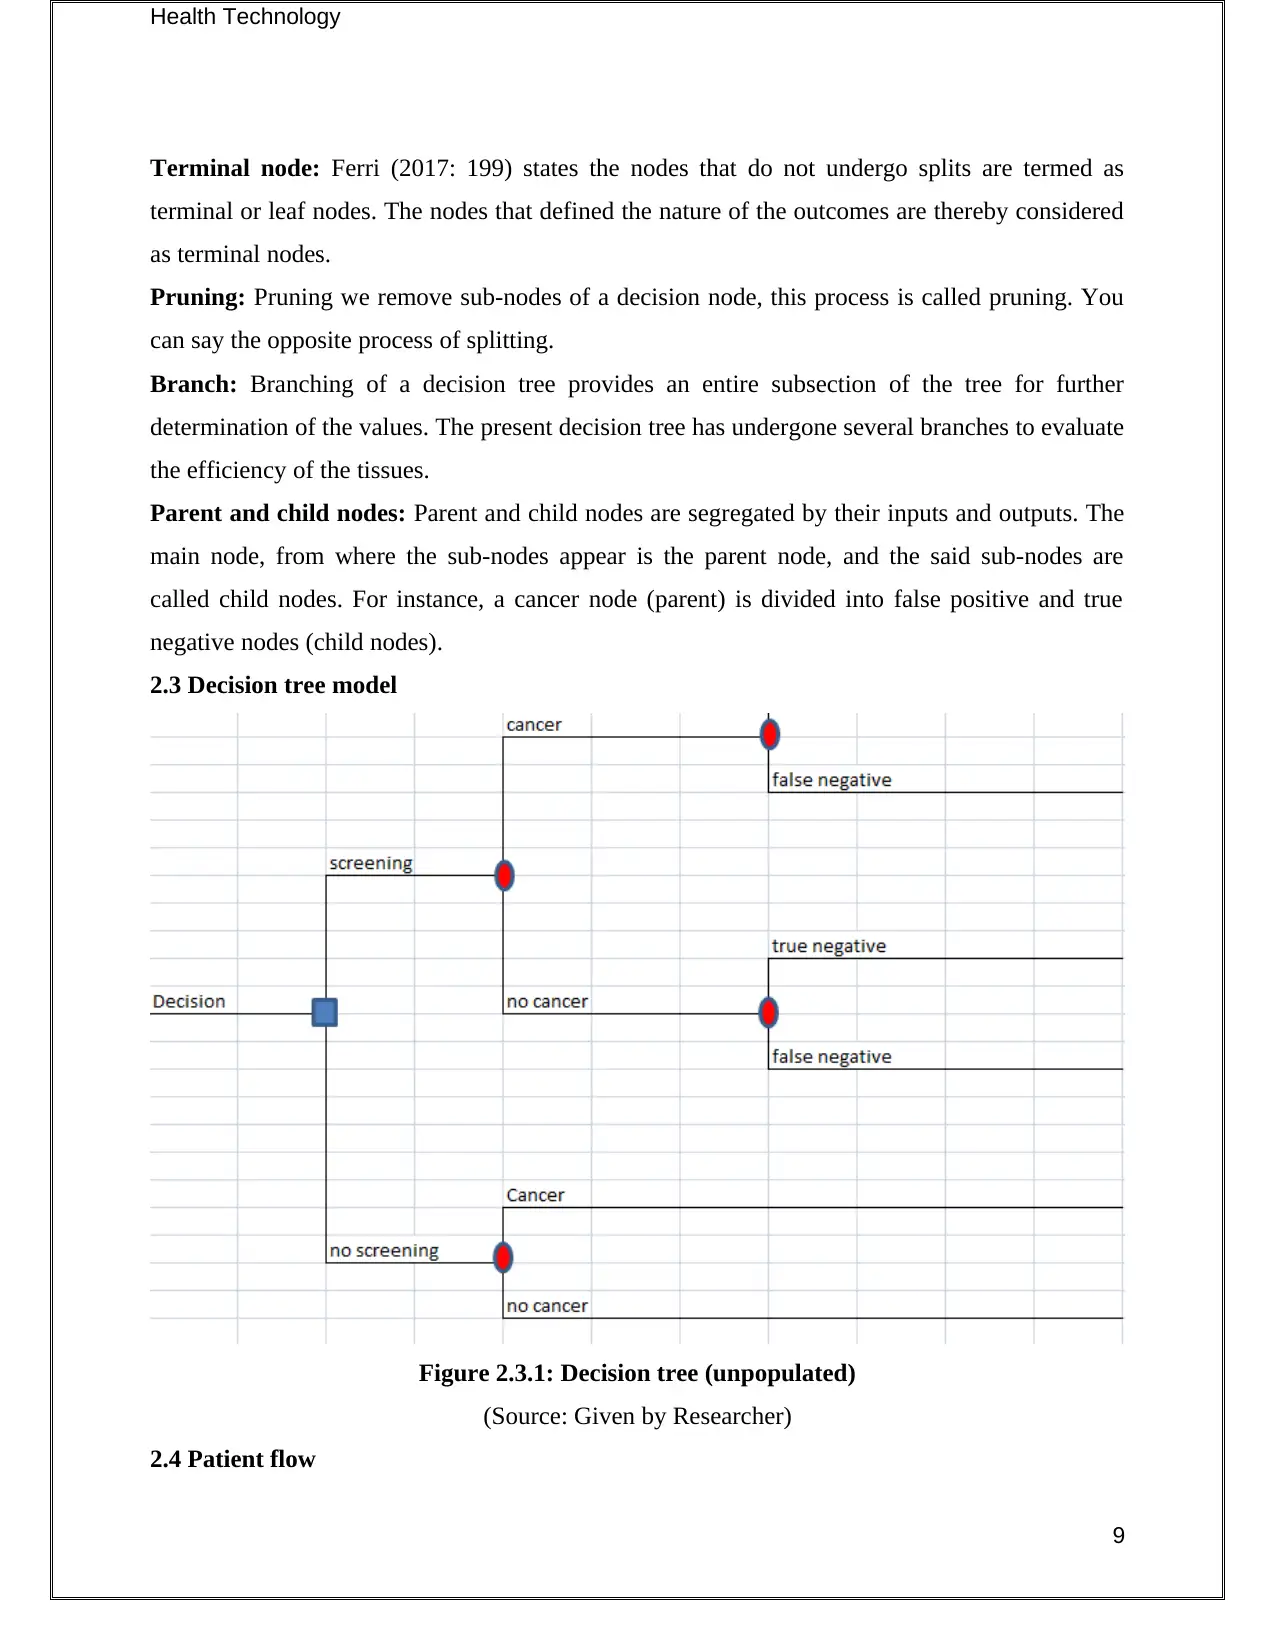
not satisfied with the test results and carried out a new examination of the similar cervical cells.
New Test Disease Status Total
Cervical
cancer (+ve)
Cervical
cancer (-ve)
Test (Positive) 49 36 85
Test
(Negative)
2 564 566
Total 51 600 651
Table 1: New Pap smear test
6
Introduction
Cervical screening tests aim to identify the prevalence of precancerous stages within a women's
body. Pap smear test is one of the most effective cervical screening tests that are followed by
clinicians to examine the occurrence of the cancerous stage. Cervical neoplasia could be easily
detected with the help of these screening tests thereby preventing the affected women from
developing cancer. A cohort study has been carried out, and test results will be interpreted in this
current report. Based on the clinical test results, an analysis will be carried out, and finally, a
recommendation will also be provided that will help any women to understand the occurrence of
any cervical cancer.
Part One: Accuracy of test alternatives
In a conventional Pap smear test, the clinician collects cells from the cervix of the presumed
affected patient and smears them on a microscopic slide to test them. Adherence to these cells is
carried out with the help of fixative. These slides are then sent to laboratories for evaluation. In
the test, sensitivity and specificity examination of the smeared cervical cells are carried out to
understand their characteristics.
In the first clinical study, the clinicians observed sensitivity to be 74% while specificity was
about 94%. The high sensitivity of the test denotes that this test was able to identify the total
number of patients without any disease (Rho Cervical Cancer, 2018). However, the clinician was
not satisfied with the test results and carried out a new examination of the similar cervical cells.
New Test Disease Status Total
Cervical
cancer (+ve)
Cervical
cancer (-ve)
Test (Positive) 49 36 85
Test
(Negative)
2 564 566
Total 51 600 651
Table 1: New Pap smear test
6
⊘ This is a preview!⊘
Do you want full access?
Subscribe today to unlock all pages.
Trusted by 1+ million students worldwide
Health Technology
(Source: Created by the researcher)
a) Cervical screening tests
True positive- In medical testing, true positive results denote that these tests significantly depict
true results regarding the presence of any disease. Canfell et al. (2017:100) commented that true
positive tests enable any clinician to identify the presence of any disease. The value of this test
is- 49
False positive- In any case, the clinician has carried out a negative test on the affected patients to
test the prevalence of any disease. However, in this case, the patients showed positive results.
The value of this test is - 2
True negative- In this medical test, the patients showed negative results. This suggests that the
presumed patients did not suffer from cervical cancer and they do not have any cancerous growth
in their cervical part. The value of this test is- 564.
False negative- This test results wrongly interpret regarding the prevalence of any health
condition. Therefore, it can be assumed by the clinician that the affected patients did not suffer
from cervical cancer. The test value of this test is- 36.
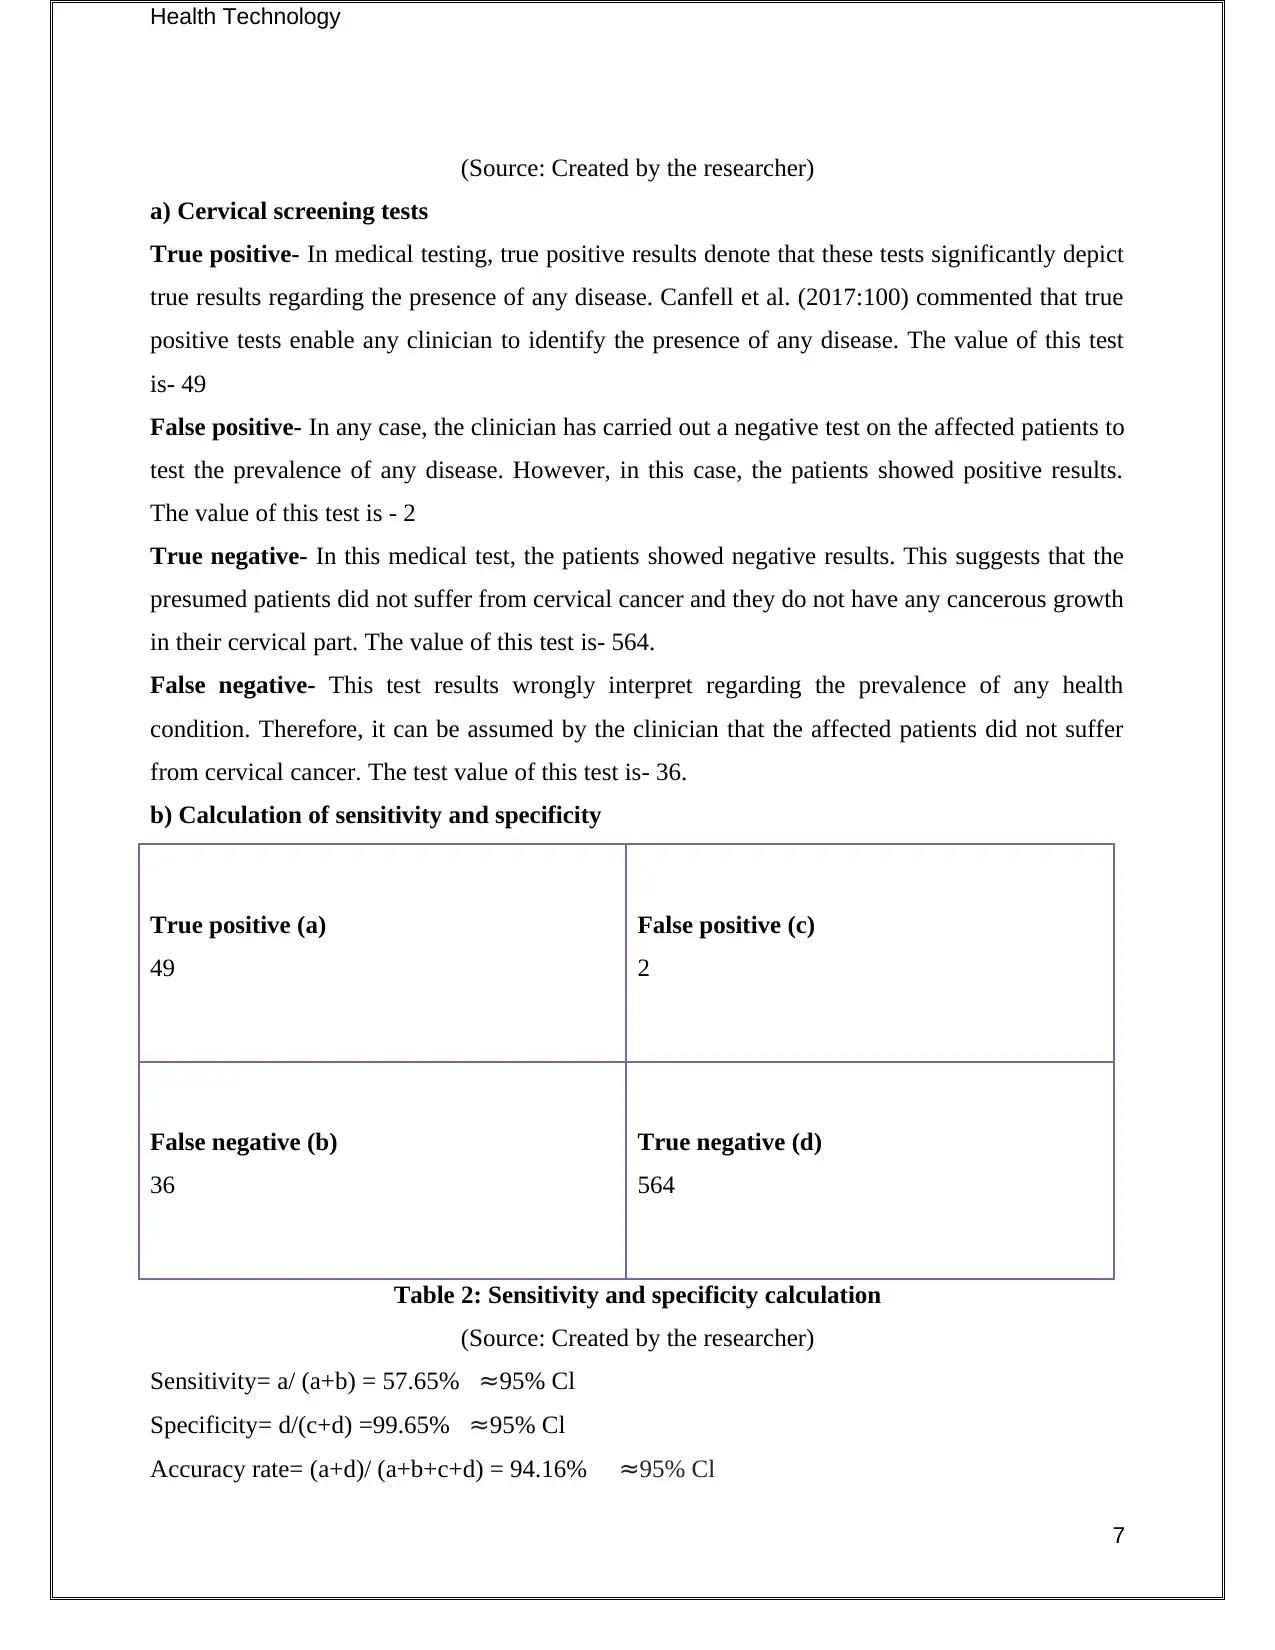
b) Calculation of sensitivity and specificity
True positive (a)
49
False positive (c)
2
False negative (b)
36
True negative (d)
564
Table 2: Sensitivity and specificity calculation
(Source: Created by the researcher)
Sensitivity= a/ (a+b) = 57.65% ≈95% Cl
Specificity= d/(c+d) =99.65% ≈95% Cl
Accuracy rate= (a+d)/ (a+b+c+d) = 94.16% ≈95% Cl
7
(Source: Created by the researcher)
a) Cervical screening tests
True positive- In medical testing, true positive results denote that these tests significantly depict
true results regarding the presence of any disease. Canfell et al. (2017:100) commented that true
positive tests enable any clinician to identify the presence of any disease. The value of this test
is- 49
False positive- In any case, the clinician has carried out a negative test on the affected patients to
test the prevalence of any disease. However, in this case, the patients showed positive results.
The value of this test is - 2
True negative- In this medical test, the patients showed negative results. This suggests that the
presumed patients did not suffer from cervical cancer and they do not have any cancerous growth
in their cervical part. The value of this test is- 564.
False negative- This test results wrongly interpret regarding the prevalence of any health
condition. Therefore, it can be assumed by the clinician that the affected patients did not suffer
from cervical cancer. The test value of this test is- 36.
b) Calculation of sensitivity and specificity
True positive (a)
49
False positive (c)
2
False negative (b)
36
True negative (d)
564
Table 2: Sensitivity and specificity calculation
(Source: Created by the researcher)
Sensitivity= a/ (a+b) = 57.65% ≈95% Cl
Specificity= d/(c+d) =99.65% ≈95% Cl
Accuracy rate= (a+d)/ (a+b+c+d) = 94.16% ≈95% Cl
7
Paraphrase This Document
Need a fresh take? Get an instant paraphrase of this document with our AI Paraphraser
Health Technology
c) Comparison between the current and old test
This new cohort study significantly shows a better and higher specificity test as compared with
the previous one. Blatt et al. (2015:282-288) commented that higher (99%) specificity test means
successful identification of those patients without any disease. This specificity test was able to
analyze the total number of patients that did not suffer from cervical cancer. Therefore, proper
analyzation of the number of patients without having any disease is beneficial for these kinds of
tests.
However, in this new test, the sensitivity rate is 57.67% which lower than the initial test (74%).
Therefore, lower sensitivity test depicts the inability to identify the total number of patients
suffering from cervical cancer. Overall high specificity test is beneficial for any clinician in
analyzing the total number of patients suffering from cervical cancer.
Part 2: Decision tree
2.1 Identification of use
Decision trees help to support a deduction that is to be taken after a set of observation in a given
study. In this report, the applicability of the tests is determined by the help of a decision tree to
evaluate the efficiency of the tests in consideration with possible consequences. The said
consequences involve outcomes from chance events, utility and resource costs. Malanga &
Mautner (2016: 139) consider decision trees display specific algorithms containing condition-
controlled statements.
2.2 Elements of the decision tree
The main elements of a decision tree are given below, with an appropriate explanation to justify
the terminologies.
Root node: Root node of a decision tree represents a batch or sample of the population that is
further segregated into additional homogeneous datasets.
Splitting: Splitting refers to the process divide a node in the decision tree into multiple sub-
nodes (Arrossi et al. 2015: 85-94). Here, splitting has been done on cancer and no-cancer nodes.
Decision node: A decision node is created when a sub-node is divided into further intermittent
nodes to reach a decision. In this case, the decision nodes are presented through outcomes about
costings and relevant benefits.
8
Health Technology
Terminal node: Ferri (2017: 199) states the nodes that do not undergo splits are termed as
terminal or leaf nodes. The nodes that defined the nature of the outcomes are thereby considered
as terminal nodes.
Pruning: Pruning we remove sub-nodes of a decision node, this process is called pruning. You
can say the opposite process of splitting.
Branch: Branching of a decision tree provides an entire subsection of the tree for further
determination of the values. The present decision tree has undergone several branches to evaluate
the efficiency of the tissues.
Parent and child nodes: Parent and child nodes are segregated by their inputs and outputs. The
main node, from where the sub-nodes appear is the parent node, and the said sub-nodes are
called child nodes. For instance, a cancer node (parent) is divided into false positive and true
negative nodes (child nodes).
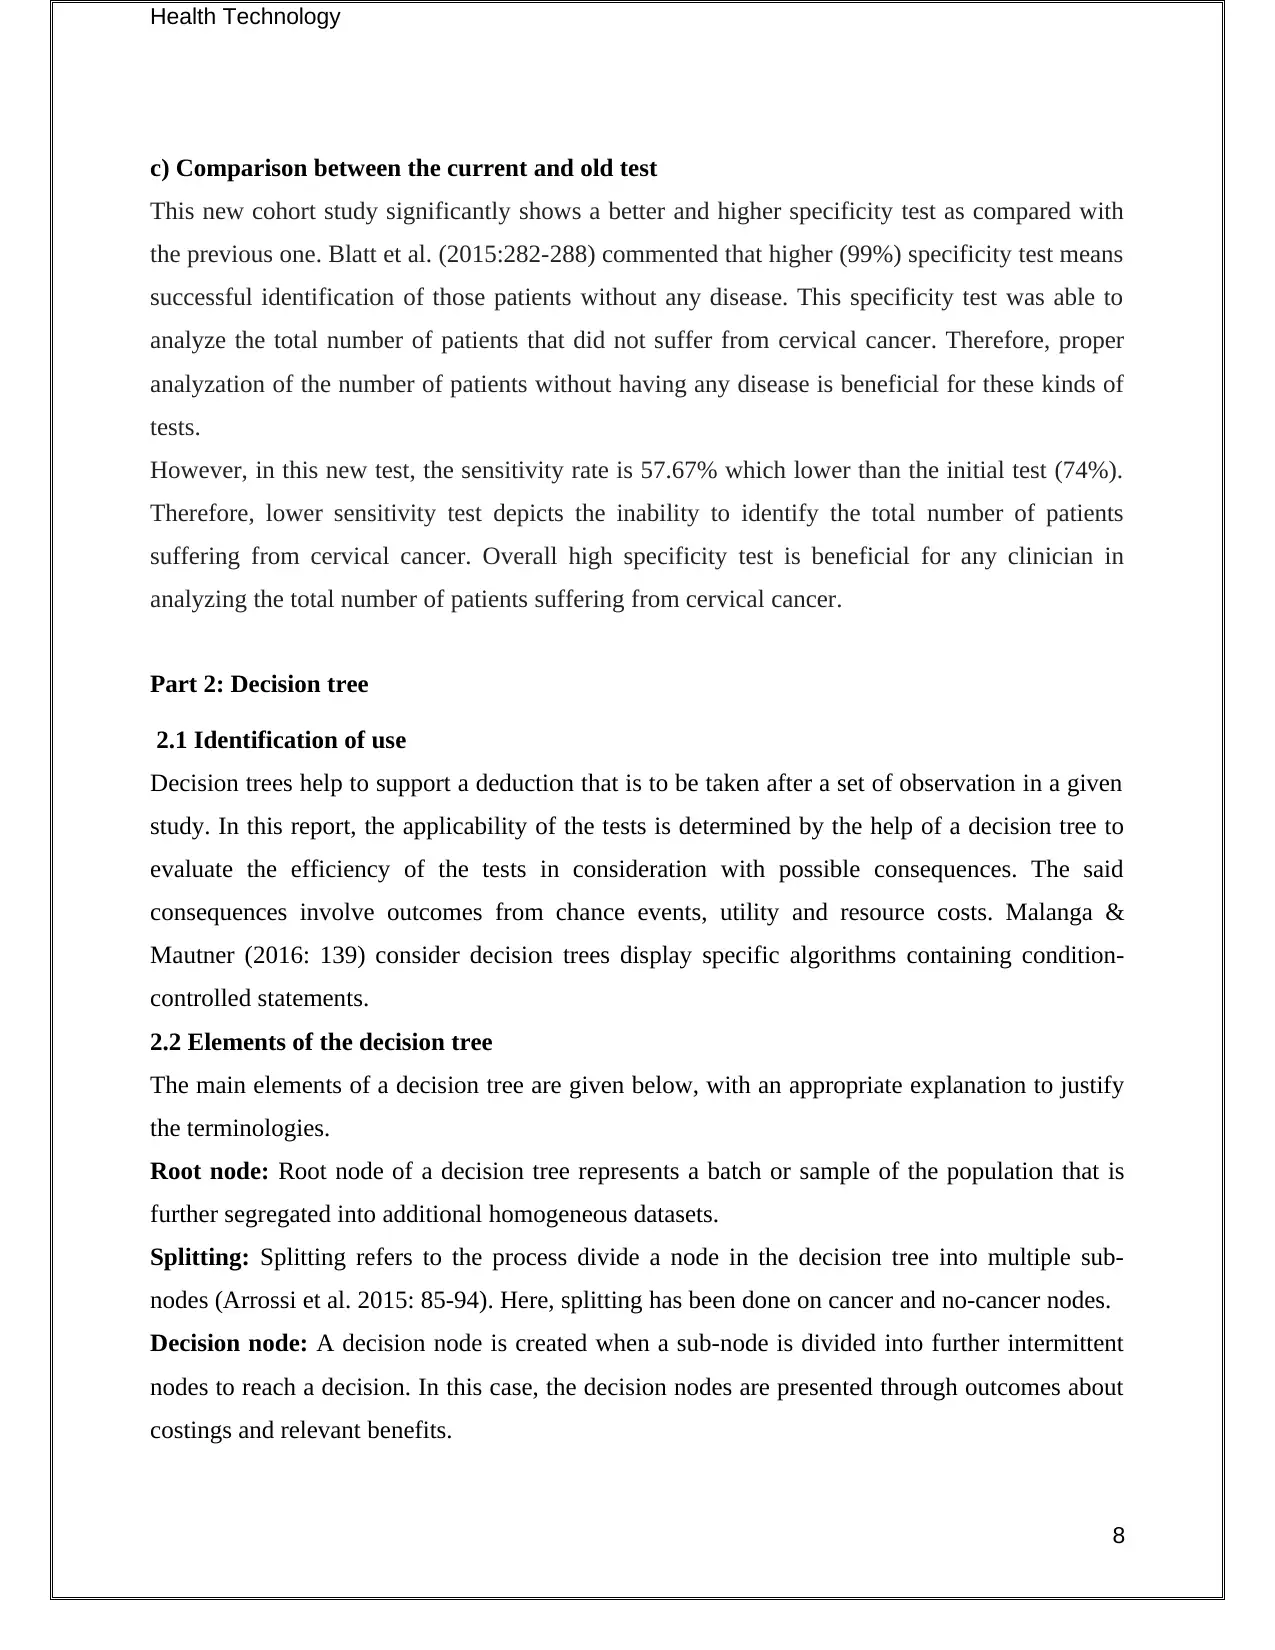
2.3 Decision tree model
Figure 2.3.1: Decision tree (unpopulated)
(Source: Given by Researcher)
2.4 Patient flow
9
Terminal node: Ferri (2017: 199) states the nodes that do not undergo splits are termed as
terminal or leaf nodes. The nodes that defined the nature of the outcomes are thereby considered
as terminal nodes.
Pruning: Pruning we remove sub-nodes of a decision node, this process is called pruning. You
can say the opposite process of splitting.
Branch: Branching of a decision tree provides an entire subsection of the tree for further
determination of the values. The present decision tree has undergone several branches to evaluate
the efficiency of the tissues.
Parent and child nodes: Parent and child nodes are segregated by their inputs and outputs. The
main node, from where the sub-nodes appear is the parent node, and the said sub-nodes are
called child nodes. For instance, a cancer node (parent) is divided into false positive and true
negative nodes (child nodes).
2.3 Decision tree model
Figure 2.3.1: Decision tree (unpopulated)
(Source: Given by Researcher)
2.4 Patient flow
9
⊘ This is a preview!⊘
Do you want full access?
Subscribe today to unlock all pages.
Trusted by 1+ million students worldwide
Health Technology
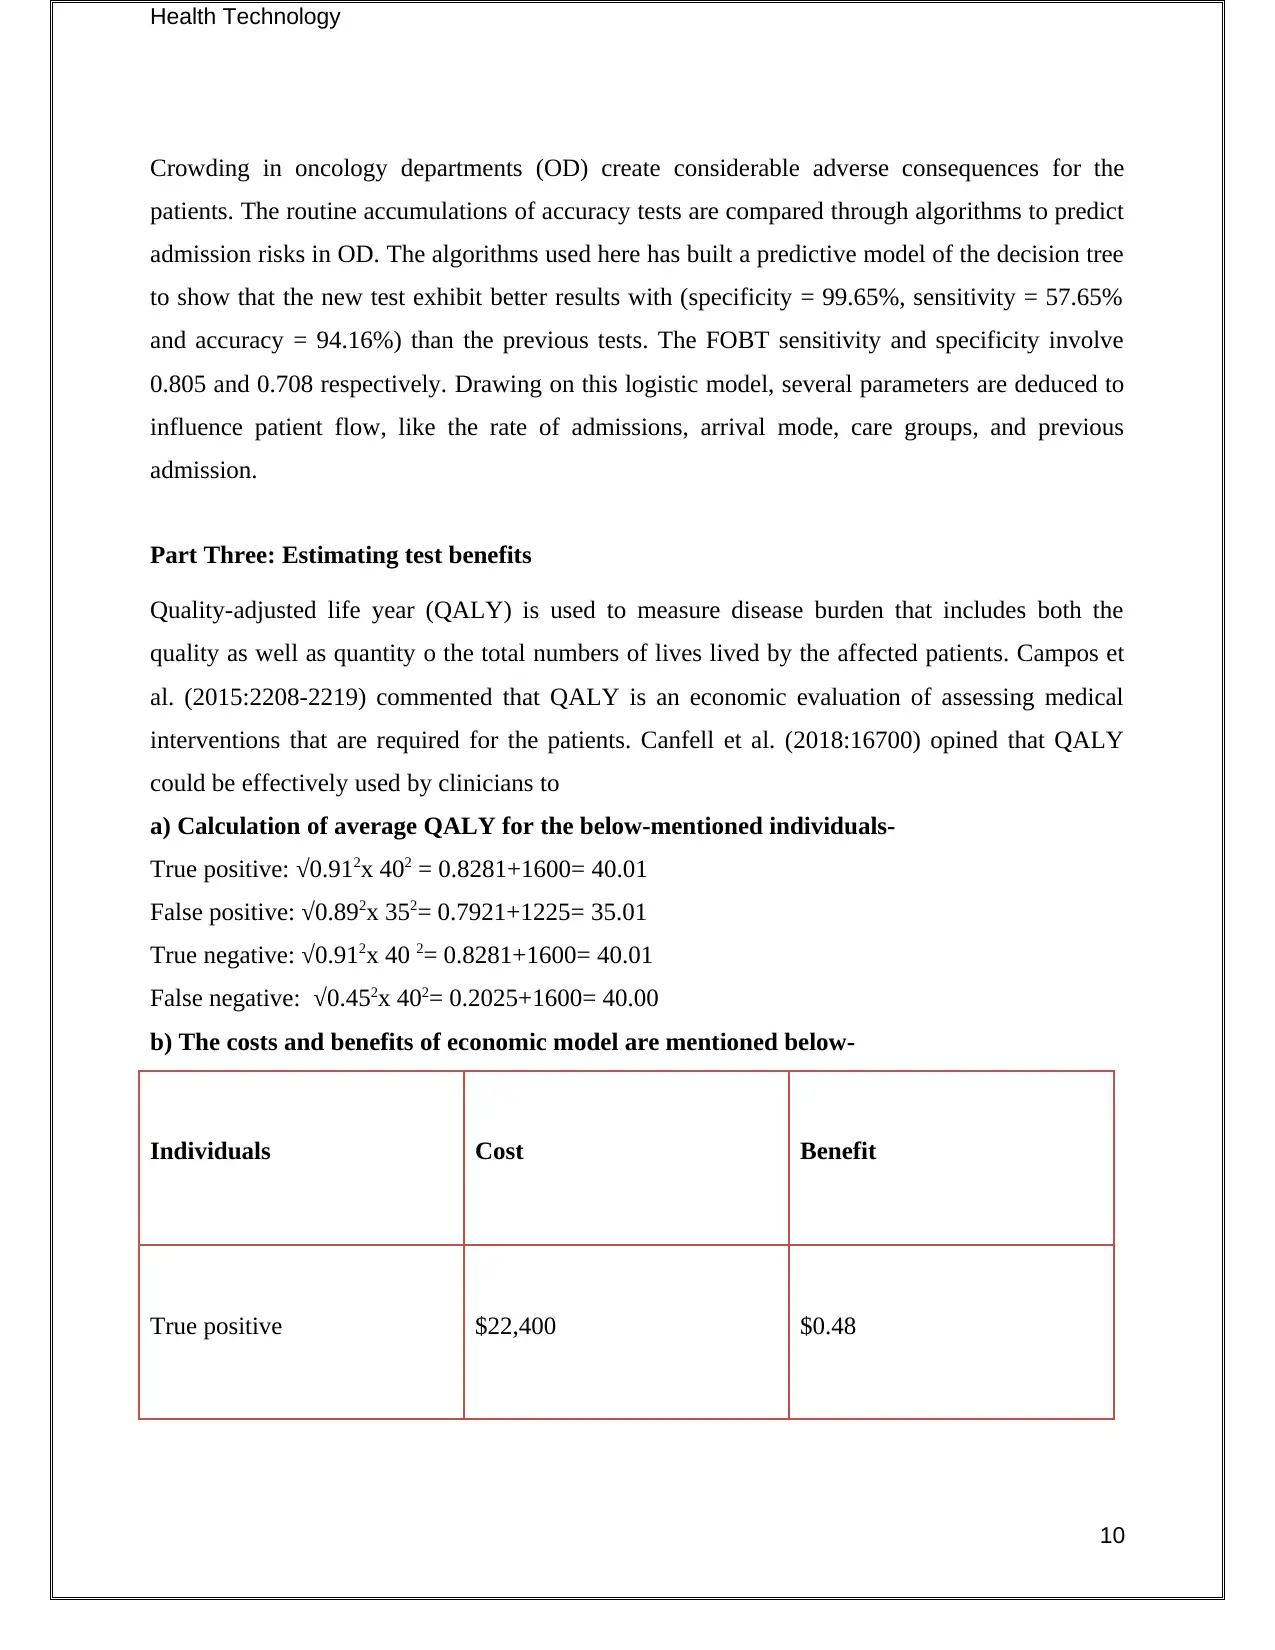
Crowding in oncology departments (OD) create considerable adverse consequences for the
patients. The routine accumulations of accuracy tests are compared through algorithms to predict
admission risks in OD. The algorithms used here has built a predictive model of the decision tree
to show that the new test exhibit better results with (specificity = 99.65%, sensitivity = 57.65%
and accuracy = 94.16%) than the previous tests. The FOBT sensitivity and specificity involve
0.805 and 0.708 respectively. Drawing on this logistic model, several parameters are deduced to
influence patient flow, like the rate of admissions, arrival mode, care groups, and previous
admission.
Part Three: Estimating test benefits
Quality-adjusted life year (QALY) is used to measure disease burden that includes both the
quality as well as quantity o the total numbers of lives lived by the affected patients. Campos et
al. (2015:2208-2219) commented that QALY is an economic evaluation of assessing medical
interventions that are required for the patients. Canfell et al. (2018:16700) opined that QALY
could be effectively used by clinicians to
a) Calculation of average QALY for the below-mentioned individuals-
True positive: √0.912x 402 = 0.8281+1600= 40.01
False positive: √0.892x 352= 0.7921+1225= 35.01
True negative: √0.912x 40 2= 0.8281+1600= 40.01
False negative: √0.452x 402= 0.2025+1600= 40.00
b) The costs and benefits of economic model are mentioned below-
Individuals Cost Benefit
True positive $22,400 $0.48
10
Paraphrase This Document
Need a fresh take? Get an instant paraphrase of this document with our AI Paraphraser

Health Technology
False negative $32,200 0.42
False positive $350 0.83
True Negative $50 0.90
Table 3: Cost and benefit table
(Source: Created by the researcher)
Discounting future costs is beneficial for obtaining effective test results. Demarco et al.
(2018:1910) commented that costs and benefits are required to be discounted to minimize the
high prevalence of health issues. Hariri et al. (2015:1608-1613) further added that costs and
benefits discounting might penalize preventative health care programs. Thus, it is essential for
the clinicians to analyze effectively the health outcomes of their patients to minimize their future
costs.
Part Four: Cost estimation
a) Identification of cost elements
To obtain effective results, new pap smear test required to be performed by the clinicians to
understand and identify the patients suffering from a cervical test. Appointment of the general
physician is also required by the patients in order to understand the test results. Sabatino et al.
(2015:464-468) opined that treatment is not required for true negative patients. Simms et al.
(2017:366) commented that cervical pap smear test is used to analyze the occurrence or
prevalence of cancerous cells in the cervix of the presumed affected patients. Similarly, early
treatment is required for true positive patients. Crowe et al. (2014:1455) commented that true
positive patients seem to suffer from precancerous growth and therefore, proper and early
11

Health Technology
treatment is required to secure their health condition. False negative patients should be provided
with proper and appropriate treatment. However, in case they do not follow early treatment
options, then delayed treatment should be provided to them.
b) Estimation of cost elements for the current test
Current
test
New
Test
GP
visit
Further
exam –
no treat
Further
exam –
early
treat
Delayed
treatmen
t
Total
Curren
t test
True
Positive
$50 $70 $1000 $1120
False
positive
$50 $70 $500 $620
True
negative
$50 $35 $85
False
negative
$50 $35 $50,000 $50,085
Table 4: Current cost element test
(Source: Created by the researcher)
c) Estimation of cost elements for the new test
Curre
nt test
New
Test
GP
visit
Furth
er
exam
– no
treat
Further
exam –
early
treat
Delayed
treatment
Total
New
Test
True
Positive
$400 $70 $1000 $1470
False
positive
$400 $70 $500 $970
True
negativ
$400 $35 $435
12
⊘ This is a preview!⊘
Do you want full access?
Subscribe today to unlock all pages.
Trusted by 1+ million students worldwide
1 out of 21
Related Documents


Your All-in-One AI-Powered Toolkit for Academic Success.
+13062052269
info@desklib.com
Available 24*7 on WhatsApp / Email
![[object Object]](/_next/static/media/star-bottom.7253800d.svg)
Unlock your academic potential
Copyright © 2020–2026 A2Z Services. All Rights Reserved. Developed and managed by ZUCOL.