Excel and Weka for Data Handling and Business Intelligence
VerifiedAdded on 2023/01/11
|17
|3192
|53
Report
AI Summary
This report focuses on data handling and business intelligence methods, specifically analyzing superstore data to identify and analyze sales and profit trends. The analysis is performed using Excel for data pre-processing, visualization, and practical analysis using functions like Lookup and Pivot tables. The report also explores the conjunction of audidealership data with Weka software using clustering techniques. Furthermore, it discusses data mining methods applicable in real business scenarios and compares the advantages and disadvantages of using Weka versus Excel for data analysis, emphasizing the importance of these tools for informed decision-making and business strategy enhancement.
DATA HANDLING AND
BUSINESS INTELLIGENCE
BUSINESS INTELLIGENCE
Paraphrase This Document
Need a fresh take? Get an instant paraphrase of this document with our AI Paraphraser
TABLE OF CONTENTS
INTRODUCTION...........................................................................................................................1
PART 1............................................................................................................................................1
By using data set of superstores analyse profit and sales over years and analyse it by using
Excel for pre- processing of data, also analyse and visualize the data........................................1
Demonstration of ways in which data can be practically analysed using Excel functions such
as Lookup, Pivot table, graphs and charts...................................................................................6
PART 2............................................................................................................................................9
2.1 By using audidealership.csv file show conjunction with Weka with the example of
clustering......................................................................................................................................9
2.2 explain data mining method that can be used in real business............................................11
2.3 Discuss advantage and disadvantage of weka over excel....................................................12
CONCLUSION..............................................................................................................................14
REREFENCES..............................................................................................................................15
INTRODUCTION
Data mining is a kind of process which is used by organizations for data analysis, finding
pattern within large amount of data set and for various other kind of purposes. It has become one
of the most important part of an organization as it helps them in decision making, predict future
sales and for many other purposes (Unat and et. al., 2016). Data handing and business
intelligence methods are majorly used for analysing and extracting information from large
amount of data so that new data can be used for bringing changes within business strategies in
order to enhance revenue and profitability of organizations. Today it has become one of the most
important and effective part of an organization and is used in different ways in many industries
but mostly Business intelligence is used. Business intelligence is a kind of process, method or
technology that helps an organization to use, convert, analyse and extract meaningful data from
raw data which further helps an organization to expand their business and increase profitability.
For retail sector organizations it is extremely important for they need to develop strategies by
predicting their future sales on the basis of their current sales. This assignment will focus on
analysis of superstore data in order to identify and analyse sales and profit of the organization.
This assignment will also focus on conjunction in Weka Software of audidealership data with the
help of clustering and lastly advantages and disadvantage of Weka over Excel.
PART 1
By using data set of superstores analyse profit and sales over years and analyse it by using Excel
for pre- processing of data, also analyse and visualize the data
Data mining is majorly used for data handing and conducting business intelligence
operations. There are various kinds of methods that are used for data mining that comes under
data handing and business intelligence such as database systems, machine learning intersection
and statistics and many more. In order to transform data or extract useful information from it
there are many kinds of software’s or tools that can be used by organizations which helps
organizations to bring changes within their current strategies. Excel is one of those tools which is
based upon Data mining technique (Sajitha, Minimol and Mini, 2019). Mostly Excel is used by
organizations for financial calculation like calculation of their profit and sales, forecasting or
predicting future sales and for many other purposes. It is one of the most common data mining
tool which is used by organizations as it has various kinds of inbuilt functions that can be used
by organizations for data analysis. It can be used by organization to study many years past data
1
⊘ This is a preview!⊘
Do you want full access?
Subscribe today to unlock all pages.
Trusted by 1+ million students worldwide
and analyse their sales and profitability in many ways. Not only this, Excel provides various
kinds of options for creating a pivot table, creating graphs and many more. It also has inbuilt
formula to search a value in a large data set as well (Zelinka and et. al., 2018). Excel is majorly
used for organizing and arranging the data in such a manner that it can used for further analysis.
In order to analysis sales and overall profit of the provided data Excel can be used.
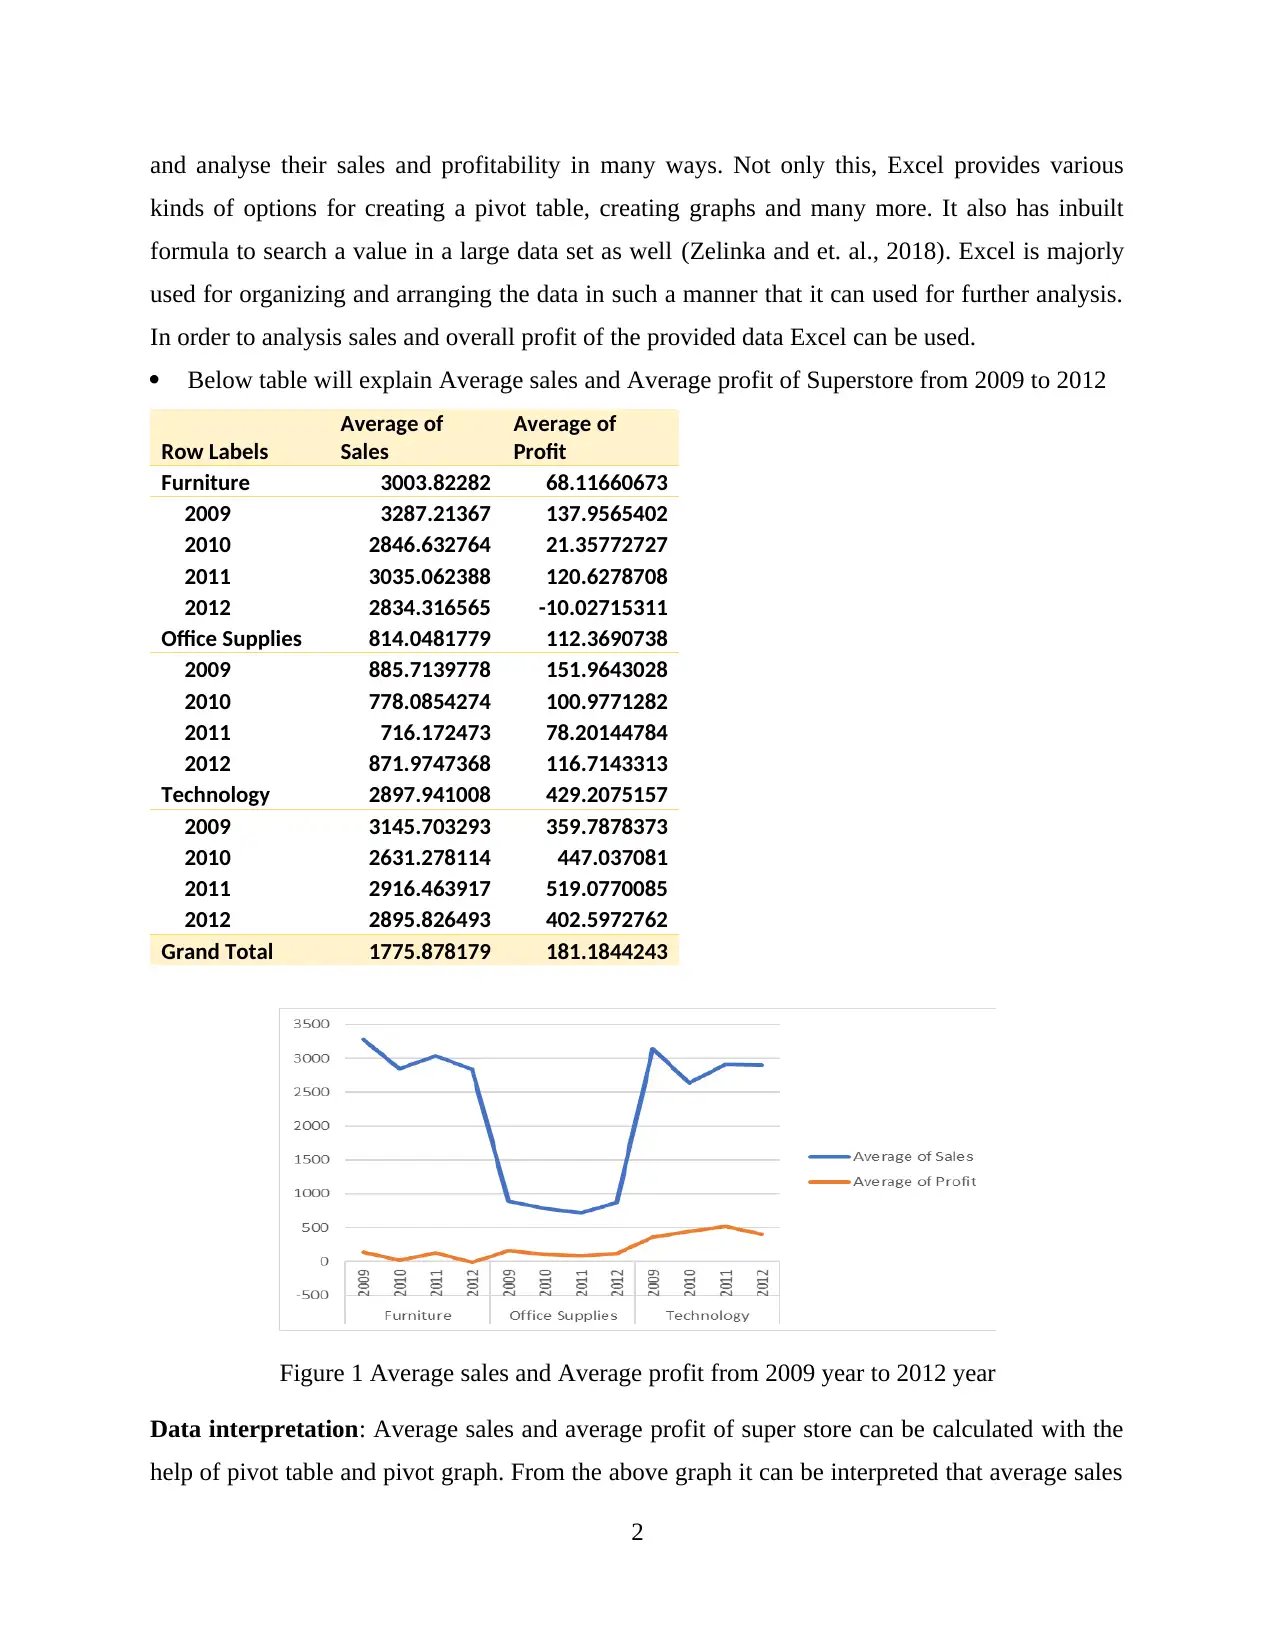
Below table will explain Average sales and Average profit of Superstore from 2009 to 2012
Row Labels
Average of
Sales
Average of
Profit
Furniture 3003.82282 68.11660673
2009 3287.21367 137.9565402
2010 2846.632764 21.35772727
2011 3035.062388 120.6278708
2012 2834.316565 -10.02715311
Office Supplies 814.0481779 112.3690738
2009 885.7139778 151.9643028
2010 778.0854274 100.9771282
2011 716.172473 78.20144784
2012 871.9747368 116.7143313
Technology 2897.941008 429.2075157
2009 3145.703293 359.7878373
2010 2631.278114 447.037081
2011 2916.463917 519.0770085
2012 2895.826493 402.5972762
Grand Total 1775.878179 181.1844243
Figure 1 Average sales and Average profit from 2009 year to 2012 year
Data interpretation: Average sales and average profit of super store can be calculated with the
help of pivot table and pivot graph. From the above graph it can be interpreted that average sales
2
kinds of options for creating a pivot table, creating graphs and many more. It also has inbuilt
formula to search a value in a large data set as well (Zelinka and et. al., 2018). Excel is majorly
used for organizing and arranging the data in such a manner that it can used for further analysis.
In order to analysis sales and overall profit of the provided data Excel can be used.
Below table will explain Average sales and Average profit of Superstore from 2009 to 2012
Row Labels
Average of
Sales
Average of
Profit
Furniture 3003.82282 68.11660673
2009 3287.21367 137.9565402
2010 2846.632764 21.35772727
2011 3035.062388 120.6278708
2012 2834.316565 -10.02715311
Office Supplies 814.0481779 112.3690738
2009 885.7139778 151.9643028
2010 778.0854274 100.9771282
2011 716.172473 78.20144784
2012 871.9747368 116.7143313
Technology 2897.941008 429.2075157
2009 3145.703293 359.7878373
2010 2631.278114 447.037081
2011 2916.463917 519.0770085
2012 2895.826493 402.5972762
Grand Total 1775.878179 181.1844243
Figure 1 Average sales and Average profit from 2009 year to 2012 year
Data interpretation: Average sales and average profit of super store can be calculated with the
help of pivot table and pivot graph. From the above graph it can be interpreted that average sales
2
Paraphrase This Document
Need a fresh take? Get an instant paraphrase of this document with our AI Paraphraser
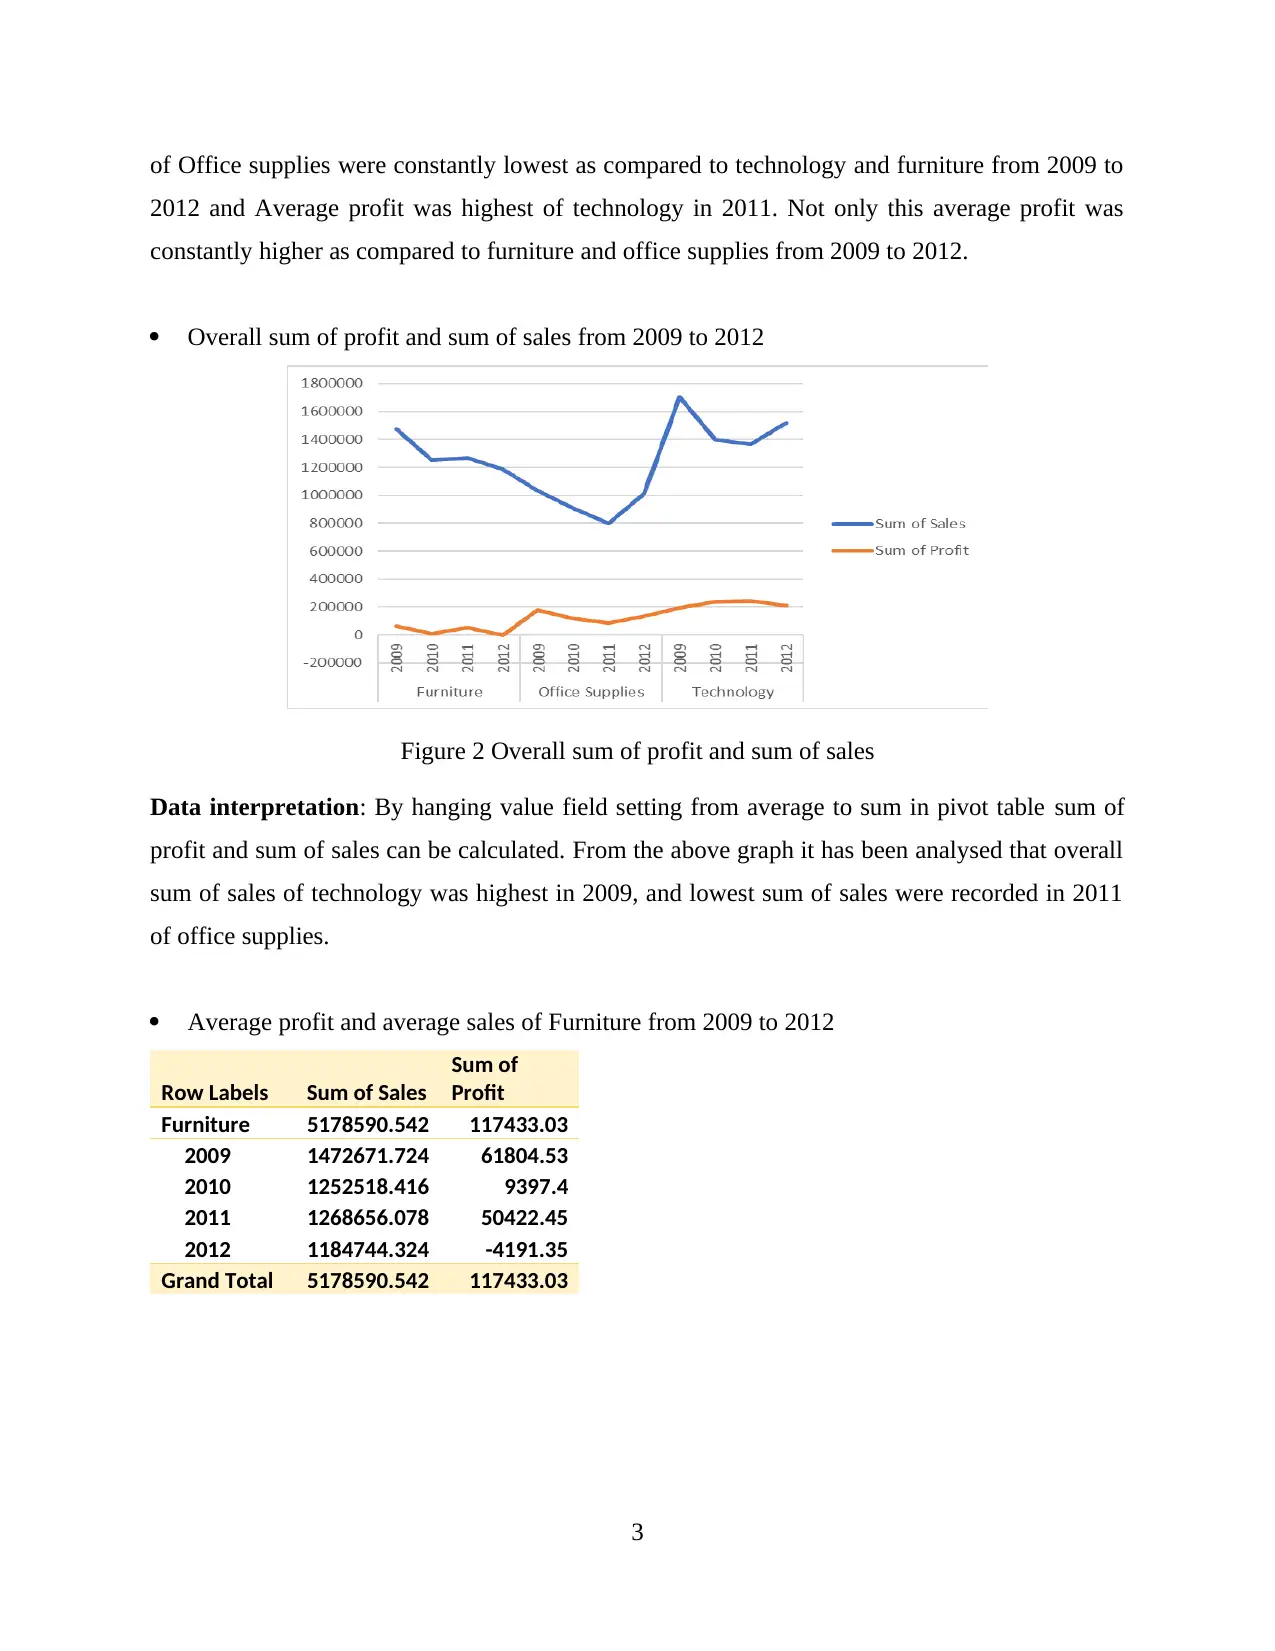
of Office supplies were constantly lowest as compared to technology and furniture from 2009 to
2012 and Average profit was highest of technology in 2011. Not only this average profit was
constantly higher as compared to furniture and office supplies from 2009 to 2012.
Overall sum of profit and sum of sales from 2009 to 2012
Figure 2 Overall sum of profit and sum of sales
Data interpretation: By hanging value field setting from average to sum in pivot table sum of
profit and sum of sales can be calculated. From the above graph it has been analysed that overall
sum of sales of technology was highest in 2009, and lowest sum of sales were recorded in 2011
of office supplies.
Average profit and average sales of Furniture from 2009 to 2012
Row Labels Sum of Sales
Sum of
Profit
Furniture 5178590.542 117433.03
2009 1472671.724 61804.53
2010 1252518.416 9397.4
2011 1268656.078 50422.45
2012 1184744.324 -4191.35
Grand Total 5178590.542 117433.03
3
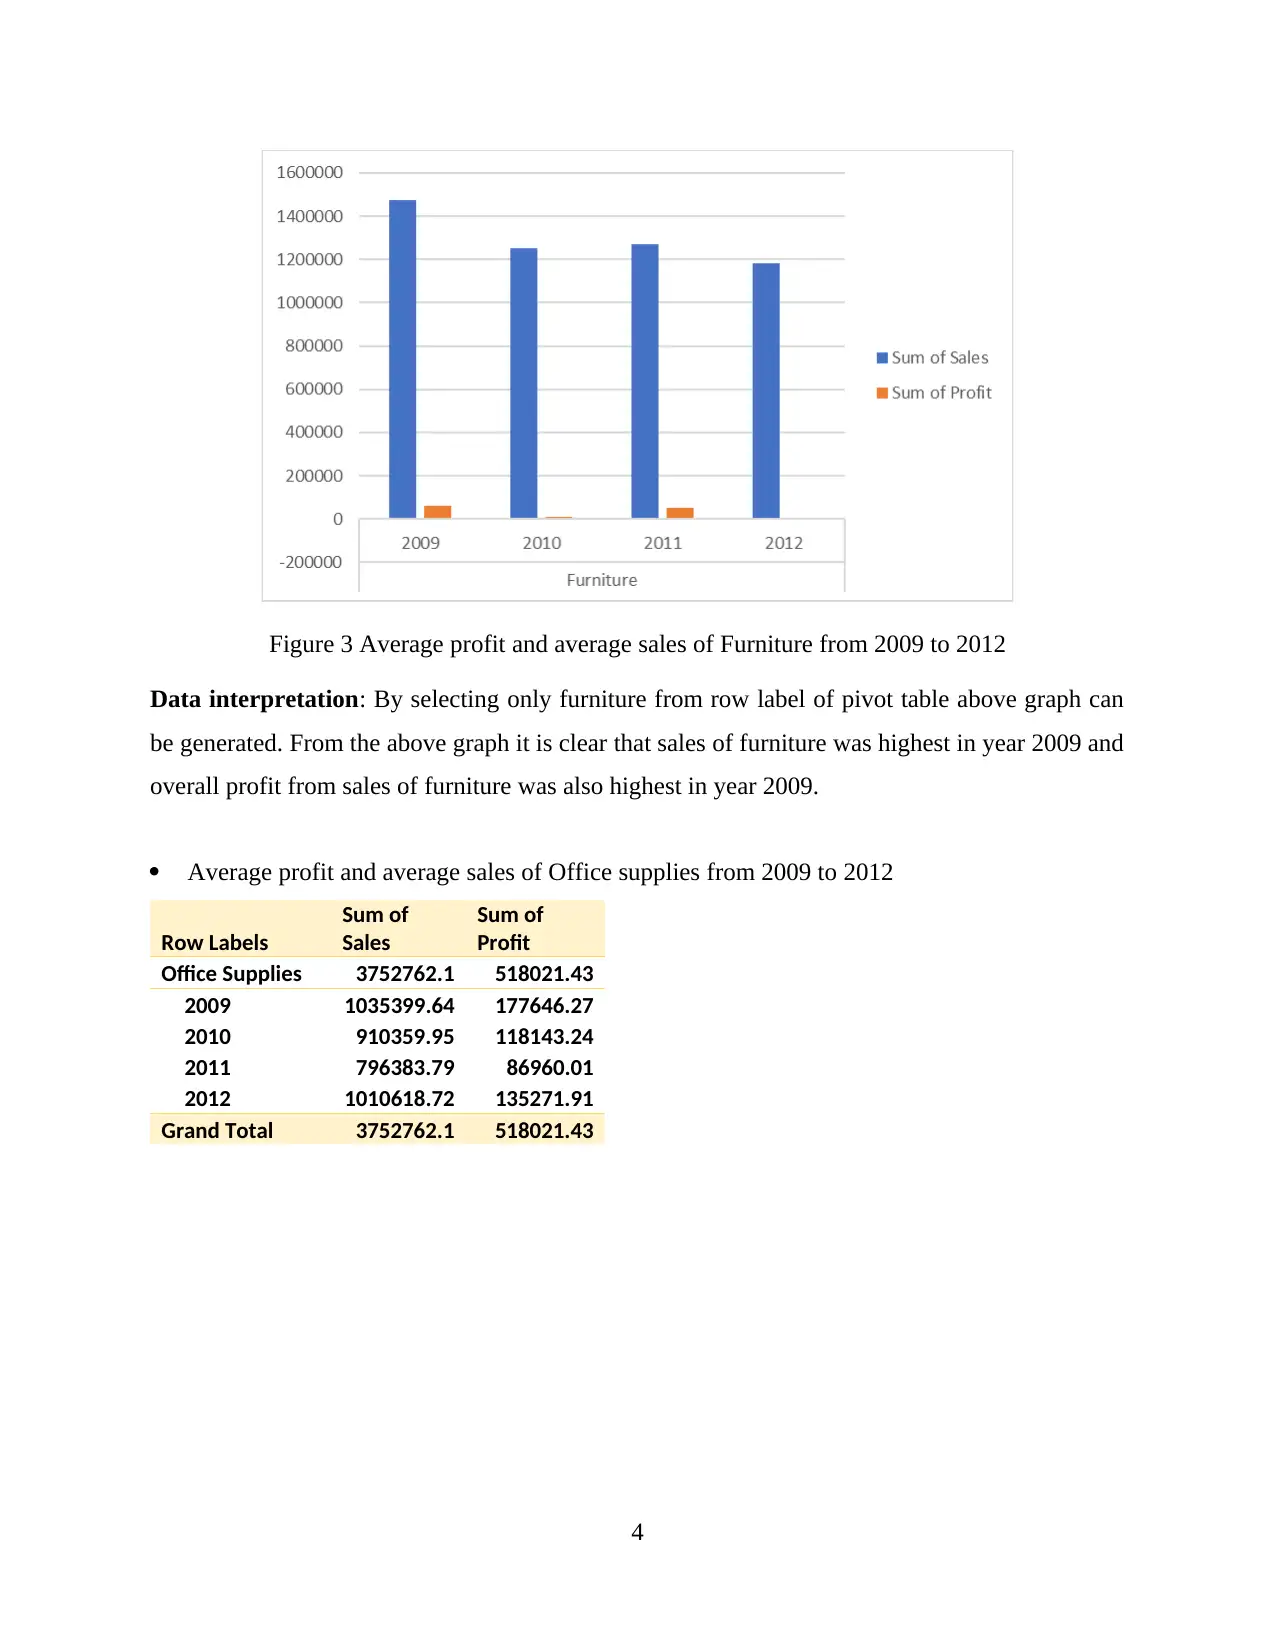
Figure 3 Average profit and average sales of Furniture from 2009 to 2012
Data interpretation: By selecting only furniture from row label of pivot table above graph can
be generated. From the above graph it is clear that sales of furniture was highest in year 2009 and
overall profit from sales of furniture was also highest in year 2009.
Average profit and average sales of Office supplies from 2009 to 2012
Row Labels
Sum of
Sales
Sum of
Profit
Office Supplies 3752762.1 518021.43
2009 1035399.64 177646.27
2010 910359.95 118143.24
2011 796383.79 86960.01
2012 1010618.72 135271.91
Grand Total 3752762.1 518021.43
4
⊘ This is a preview!⊘
Do you want full access?
Subscribe today to unlock all pages.
Trusted by 1+ million students worldwide
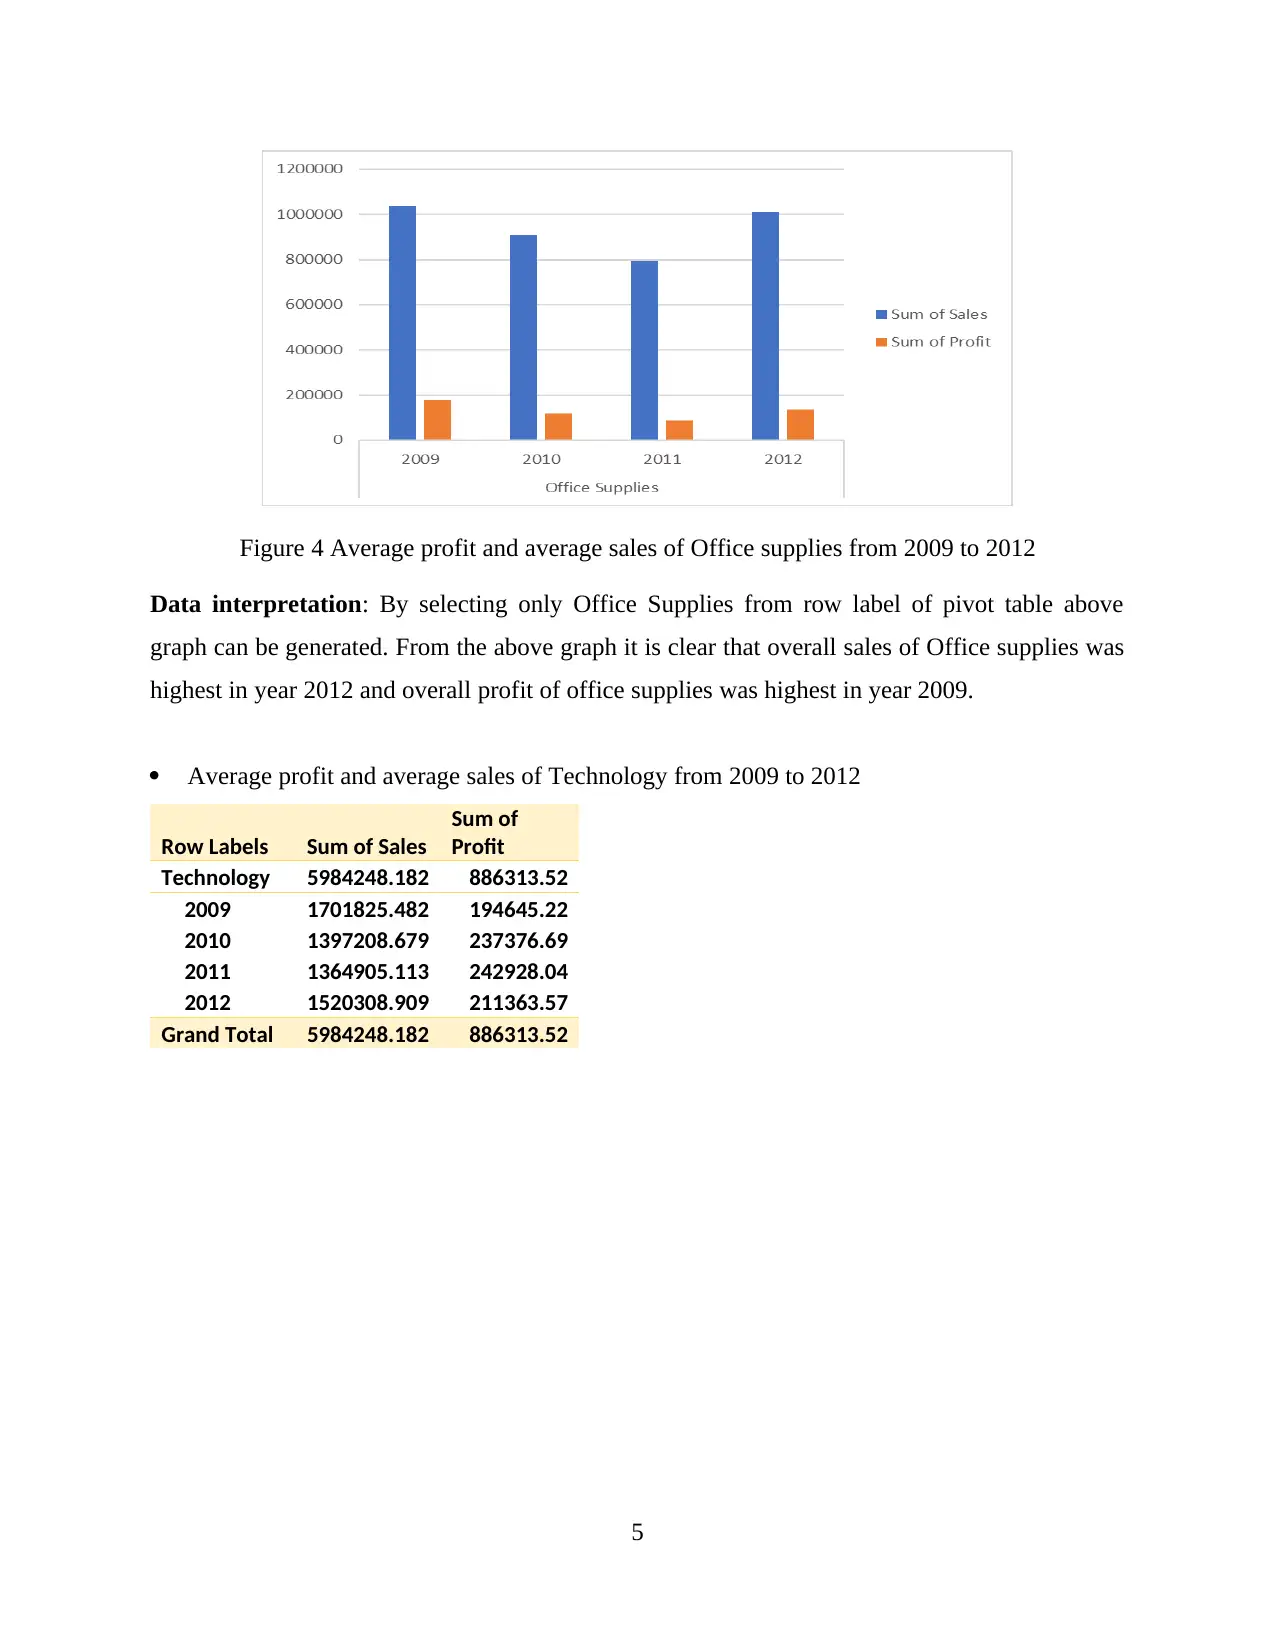
Figure 4 Average profit and average sales of Office supplies from 2009 to 2012
Data interpretation: By selecting only Office Supplies from row label of pivot table above
graph can be generated. From the above graph it is clear that overall sales of Office supplies was
highest in year 2012 and overall profit of office supplies was highest in year 2009.
Average profit and average sales of Technology from 2009 to 2012
Row Labels Sum of Sales
Sum of
Profit
Technology 5984248.182 886313.52
2009 1701825.482 194645.22
2010 1397208.679 237376.69
2011 1364905.113 242928.04
2012 1520308.909 211363.57
Grand Total 5984248.182 886313.52
5
Paraphrase This Document
Need a fresh take? Get an instant paraphrase of this document with our AI Paraphraser
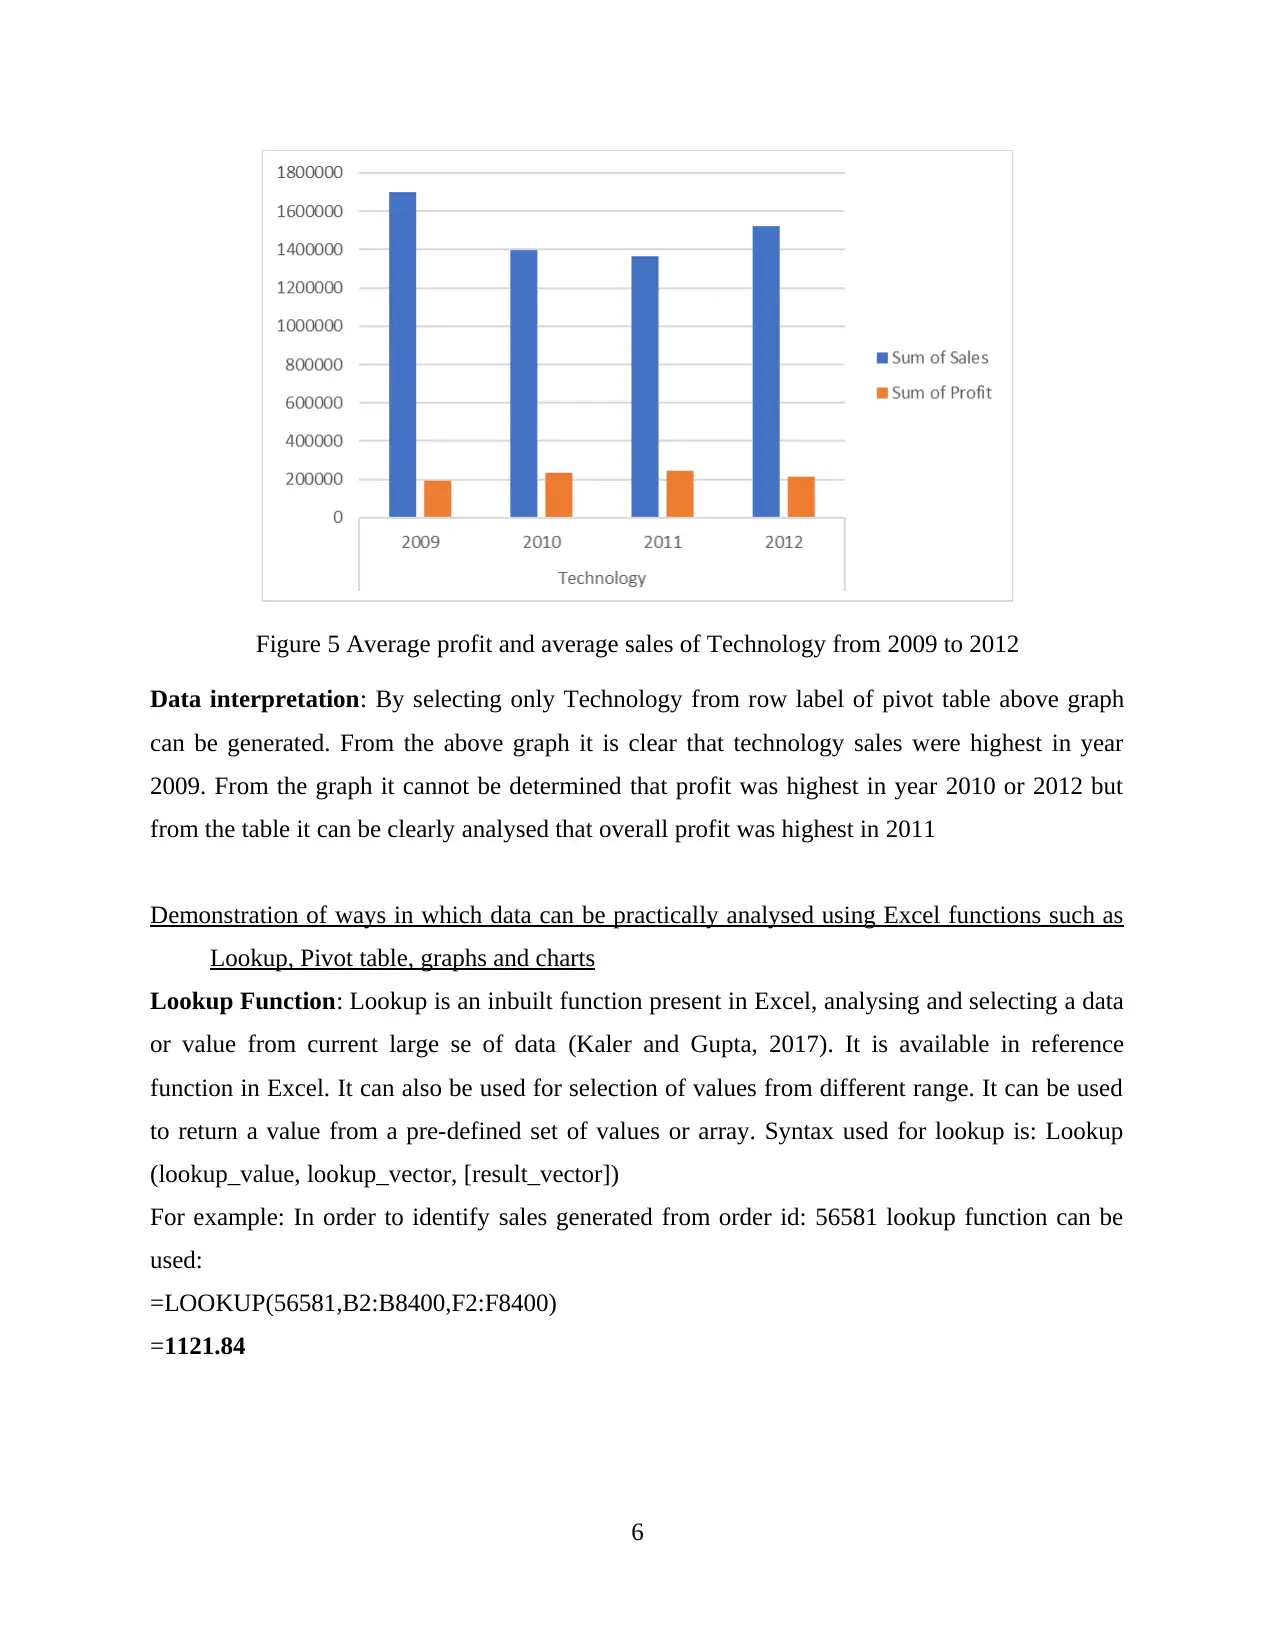
Figure 5 Average profit and average sales of Technology from 2009 to 2012
Data interpretation: By selecting only Technology from row label of pivot table above graph
can be generated. From the above graph it is clear that technology sales were highest in year
2009. From the graph it cannot be determined that profit was highest in year 2010 or 2012 but
from the table it can be clearly analysed that overall profit was highest in 2011
Demonstration of ways in which data can be practically analysed using Excel functions such as
Lookup, Pivot table, graphs and charts
Lookup Function: Lookup is an inbuilt function present in Excel, analysing and selecting a data
or value from current large se of data (Kaler and Gupta, 2017). It is available in reference
function in Excel. It can also be used for selection of values from different range. It can be used
to return a value from a pre-defined set of values or array. Syntax used for lookup is: Lookup
(lookup_value, lookup_vector, [result_vector])
For example: In order to identify sales generated from order id: 56581 lookup function can be
used:
=LOOKUP(56581,B2:B8400,F2:F8400)
=1121.84
6
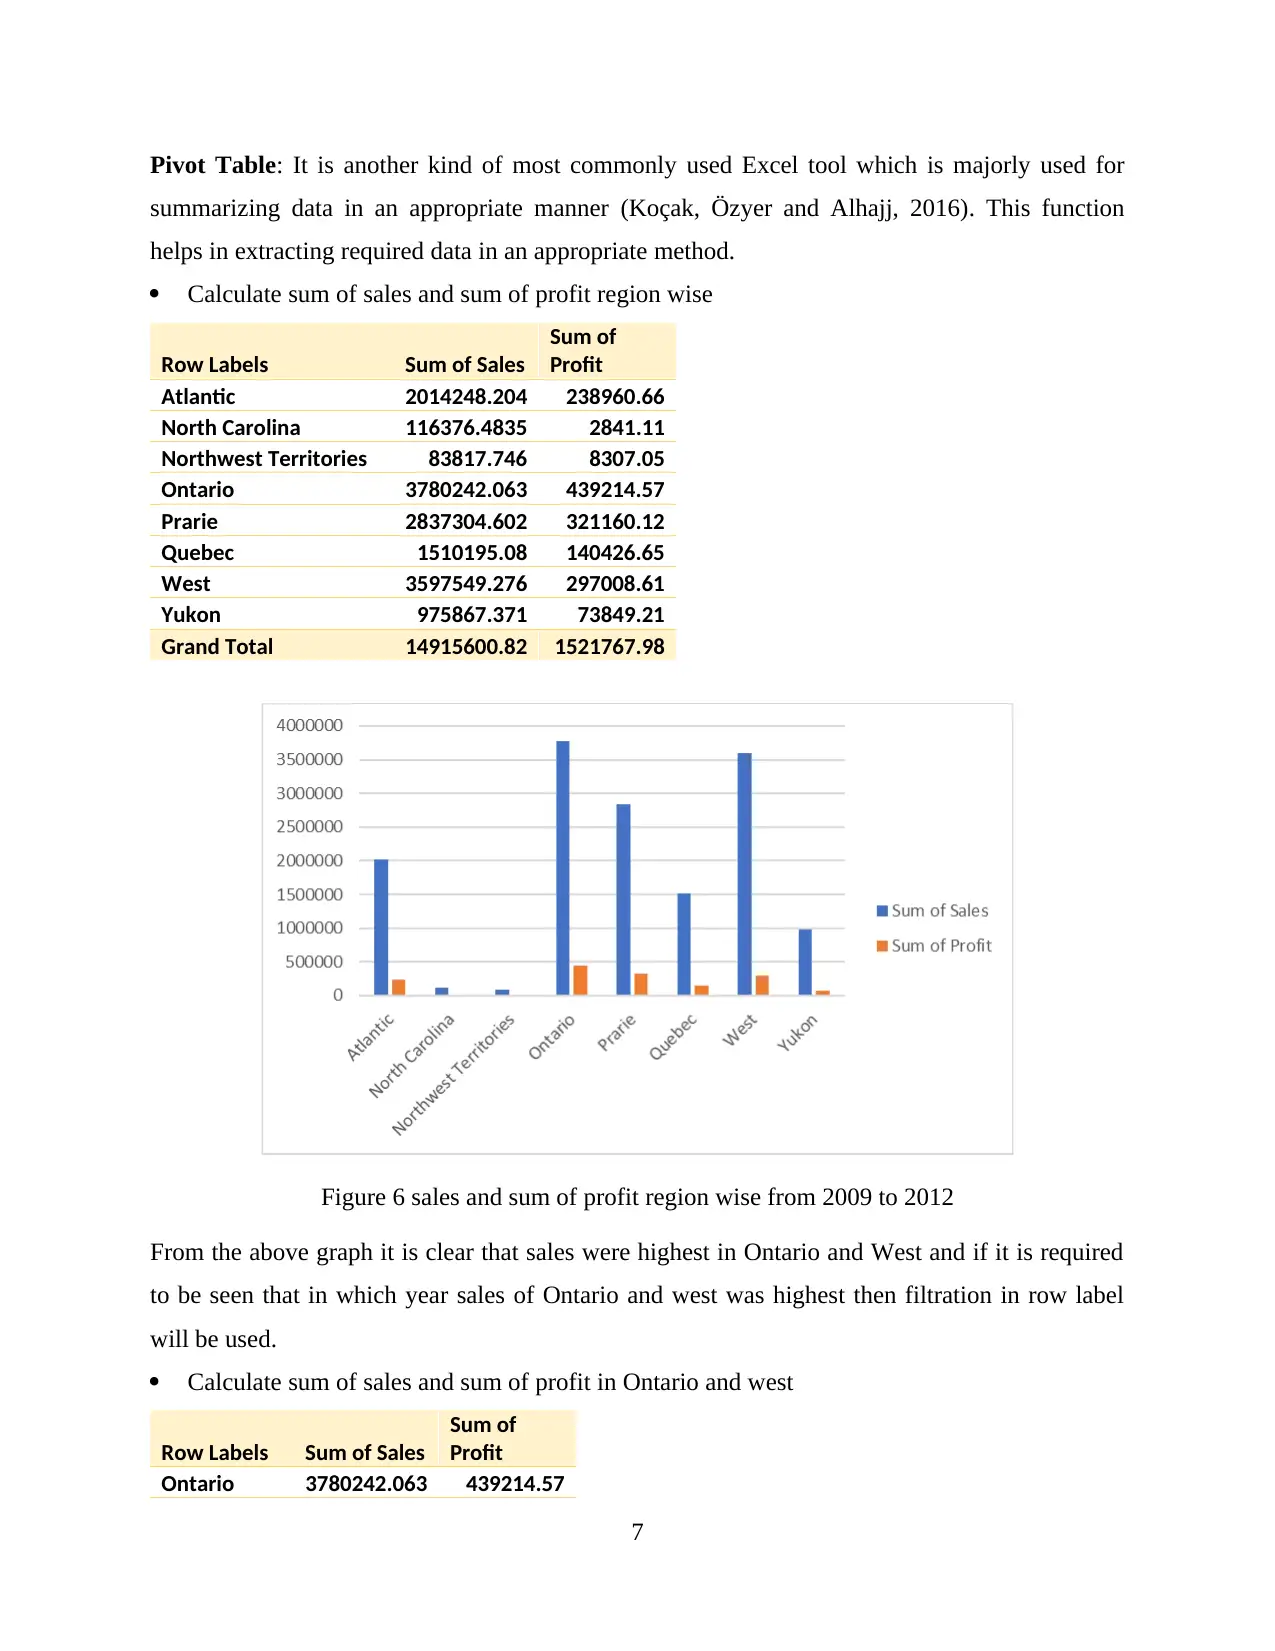
Pivot Table: It is another kind of most commonly used Excel tool which is majorly used for
summarizing data in an appropriate manner (Koçak, Özyer and Alhajj, 2016). This function
helps in extracting required data in an appropriate method.
Calculate sum of sales and sum of profit region wise
Row Labels Sum of Sales
Sum of
Profit
Atlantic 2014248.204 238960.66
North Carolina 116376.4835 2841.11
Northwest Territories 83817.746 8307.05
Ontario 3780242.063 439214.57
Prarie 2837304.602 321160.12
Quebec 1510195.08 140426.65
West 3597549.276 297008.61
Yukon 975867.371 73849.21
Grand Total 14915600.82 1521767.98
Figure 6 sales and sum of profit region wise from 2009 to 2012
From the above graph it is clear that sales were highest in Ontario and West and if it is required
to be seen that in which year sales of Ontario and west was highest then filtration in row label
will be used.
Calculate sum of sales and sum of profit in Ontario and west
Row Labels Sum of Sales
Sum of
Profit
Ontario 3780242.063 439214.57
7
⊘ This is a preview!⊘
Do you want full access?
Subscribe today to unlock all pages.
Trusted by 1+ million students worldwide
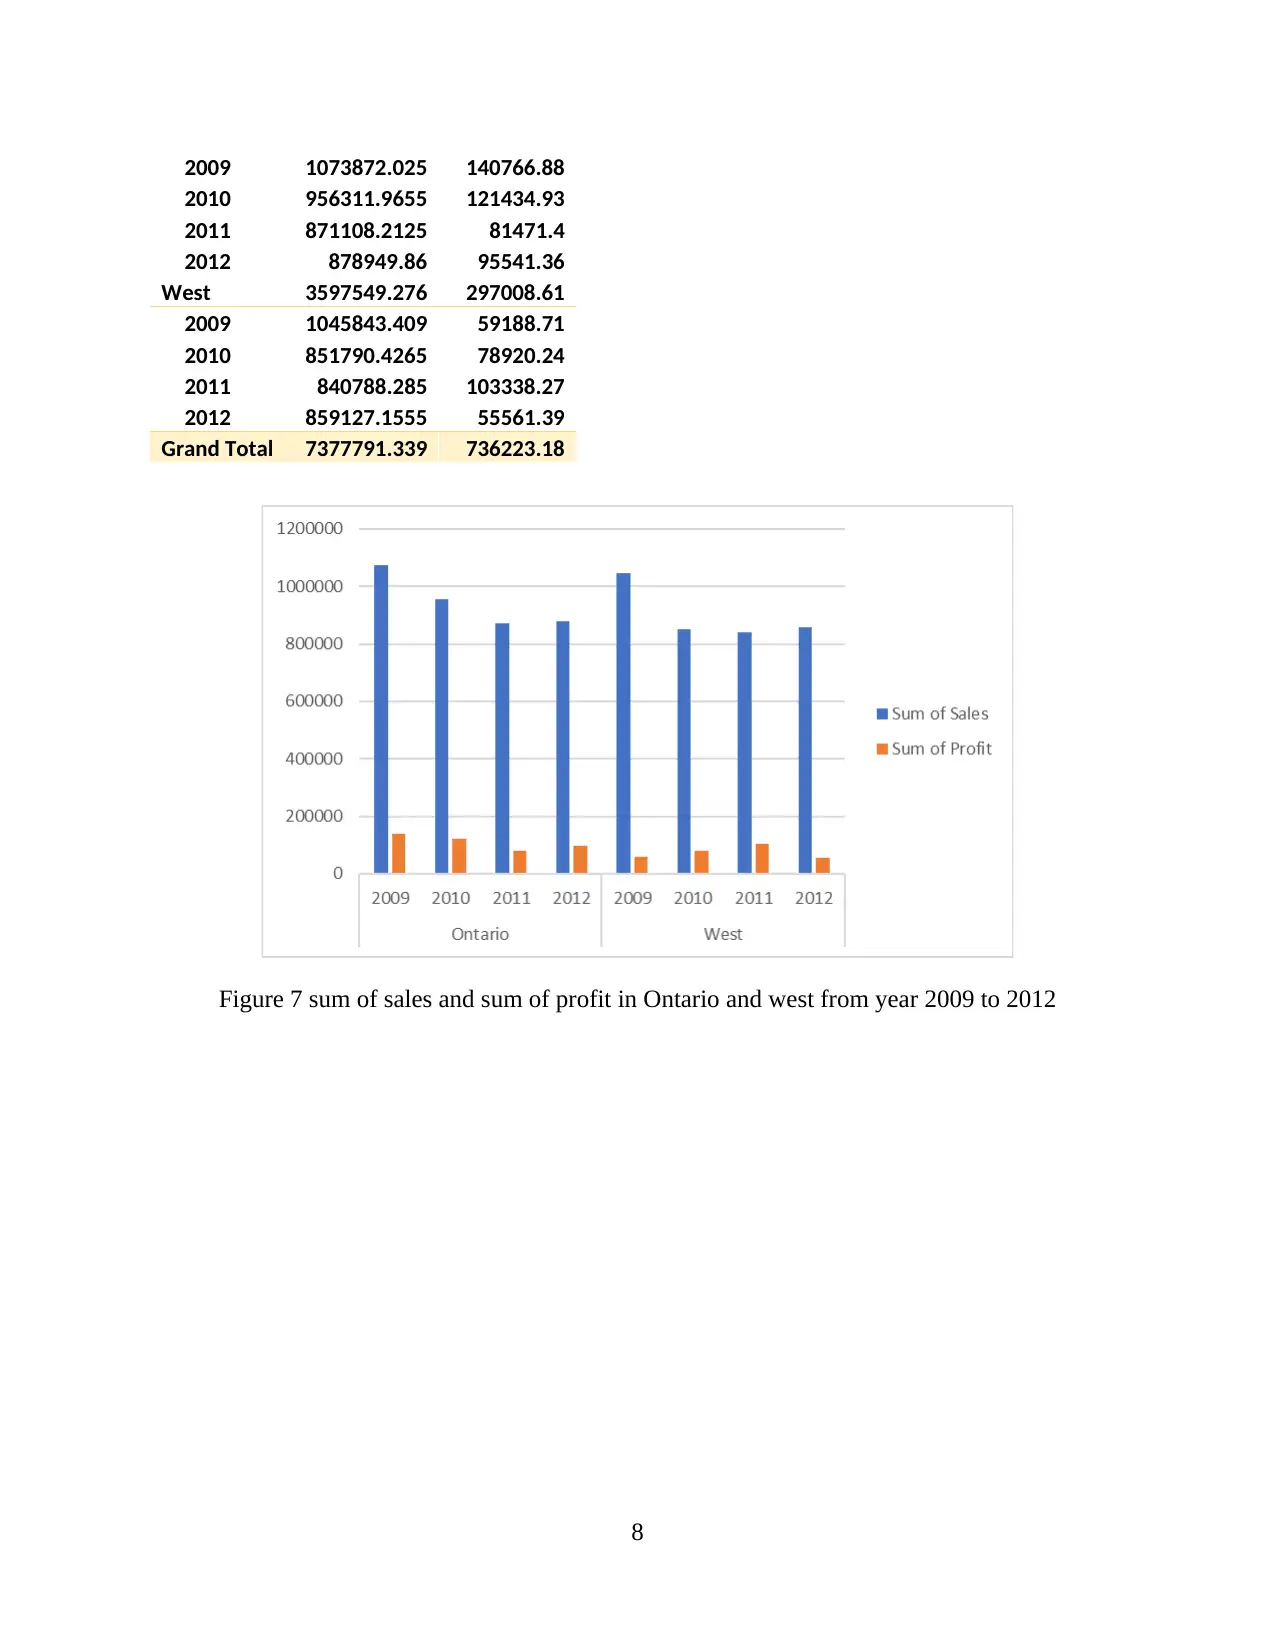
2009 1073872.025 140766.88
2010 956311.9655 121434.93
2011 871108.2125 81471.4
2012 878949.86 95541.36
West 3597549.276 297008.61
2009 1045843.409 59188.71
2010 851790.4265 78920.24
2011 840788.285 103338.27
2012 859127.1555 55561.39
Grand Total 7377791.339 736223.18
Figure 7 sum of sales and sum of profit in Ontario and west from year 2009 to 2012
8
Paraphrase This Document
Need a fresh take? Get an instant paraphrase of this document with our AI Paraphraser
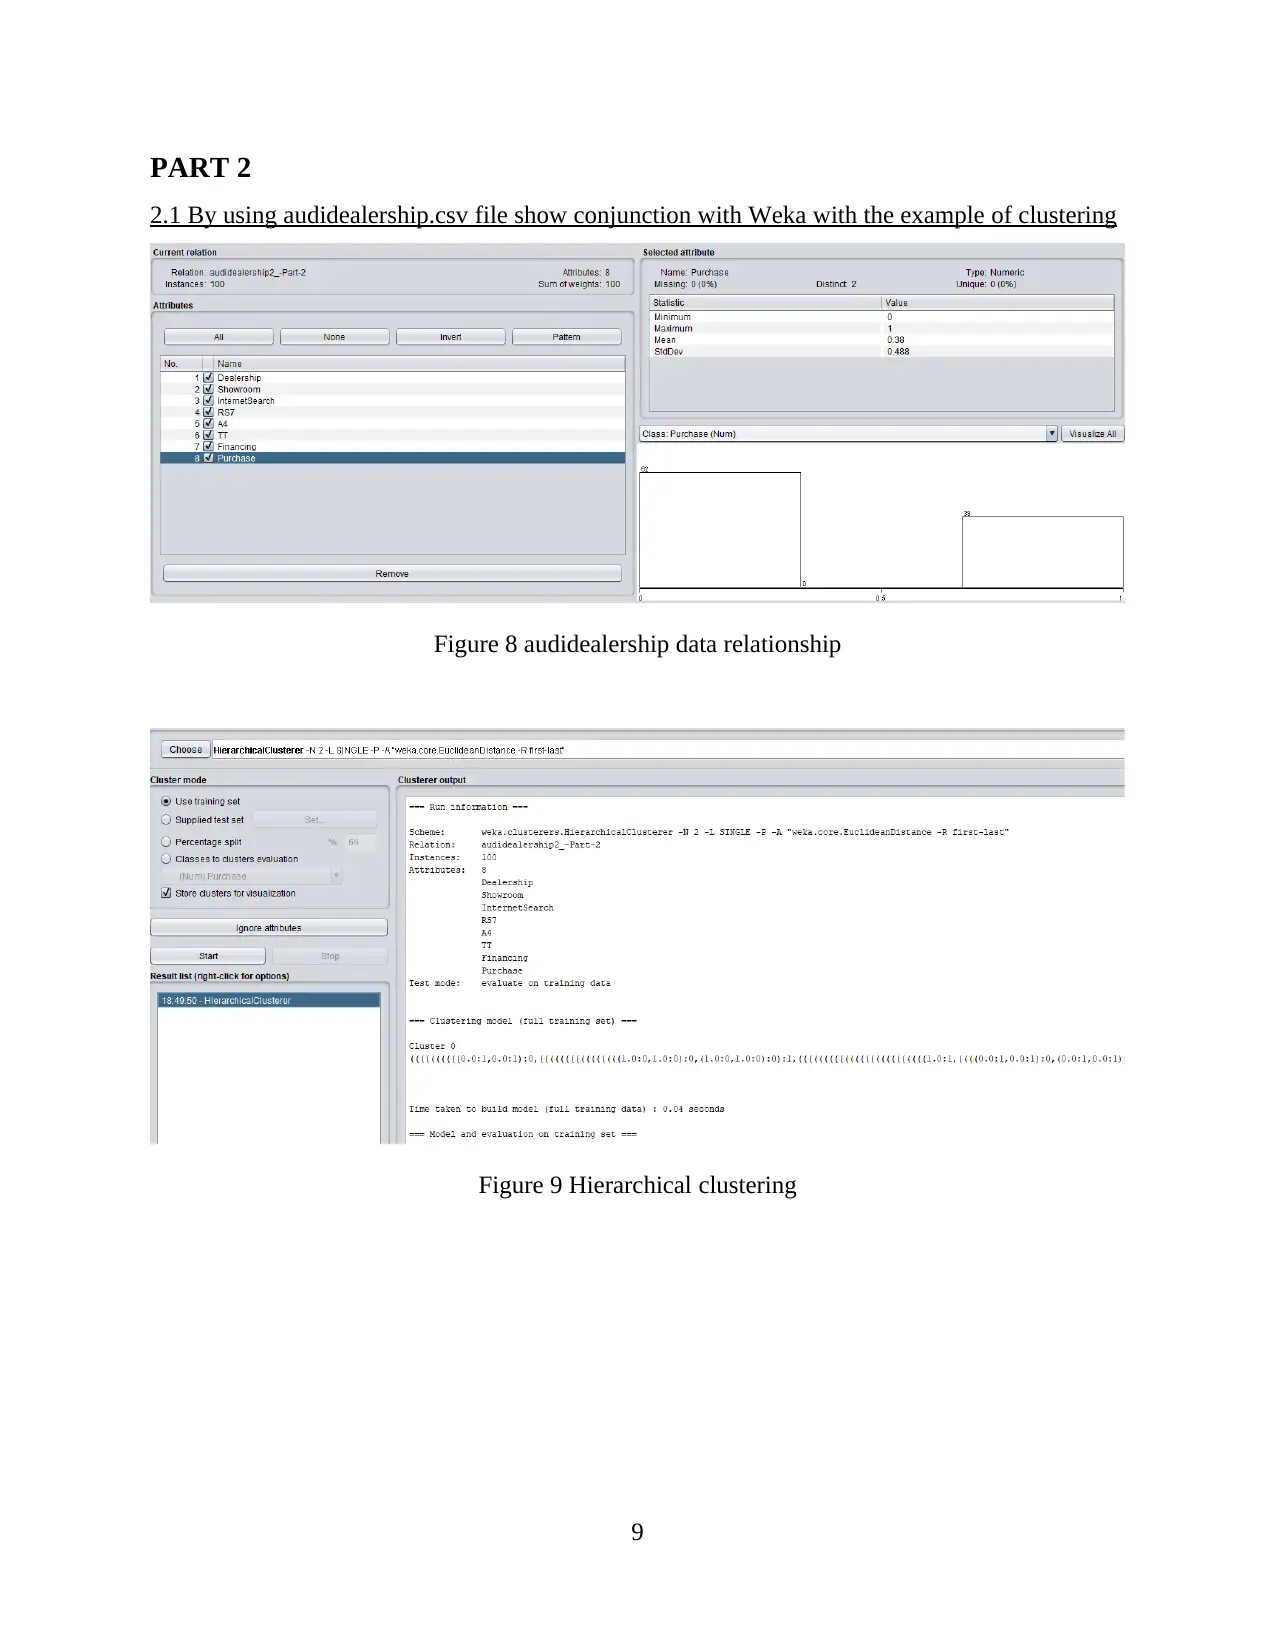
PART 2
2.1 By using audidealership.csv file show conjunction with Weka with the example of clustering
Figure 8 audidealership data relationship
Figure 9 Hierarchical clustering
9
2.1 By using audidealership.csv file show conjunction with Weka with the example of clustering
Figure 8 audidealership data relationship
Figure 9 Hierarchical clustering
9
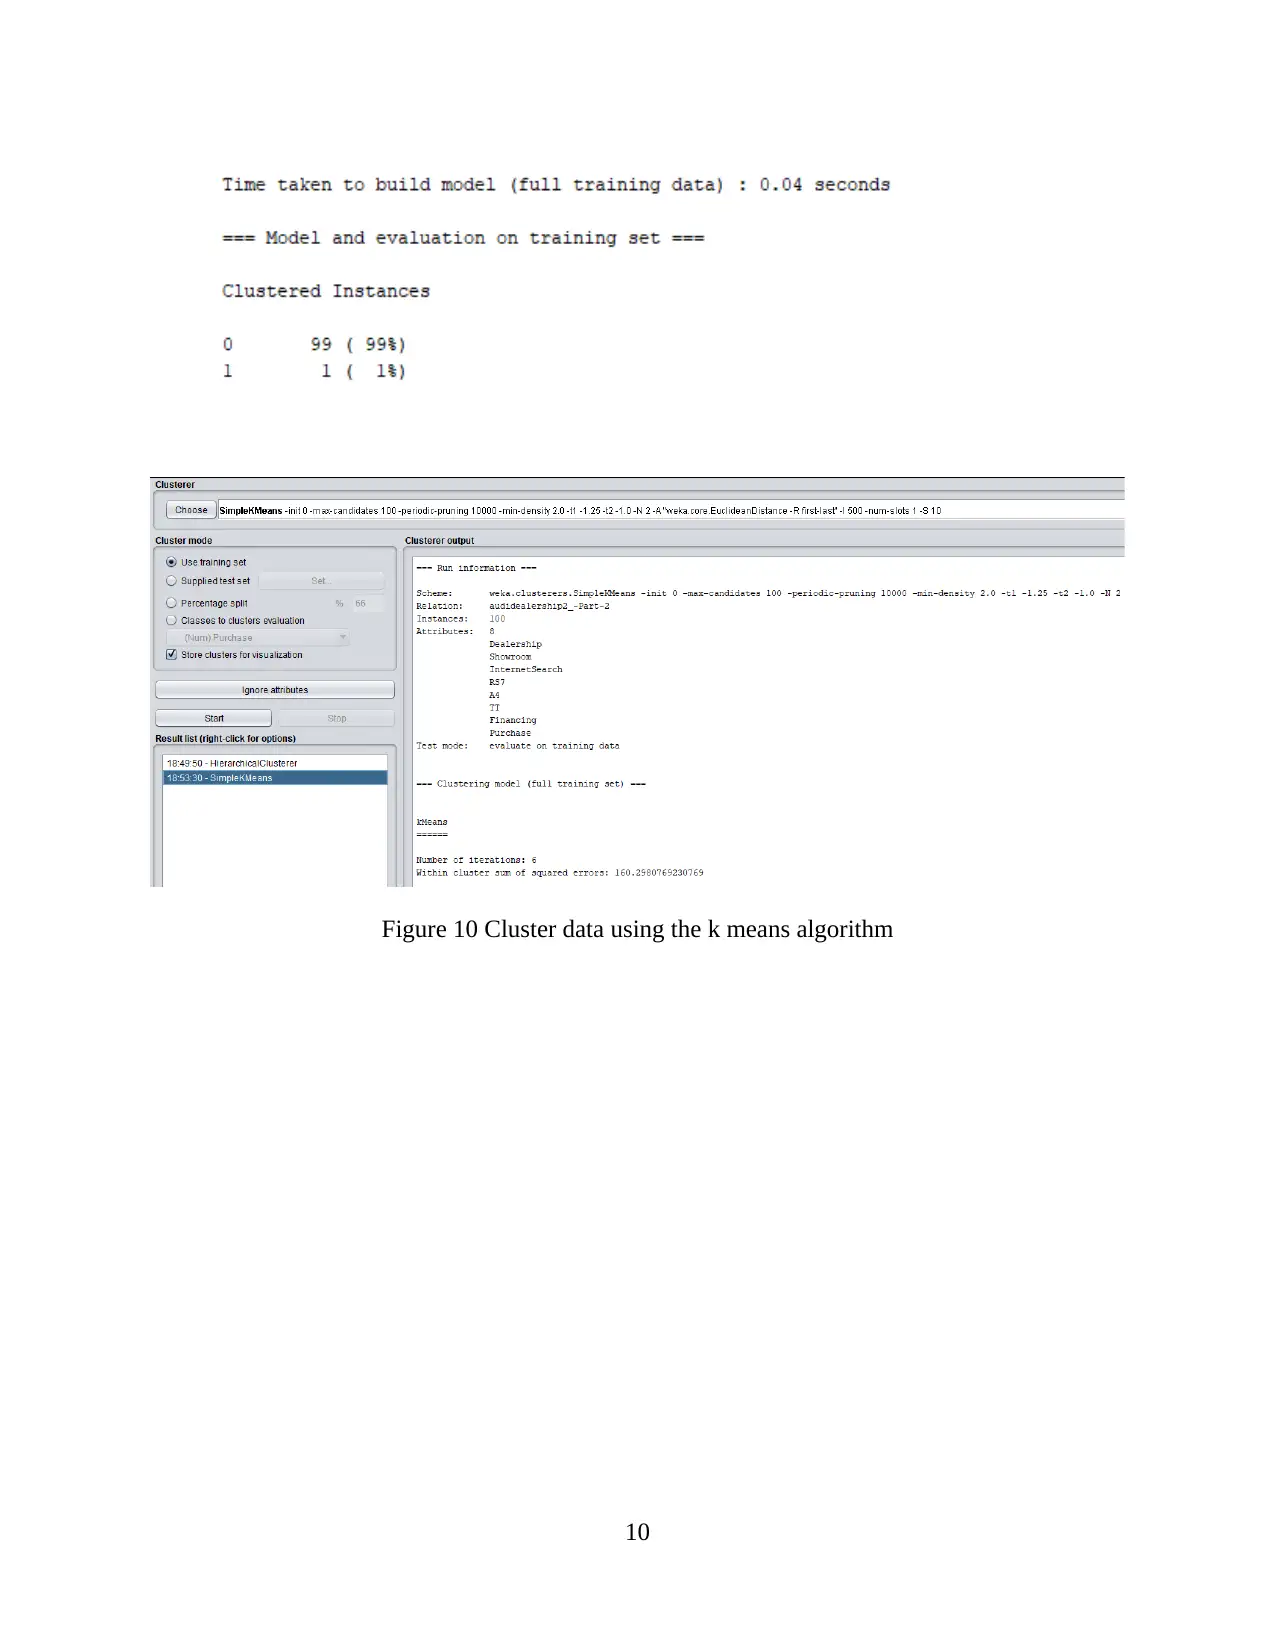
Figure 10 Cluster data using the k means algorithm
10
10
⊘ This is a preview!⊘
Do you want full access?
Subscribe today to unlock all pages.
Trusted by 1+ million students worldwide
1 out of 17
Related Documents


Your All-in-One AI-Powered Toolkit for Academic Success.
+13062052269
info@desklib.com
Available 24*7 on WhatsApp / Email
![[object Object]](/_next/static/media/star-bottom.7253800d.svg)
Unlock your academic potential
Copyright © 2020–2026 A2Z Services. All Rights Reserved. Developed and managed by ZUCOL.