The title should be between (6-8 words)
VerifiedAdded on 2019/09/22
|25
|5455
|177
Report
AI Summary
The provided content discusses various marketing and consumer behavior concepts. One ad is better for recall as it is designed to create a vivid mental image of the product, while the other ad is better for creating favorable attitudes towards the brand. The content also deals with pricing strategies, product design, and consumer preferences.
Contribute Materials
Your contribution can guide someone’s learning journey. Share your
documents today.

PART 1: Please answer any 2 of the 4 questions. Each question is worth 100 points.
1. Assume you are contemplating the launch of a new product your firm has designed. There is
pressure internally for the product to become profitable as soon as possible and you are
contemplating the use of coupons to encourage trial. You conduct a test market – you select
two cities and launch the product without coupons in one and with coupons in the other. You
are examining the data from these test markets.
a. What would you conclude about the advisability of using coupons?
Control group Coupon group
Trial rate (%) 7.5 10
Repeat rate (%) 20 10
My advice is that we should not encourage product coupons as we have less repeat rate
when compared to the coupon without group so we can conclude that we have more profit
from without coupon group when compared to the with product coupon group.
b. You have reason to believe that the coupon effectiveness could be improved because a
single coupon may generate trial but is insufficient for long term consumer behavior.
You decide to explore the role of multiple coupons. Which of the following sequence of
coupons do you think would be most effective? Why?
Plan A 40% off 40% off 40% off 40% off
Plan B 10% off 20% off 30% off 40% off
Plan C 40% off 30% off 20% off 10% off
My suggestion would be Plan C because in plan A if we give 40% consequently will be a
loss as well as further also people might expect same rebate which might be a problem
too, in plan B raising the discount rates will not be so impressive for customers and even
if company is not stable it will be difficult to follow the coffer given so I suggest plan C as
best as we provide 40% discount people will be easily attracted and it even helps in
increase in profit over the period as we are reducing the rebate offer.
Secure Best Marks with AI Grader
Need help grading? Try our AI Grader for instant feedback on your assignments.

c. Based upon your answer to b, you select a plan for the use of multiple coupons. You do
not have time for conducting another test market. So, you conduct a quick experiment
and find that of 100 participants presented with your new coupon plan, 15% try the
product at some time during the sequence of coupons. What should the repeat rate be
to make the use of coupons worthwhile?
Based upon my answer as plan C the repeat rate should be around 6% as it
reaches around 90% and we even know it is very tough to achieve 100% so the
required return rate will be 6%
d. It’s a couple of years later. The launch of your product was successful and it is a
profitable product in the line. One of your colleagues suggests a 20% off rebate
(consumers can mail in their bill and get 20% of the value of their purchase refunded)
during the holiday season to increase sales. He estimates that the rebate will increase
sales by 10%. You point out that your objective is to maximize profits rather than sales.
He suggests that the increase in sales would translate into an increase in profits. Is there
any other information you would want before making a decision on the advisability of
the proposed rebate offer?
Yes, I agree with his point that always increase in sales doesn’t mean increase in
profit for example if a product cost price (C.P) is $8 and the selling price (S.P) is
$10 but you give a rebate of 20% which means now the C.P=S.P, so there is no
increase of profit even in case of increase of sales by 10%. But we can try one
more logic that we increase the product S.P by $ 2.5 and give 20% rebate as
proposed then we will be getting a profit of $2 as usual and even our sales will
increase by 10% and obviously our profits also increase.

e. Following up on d, you commission your own study and find that your colleagues
estimate was right – the rebate does result in an increase in sales of 10%. Specifically,
you selected two markets of approximately 10,000 consumers each and ran advertising
suggesting the purchase of the product for the holidays in both markets and added the
rebate offer in one of them. In the market without the rebate offer, 5000 consumers
purchased the product. In the market with the rebate offer, 5500 consumers purchased
the product and 2000 rebates were claimed. Assuming your product costs $100 and an
equal amount is spent on advertising with or without the rebate offer and the
administrative costs of the rebate program are $ 25,000, what are the implications of
the rebate offer for profitability?
As per me there is no option for profitability only as we calculate the costs as per given
question, the product sold without rebate are 5000 if it is multiplied with 100 we get it
as 5lac and as per question it is also given that only 2000 people took rebate so there
cost price will 80* 2000 which will be 1.6lac and remaining people 3500 took for 100
which will give 3.5 lac when it is totaled it will be 10.1lac , where the revenue without
any rebate for 10000 people were going to be 10lac. But again it is said that 25000 was
spent on advertising so we have not got any profit in return we have only lost $15000.

2. Based upon scanner panel data, you have constructed the following switching matrix.
a. Evaluate the performance of the three firms A, B and C.
b. Assume you are a manager at Firm A. What is your analysis of the situation? Who is the
bigger threat, B or C? What ideas would you pursue?
Time 1
Time 2
A B C None (no
purchase)
A 4 3 3 5 15
B 5 8 0 2 15
C 5 0 12 3 20
None (no
purchase)
1 9 0 40 50
15 20 15 50 100
Paraphrase This Document
Need a fresh take? Get an instant paraphrase of this document with our AI Paraphraser

c. Assume that after time 2, you instituted two programs. The first was a loyalty program
and the second was a program to convert non-users into users of your product. You
track the scanner panel data and at time 3, you construct a new switching matrix.
Evaluate the two programs and make your recommendations for them.
d. Take stock of the situation now after your answer to c above. What ideas would you
pursue?
Time 2
Time 3
A B C None
A 12 1 1 1 15
B 4 10 3 3 20
C 4 0 10 1 15
None 0 9 6 35 50
20 20 20 40 100

3. Answer the following questions based on the following survey results for soft drinks. These
results identify the salient product attributes and how consumers rate various brands on these
attributes. Assume that e, I and b were measured on 7-point scales ranging from 1 to 7. To receive
full credit, please show all of your work.
_______________________________________
Value (ei) Ideal level (I) Brand Beliefs (bi)
Attribute A B C D
______ ____________________________________________________
High Carbonation 6 7 2 6 4 7
Quenches Thirst 7 5 6 6 7 5
Low Price 5 4 7 7 7 7
Strong Taste 2 4 5 5 7 1
a. Using the ideal point multi-attribute formulation, compute below the total attitude score for each
brand and state which brand is most liked.
Brand Score
A
B
C
D
b. What is the best score a brand could receive?

_______________________________________
Value (ei) Ideal level (I) Brand Beliefs (bi)
Attribute A B C D
______ ____________________________________________________
High Carbonation 6 7 2 6 4 7
Quenches Thirst 7 5 6 6 7 5
Low Price 5 4 7 7 7 7
Strong Taste 2 4 5 5 7 1
c. One way brand A might consider trying to improve consumers' attitudes towards its brands is to
change the value consumers attach to the attributes. For each attribute, indicate those changes in the value
scores that would maximize attitudes toward brand A (ignoring how this might affect attitudes towards
competitive brands). If you believe that a change is unnecessary, then write "No Change" in the appropriate
space.
Attribute Desired Value Score
High Carbonation
Quenches Thirst
Low Price
Strong Taste
d. An alternative strategy for Brand A is to consider changing consumers' beliefs about its
brand. Now, identify those changes in the belief scores that would maximize attitude toward brand
A. Again, write "No Change" if you believe a change for a given attribute is unnecessary.
Attribute Desired Belief Score
High Carbonation
Quenches Thirst
Low Price
Strong Taste
Secure Best Marks with AI Grader
Need help grading? Try our AI Grader for instant feedback on your assignments.

e. In your answers to parts c and d, you identified multiple attitude change strategies. Next,
identify which single change would result in the greatest improvement in attitudes toward brand A relative
to its competitors. Be sure to clearly indicate whether you are proposing a change in attribute value or a
change in brand belief. Justify your answer.
4. You have collected consumer ratings of all relevant brands of shampoo in the market on various
attributes of interest for one consumer segment. The various attributes are as follows.
a. Smells nice
b. Hair feels silky
c. Hair feels luxurious
d. Removes oils from hair

e. Removes odors from hair
f. Leaves hair feeling clean
g. Prevents split ends
h. Moisturizes hair
i. High tech
j. Organic
k. No harsh chemicals
l. Natural ingredients
This has allowed you to generate a matrix of (m brands) X (n attributes). You submit this matrix
to a statistical software program for factor analysis and the following output is presented to you.
Please interpret the underlying dimensions.
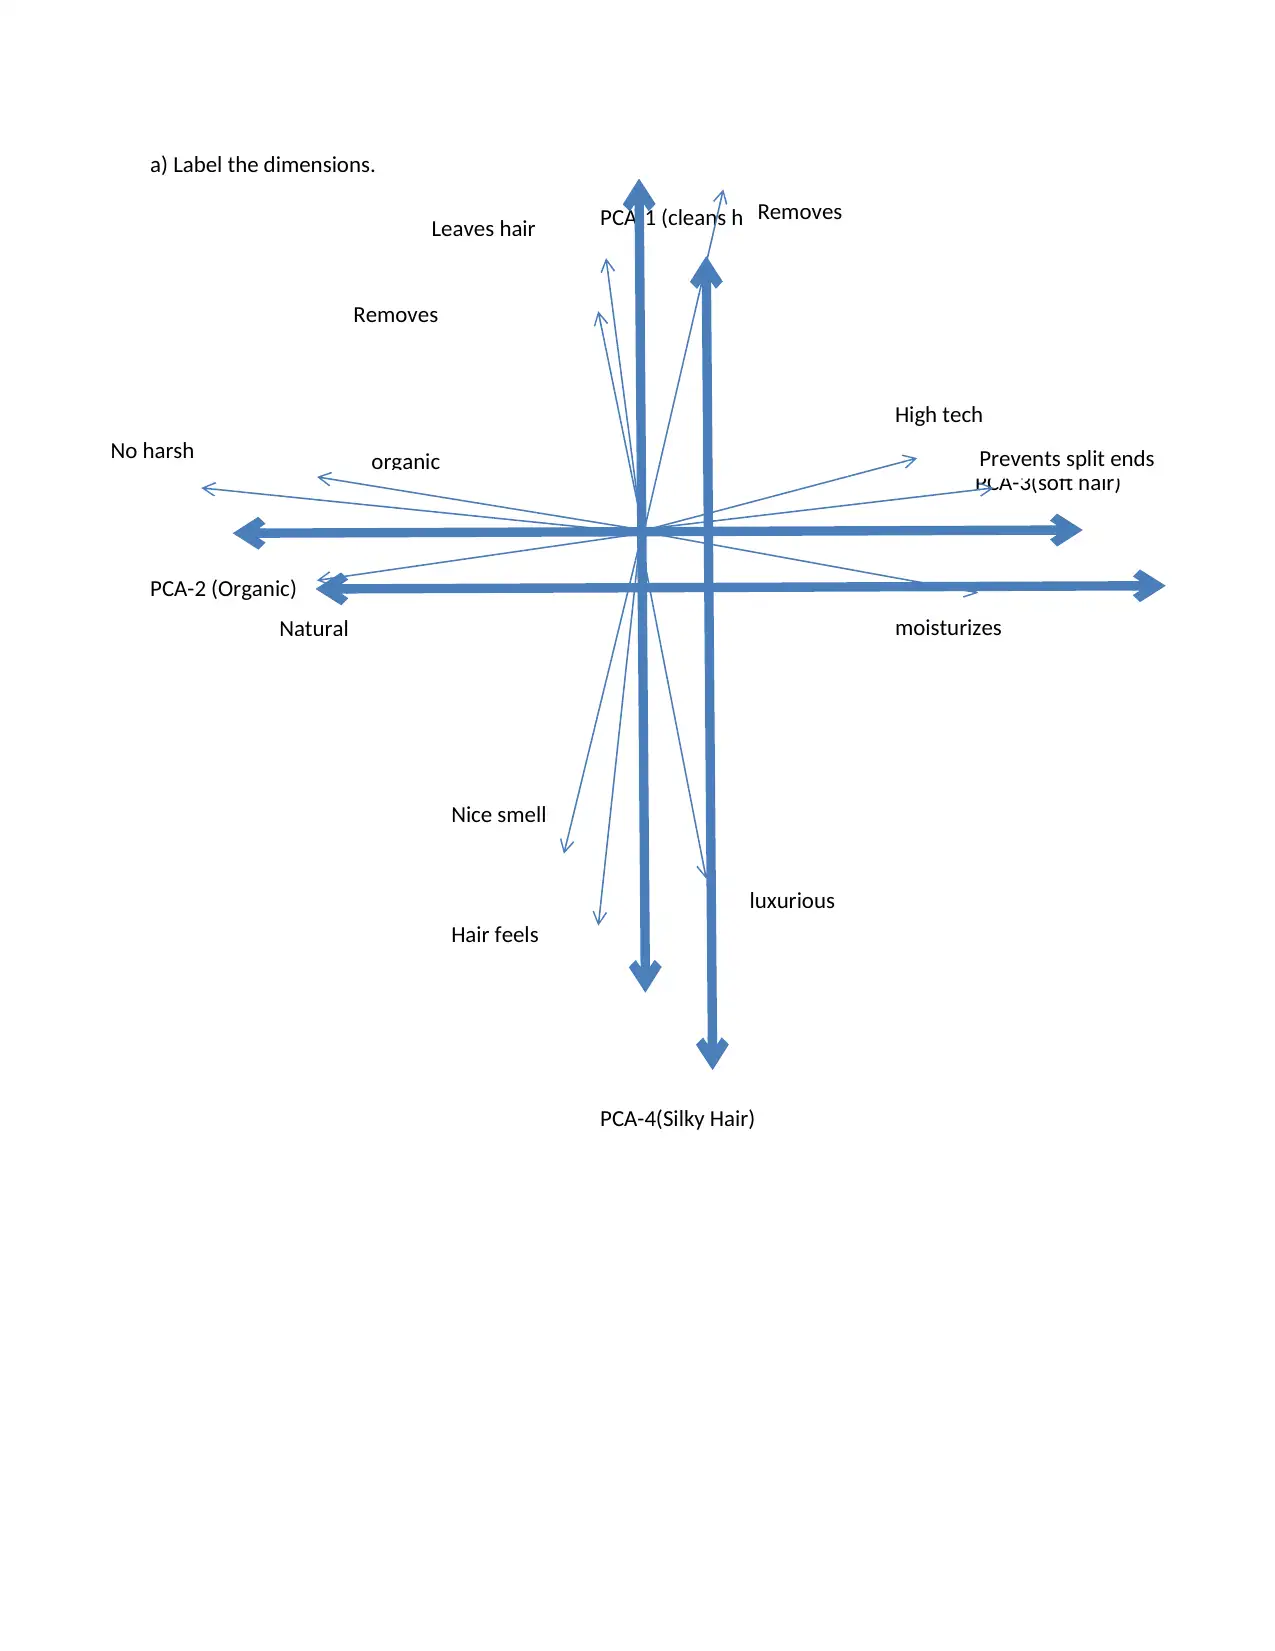
a) Label the dimensions.
PCA-1 (cleans hair)
PCA-3(soft hair)
PCA-2 (Organic)
PCA-4(Silky Hair)
luxurious
Nice smell
Hair feels
silky
High tech
Prevents split ends
moisturizesNatural
No harsh
chemicals organic
Removes
Leaves hair
Removes
PCA-1 (cleans hair)
PCA-3(soft hair)
PCA-2 (Organic)
PCA-4(Silky Hair)
luxurious
Nice smell
Hair feels
silky
High tech
Prevents split ends
moisturizesNatural
No harsh
chemicals organic
Removes
Leaves hair
Removes
Paraphrase This Document
Need a fresh take? Get an instant paraphrase of this document with our AI Paraphraser

b) You then proceed to plot the positions of various brands in this perceptual space. Please answer the
following questions using the space on the following page. Please provide your reasoning for the
answers.
a) If you were brand A, who would you consider your biggest competitors?
b) If you wanted a more distinct positioning for brand A (i.e., distinguish brand A from its competitors),
what actions would you take based on this perceptual map?
c) If you were to launch a new brand of shampoo, what sort of shampoo would you design? Why?
I
A
H
G
F
E
D
C
B

a) If I’m brand A I would consider my competitors as brand H as it is plotted more
towards positive x axis and y axis too, then the next competitor is B as it is plotted
more towards positive x axis and y axis too, next will be the competitor C as it.
b) If we want more distinct position for brand A then we should increase the sales which
in turn increases the profit with proper business logic and here I have taken the x axis
as sales versus y axis as profit.
c) If we are going to launch a new brand of product we would design a shampoo which
reduces hair fall as nowadays lots of people are suffering from hair fall due to many
factors like pollution and many more so through that we can improve the product
quality and the sales which in turn leads to profit.

PART 2 – Please answer 4 out of the 8 questions. Each question is worth 100 points.
1. Suppose you have received the results from two studies testing the same pair of ads. One ad (Ad
A) attempts to create favorable attitudes by pairing the product with an attractive celebrity. The
other ad (Ad B) attempts to create favorable attitudes by describing the brand's performance
along several important attributes. Ad A produced the most favorable attitudes in one study,
while Ad B yielded the most favorable attitudes in the other study. How can you explain this
inconsistency?
Here the inconsistency is explained through the people attitude towards the
attractive celebrity or the brands performance. For example if a product is
taken by children or any middle aged people they think very less about the
brand performance or the quality they are just attracted by the celebrity like
kids like a bag if it is with some super hero than a good quality brand, and its
vice versa with the matured or people who think or consider more about the
quality or brand performances, due to this there is a inconsistency from both
the studies.
Secure Best Marks with AI Grader
Need help grading? Try our AI Grader for instant feedback on your assignments.

2. A recent study for a company that sprays consumers' households each month to eliminate insects
and pests has reported that, although customer satisfaction with the company's total service (i.e.,
all aspects of the company and its service) has increased for the third straight year, cancellation
rates (i.e., the percentage of the company's customer base that discontinues the spray service)
have also increased for the third straight year.
The study also points out that price increases do not represent a possible explanation for
cancellation rates, since the company's prices have not changed over the past four years. Further,
the possibility that these increases in cancellation rates were caused by customers no longer
needing the service was explored, but not substantiated.
How can you explain the increases in both satisfaction and cancellation rates over the past three
years?
Here it is
stated that
increase
customer
satisfaction
is going
hand in
hand with
the
with
increase in
cancellation

3. You have recently launched a brand of chocolate snack bar. This is a very competitive category
with many brands and variants. Prior research has suggested that the attributes consumers care
about are (in decreasing order of importance) healthiness of the snack bar (number of calories),
taste, natural ingredients and price. There are many brands on the market and they vary with regards
to their performance on these attributes. Your specific brand is not particularly healthy but in product
tests was rated as very tasty, and utilizes all-natural ingredients and is very competitively priced. You
face a peculiar quandary. When conducting product tests, consumers evaluated your brand very
favorably. However, sales have been extremely poor. Qualitative research has suggested consumers
do not have very strong preferences. This is also a crowded market with many players but the
qualitative data suggests that consumers consider only 2 or 3 brands on average. Quantitative data
comparing the brand with other brands reveals a very favorable disposition towards the brand, and
when asked if they would choose the brand, a large number of consumers respond favorably.
However, the brand does not appear on consumer consideration lists.
a. Why would the brand be favorably evaluated when examined in detail in a product
testing setting but not be considered?
b. What potential solutions seem worthy of further exploration?

4. Consider a recent print ad for the Chrysler Cirrus automobile, which featured the following copy:
"A car.
With something called rail-through construction.
which stiffens the body,
which quiets the cabin,
which makes it the sanctuary that lets you forget
(your doubts, your insecurities),
and allows you to think,
and the thought is the same
as yesterday,
as it was the day before:
Tomorrow …
I find a longer way home."
Explain how these commercial employs means-end chaining. In doing so, be sure to identify each
element in the means-end chain in terms of the example provided here.
Basically, mean end chain theory is to mask the consumers mind by telling extraordinary words
through which the persons mind is convinced to buy that product and make him feel that’s the
best product available in the whole market.
Here the mean end chain terms in the provided example are as follows:
Rail through construction which means it’s the best build quality.
Stiffens the body which means while driving it gives the best sitting posture so no worry
about back pain and many more.
Quite cabin which means it helps us to give a silent and a peaceful drive as there is no
disturbances from outside factors.
Sanctuary that lets you forget which means we can drive with sure that we reach home
very safely.
Paraphrase This Document
Need a fresh take? Get an instant paraphrase of this document with our AI Paraphraser

5. You are interested in tracking the effectiveness of an advertising campaign that has been launched
for your brand. The estimated size of your target segment is 100,000 consumers. Your media plan is
estimated to reach 80,000 of these consumers. Initial copy testing had revealed that the ads were
quite effective at gaining attention – the percentage of consumers who noticed the ad and paid
attention to it in controlled tests was 80%. Copy tests however also revealed some scope for
confusion – the percentage of consumers who understood and comprehended the key argument in the
advertisement was 20%. Among those who did understand the ad, acceptance of the message was
uniformly high and stood at 80%. Recall of the key argument after 1 week remained high – post
launch quantitative surveys revealed that after 1 week, the key argument was remembered by 100%
of those consumers who accepted the ad message.
a) What is the effectiveness of the campaign, expressed as the probability of remembering the
key argument in the ad?
b) If sales are a function of the ad campaign effectiveness such that every one of the consumers
who remember the key argument purchases your brand twice in the coming month, what
would your sales forecasts for the next month be?
c) Based on the above data, if you had to change one thing about your campaign, would you

change the advertisement or the media plan? What change would you recommend? Why?
6. Consider the situation in which a company is trying to decide which of two alternative print ads
should be adopted for the advertising campaign which will be used during the market introduction
phase for a new ice cream product called "Snowball" that will be sold in supermarkets. The only
difference between the two ads is the type of picture which appears at the top of the ad. The picture
for Ad 1 shows the product sitting on top of snow and surrounded by a mound of snowballs. The
picture for Ad 2 shows an attractive model consuming the product.
To help decide which ad should be used, a study was undertaken in which target consumers were
exposed to either Ad 1 or Ad 2. (Assume that the method used to expose consumers to the ad was
both valid and realistic.) The results indicated that Ad 1 produced greater brand name recall, but Ad
2 generated more favorable attitudes for the brand.
m. Given these results, which ad would you recommend be used in the campaign for
introducing the product to the market. Why?
n. Also, how can you explain that one ad is better for recall, while the other ad is better for
creating favorable attitudes?
Here I go with the Ad 2 as it has more favourable attitude toward the brand which
means they are also interested in the product so which helps in getting grater profit
and as the time rolls on with higher favourable attitude towards the brand it will
obviously becomes the greater brand name.

1 ad is
better for
recall as it is
designed
that like the
ice cream is
placed in
between
the snow
which
better for
recall as it is
designed
that like the
ice cream is
placed in
between
the snow
which
Secure Best Marks with AI Grader
Need help grading? Try our AI Grader for instant feedback on your assignments.

7. Your firm markets a brand of beer. A six-pack of the beer (each bottle contains 750ml of beer)
sells at regular price for $12. Due to certain supply side logistics, you are currently carrying an
excess inventory of 10,000 units (each unit is a 6 pack) and need to liquidate this inventory
rapidly to reduce inventory-carrying costs. You therefore decide to run a price discount to
stimulate purchase of the beer. Previous research had indicated that the Weber’s constant for
price perceptions in this market was 10%.
a. What is the minimum amount by which you would have to reduce price for the price
reduction to be noticed by consumers and move them to action?
b. Once the inventory has been cleared, you take stock of the situation – the price discount
made you lose a certain amount of profits (the amount of discount X 10,000 units). In
order to recover this, you decide to reduce the amount of beer in each bottle as a cost
cutting measure. You are, however, worried about, and would like to minimize any loss
of sales, from such an action. Previous research had indicated that the Weber’s constant
for product volume perceptions was 1750%. How much can you decrease the volume by
before consumers would notice?
c. If each ml of beer costs you $ 0.002, how many six-packs do you need to sell with the
reduced volume to recover the profits lost during the price-discounted sales?
8. You are interested in consumer perceptions regarding how important they consider different
attributes of a headphone to be. You run a conjoint study asking people to rank order their
preferences between headphones made to vary on the following attributes:
a. Backing material (metal vs. wood)
b. Connection (wired vs. wireless)
c. Around ear cushion (padded leather vs. memory foam)
d. Sound EQ (bass heavy vs. neutral)
The results of the survey were submitted to a regression analysis where the preference was treated
as a dependent variable and the four attributes were treated as independent variables with the first
level (e.g., metal backing material, wired connection) coded as -1 and the second coded as +1.
The regression equation took the form:
Preference = 1.5 + 1.5 * backing material + 1 * connection – 2.5 * around ear cushion + 2 *
sound EQ
a) How much variance in preference is explained by each of the attributes?
b) Which is the most important attribute in determining consumers’ preferences?
c) If you wanted to design a product that would elicit the greatest performance, what attributes
would it have?
e.

Part 3 – Please answer two of the following 4 questions. Each is worth 100 points.
1. The other day, I purchased different brands of beer, poured 150 ml of each brand into a glass,
and added 2 grams of salt. I then waited 15 seconds and took a photograph of the glass. The
glass was then rinsed and the process repeated for every brand of beer. When the photographs
were developed, I counted the number of bubbles in each photograph. The results can be found
in an Excel file named ‘bubblybeer.xls’. Please analyze the data in this dataset to answer the
following questions. Does the brand of beer make a difference to the number of bubbles? Is
there any pattern you can find to any differences, if any, that you do find?
Yes, the brand of beer make a difference to the number of bubbles. While the actual bubble
activity of beer depends on the presence of Salt, it is the surface-active materials like
amphipathic polypeptides from malt that determine size, shape and length of the Bubble.Beer
Bubble consists of polypeptides of five different classifications, divided by their
relative hydrophobicity. As the hydrophobicity of the polypeptide groups increases, so does the
stability of the Bubbles.
Carbonation occurs when Salt sodium chloride is dissolved in water or an aqueous solution. This
process is generally represented by the following reaction, where water and gaseous carbon
dioxide react to form a dilute solution of carbonic acid. One mechanism of destabilization of a
beer bubble is due to gravitational drainage. The water or liquid between the bubbles will drain
and cause the liquid and gas phases to separate. This allows for the bubbles to become close
enough to merge. This can be slowed down by increasing the viscosity of the liquid. Another
mechanism of destabilization is Ostwald ripening. Gas will diffuse from smaller bubbles to
larger bubbles due to the high pressure associated with smaller bubbles. This can be explained
by Laplace pressure. This can be slowed by a low solubility of the gas. An example of this is
adding Nitrogen to the beer. A large effect can be seen with only a 20ppm addition of nitrogen
gas.
Paraphrase This Document
Need a fresh take? Get an instant paraphrase of this document with our AI Paraphraser

1 5 9 13 17 21 25 29 33 37 41 45 49 53 57 61 65 69 73 77 81 85 89 93 97 101 105 109 113 117
0
5
10
15
20
25
30
35
1111122222333334444455555666667777788888
1111122222333334444455555666667777788888
1111122222333334444455555666667777788888
f(x) = 0.0218765192027224 x + 3.17647058823529
R² = 0.109382596013612
f(x) = 0.00166678241544552 x + 1.89915966386555
R² = 0.00166678241544582
f(x) = 0.00062851586915758 x + 18.3203081232493
R² = 1.36026400217037E-05
Pattren Identification
beer Linear (beer) salt Linear (salt)
bubs Linear (bubs) Linear (bubs)
By this plot we can see the pattern between beer, salt and bubs. This pattern show the Molson
beer brand produce more bubbles then others beer brand. Quantity of salt effect on the bubbles
and for every beer bubbles are different. R^2 value is 0.0038
0 1 2 3 4 5 6 7 8 9
0
5
10
15
20
25
30
35
f(x) = 0.157936507936508 x + 17.6476190476191
R² = 0.00375806242989896
Pattern Identification of bubs
0
5
10
15
20
25
30
35
1111122222333334444455555666667777788888
1111122222333334444455555666667777788888
1111122222333334444455555666667777788888
f(x) = 0.0218765192027224 x + 3.17647058823529
R² = 0.109382596013612
f(x) = 0.00166678241544552 x + 1.89915966386555
R² = 0.00166678241544582
f(x) = 0.00062851586915758 x + 18.3203081232493
R² = 1.36026400217037E-05
Pattren Identification
beer Linear (beer) salt Linear (salt)
bubs Linear (bubs) Linear (bubs)
By this plot we can see the pattern between beer, salt and bubs. This pattern show the Molson
beer brand produce more bubbles then others beer brand. Quantity of salt effect on the bubbles
and for every beer bubbles are different. R^2 value is 0.0038
0 1 2 3 4 5 6 7 8 9
0
5
10
15
20
25
30
35
f(x) = 0.157936507936508 x + 17.6476190476191
R² = 0.00375806242989896
Pattern Identification of bubs

2. The dataset named ‘hemi.xls’ contains the data from a field experiment where advertising was
run on either the left hand page (coded as side=1) or right hand page (coded as side=2) in either
a quarter-page, half-page or full page ad sizes. Purchase intention data was also collected. What
conclusions could you reach from these data?
3. The dataset named ‘cluster analysis.xls’ contains data about consumers visiting a mall. Their
perceptions about shopping are recorded using variables V1-V7. They also provided their annual
income (USD) and the number of times they visited the mall. Use the variables V1-V7 and
conduct a cluster analysis to identify any segments in the data. Profile the segments based upon
their income and/or number of mall visits. Report the results of this analysis.
We have done the K-means, clustering analysis in excel we have
considered the value for K as 2,3,4, and 5 were the 2 means cluster
gave the best results as we consider inter distance sum of square value
to decide which is value of K gives best output and as we analyze the
cluster we found the cluster 2 people we having good income and had
made a more number of mall visits cluster 1 has 16 data points and
cluster has 24 data points so its clear that cluster 2 people make more
number of visits when compare to cluster 1 people.
4. The dataset ‘conjoint coffeemaker’ has the data from a conjoint study designed to aid in the
product design decision for a new coffeemaker being designed by your firm. The variables you
are trying to decide upon are capacity (4 vs. 10 cups), brew time (3 vs. 12 minutes), color (black
vs. red) and the auto feature (present vs. not). What do the results of the conjoint analysis tell you
about consumer preference for the various attributes of interest? What would be your
recommendation about the final design?
For extra credit, spell DJ’s last name (just kidding …).
Have a good holiday!

1 out of 25


Your All-in-One AI-Powered Toolkit for Academic Success.
+13062052269
info@desklib.com
Available 24*7 on WhatsApp / Email
![[object Object]](/_next/static/media/star-bottom.7253800d.svg)
Unlock your academic potential
© 2024 | Zucol Services PVT LTD | All rights reserved.