Pearson Correlation, Hypothesis Testing, and Statistical Significance
VerifiedAdded on 2023/06/04
|8
|1598
|497
Homework Assignment
AI Summary
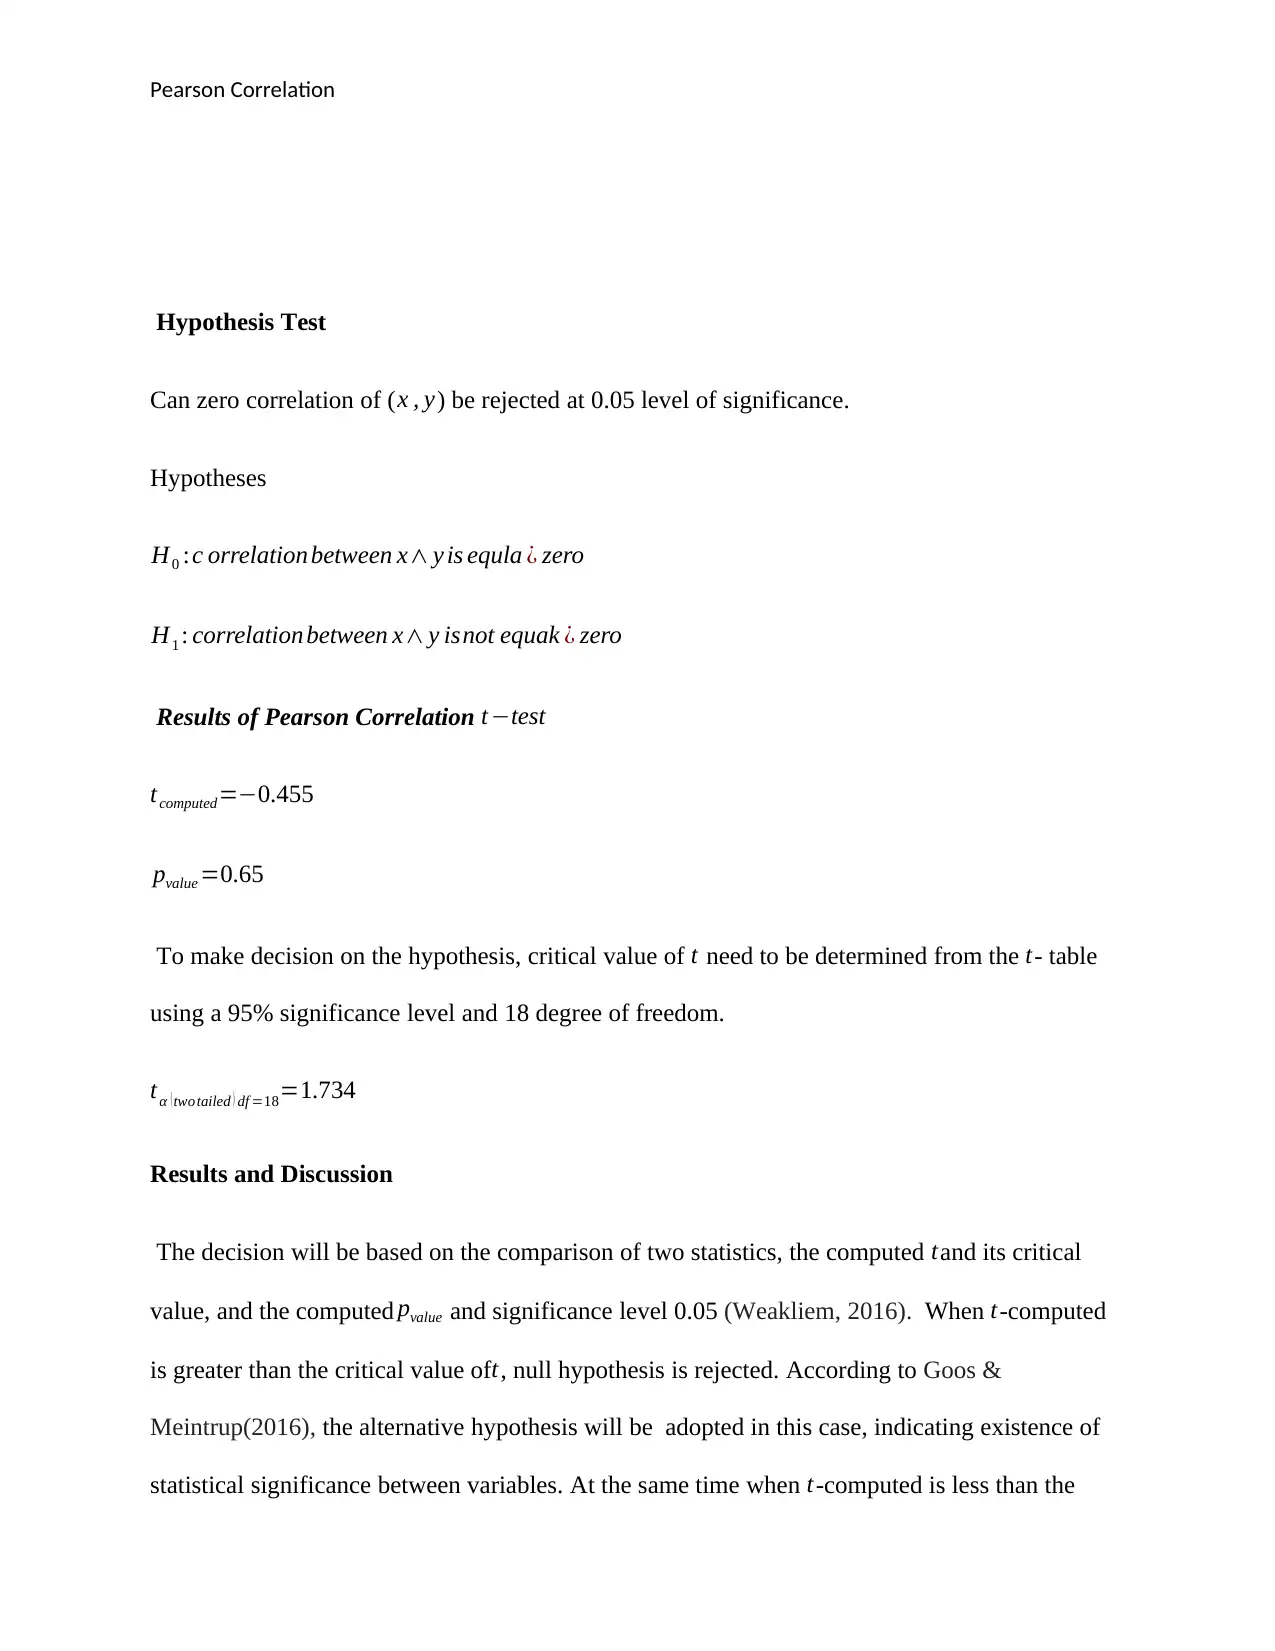
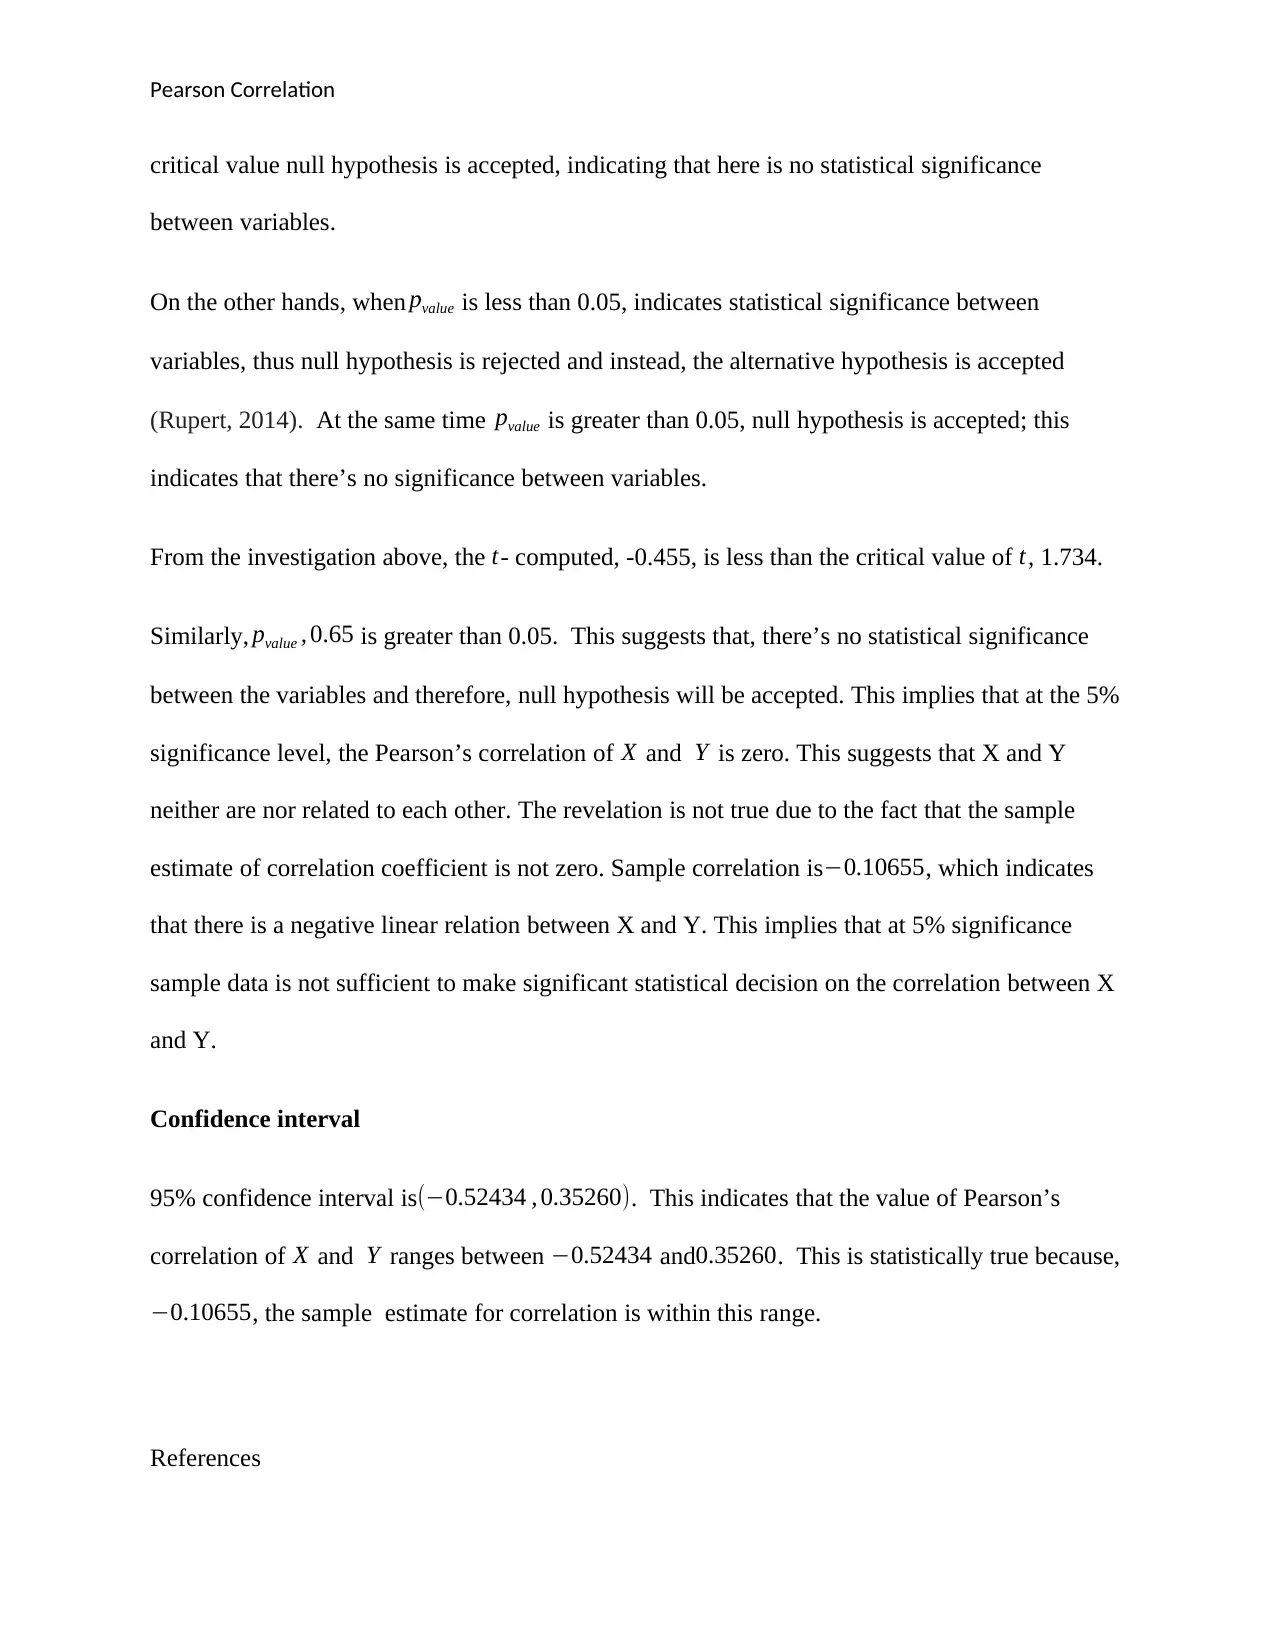
This assignment provides a detailed analysis of Pearson correlation, focusing on its application in quantitative reasoning. It explains the meaning of key statistical output items such as t-statistic, degrees of freedom, p-value, alternative hypothesis, confidence intervals, and sample estimates. The assignment includes a hypothesis test to determine if a zero correlation between two variables can be rejected at a 0.05 significance level, discussing the decision-making process based on the comparison of computed t-values and critical values, as well as p-values and significance levels. The results and discussions section interprets a sample correlation coefficient of -0.10655, indicating a weak negative linear relationship. Additionally, the 95% confidence interval is examined to determine the range of Pearson's correlation, concluding with relevant references to support the analysis. Desklib provides access to similar assignments and study resources for students.
1 out of 8
Related Documents


Your All-in-One AI-Powered Toolkit for Academic Success.
+13062052269
info@desklib.com
Available 24*7 on WhatsApp / Email
![[object Object]](/_next/static/media/star-bottom.7253800d.svg)
Copyright © 2020–2026 A2Z Services. All Rights Reserved. Developed and managed by ZUCOL.