Electrical Engineering: ECG Performance Practical Analysis Report
VerifiedAdded on 2023/06/04
|7
|1053
|87
Practical Assignment
AI Summary
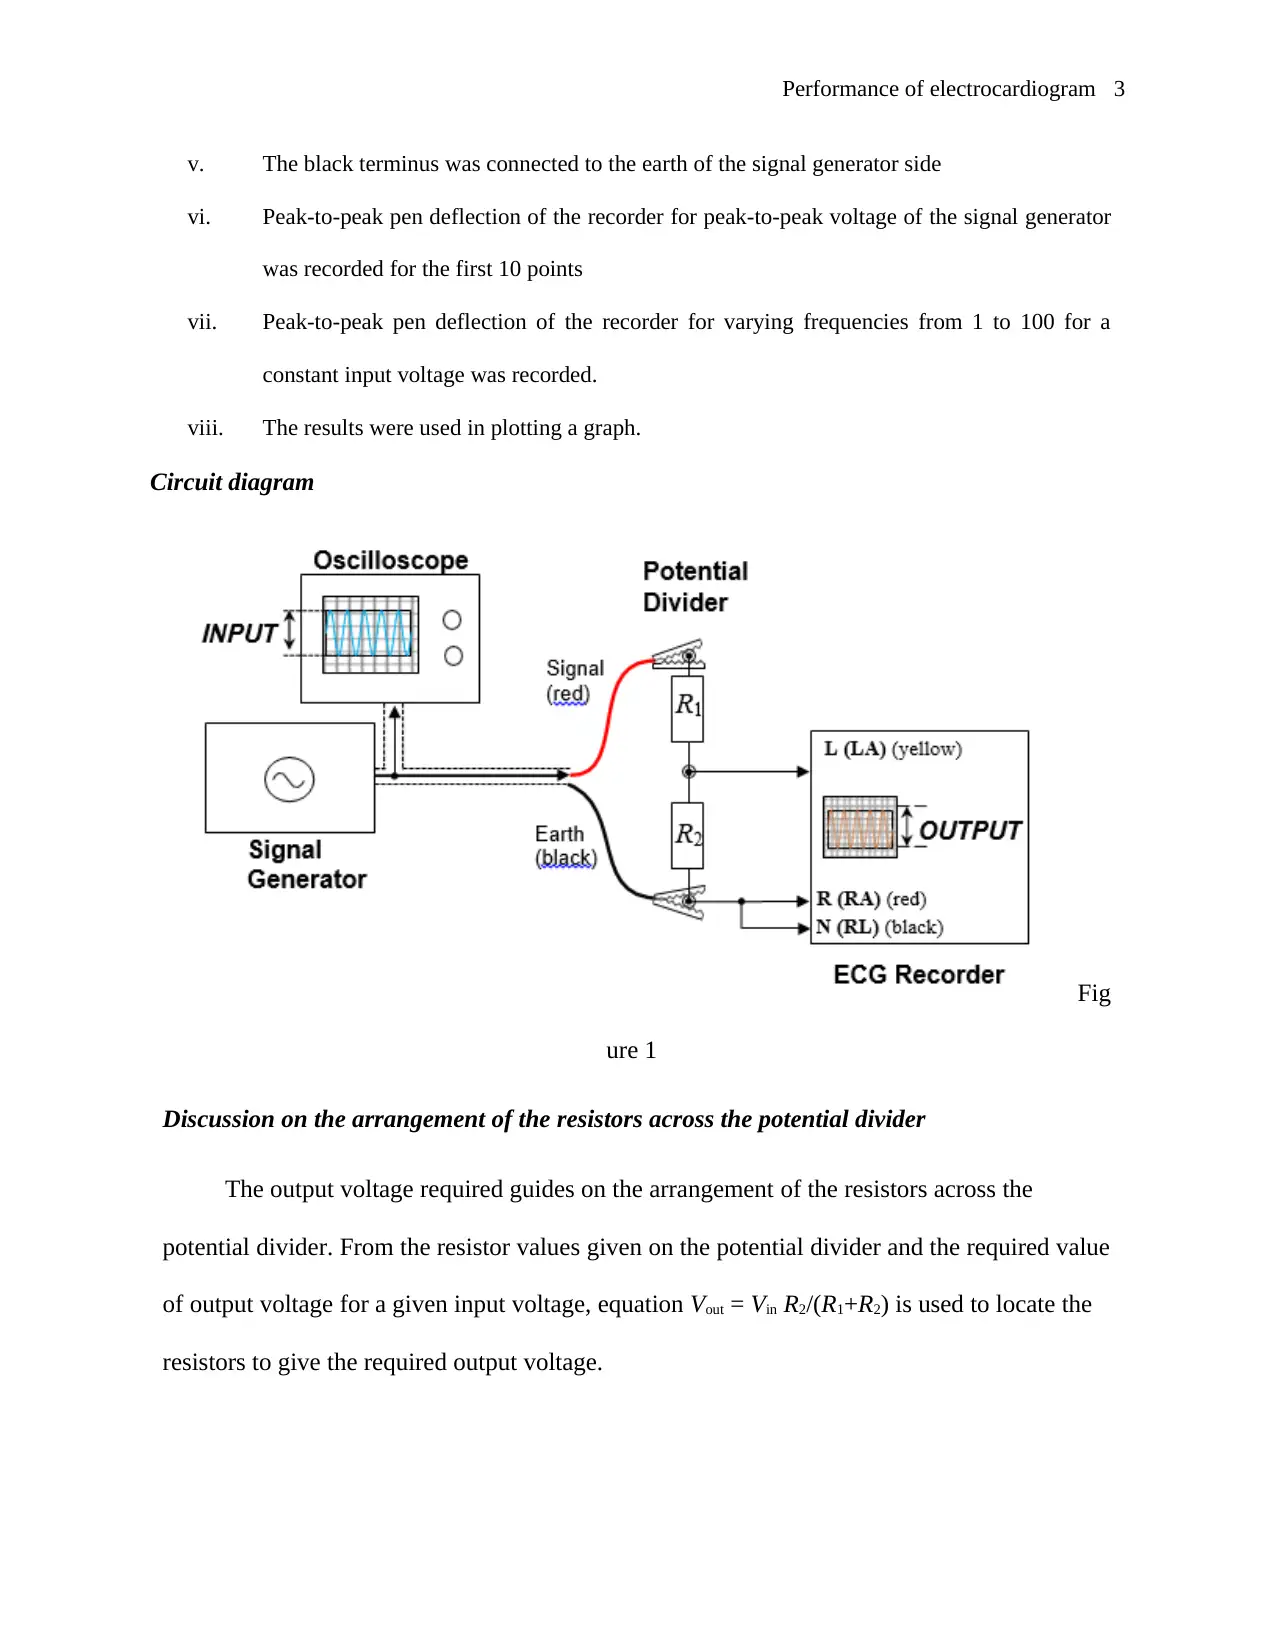
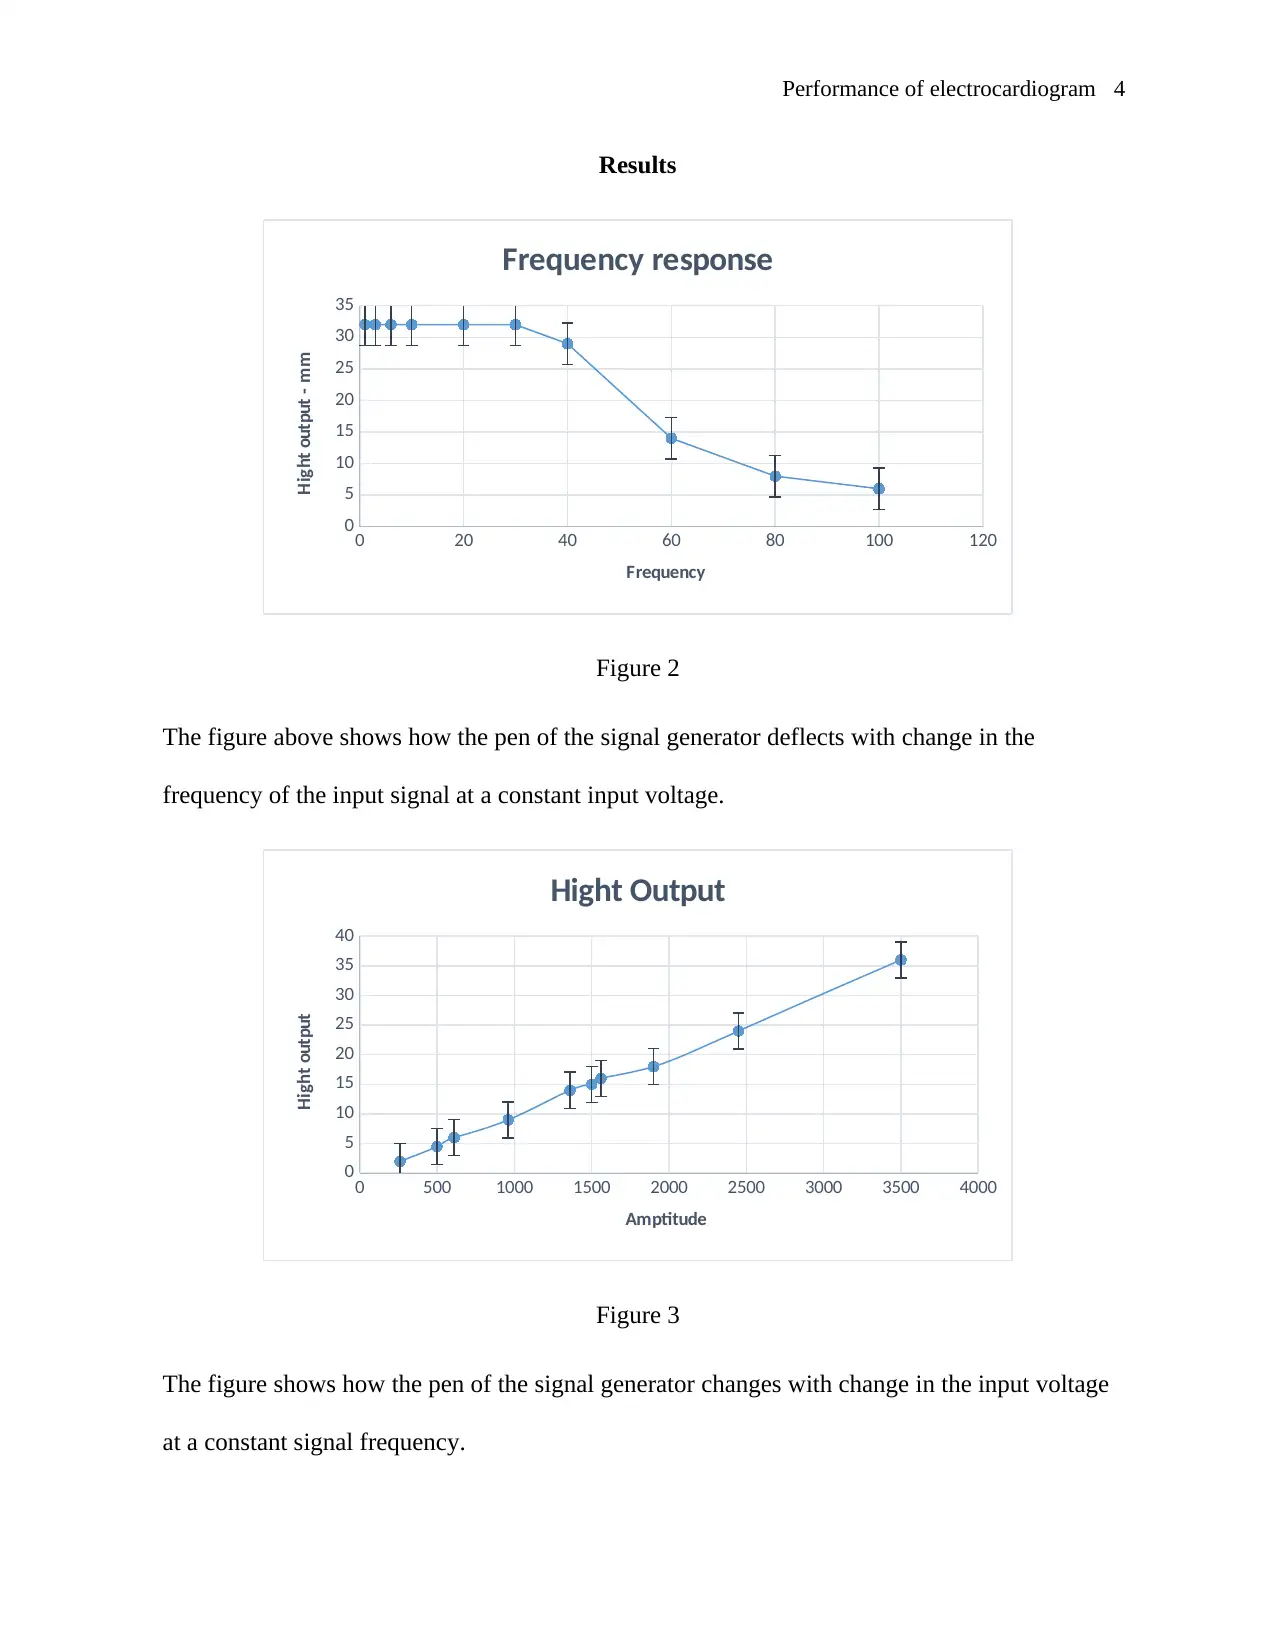
This practical assignment focuses on the performance analysis of an electrocardiogram (ECG) recorder. The experiment utilizes an oscilloscope and signal generator to measure key parameters. The methodology involves setting the signal generator to a 10Hz sine wave and adjusting the input voltage to achieve a specific deflection. The apparatus were arranged as shown in the circuit diagram. The experiment involves measuring the lead-1 position, connecting the black terminus to the signal generator, and recording peak-to-peak pen deflections for varying frequencies and amplitudes. Results are presented in the form of graphs illustrating frequency response and amplitude changes. The discussion section analyzes the linearity graph gradient, the type of filter used (low pass filter), and the cut-off frequency. The filter's role in removing unwanted signals and ensuring the fidelity of the 12-Lead electrocardiogram process is also explained. The gradient of the linearity graph does not agree with the sensitivity setting. This assignment provides a practical understanding of ECG recorder performance and signal analysis.


1 out of 7
Your All-in-One AI-Powered Toolkit for Academic Success.
+13062052269
info@desklib.com
Available 24*7 on WhatsApp / Email
![[object Object]](/_next/static/media/star-bottom.7253800d.svg)
Copyright © 2020–2026 A2Z Services. All Rights Reserved. Developed and managed by ZUCOL.