Comparison of Two Experiments on Perimeter of Airway Basement Membrane (PBM)
VerifiedAdded on 2023/06/12
|15
|2698
|263
AI Summary
This study compares two experiments on the perimeter of airway basement membrane (PBM) using nested and split-plot designs. ANOVA tests were performed to analyze the differences in means of the groups. Results showed significant differences in the groupings with respect to the response measurement of PBM.
Contribute Materials
Your contribution can guide someone’s learning journey. Share your
documents today.

Statistics
Name:
Institution:
24th May 2018
1
Name:
Institution:
24th May 2018
1
Secure Best Marks with AI Grader
Need help grading? Try our AI Grader for instant feedback on your assignments.
Experiment 1
Statistical methods
This experiment involved the taking of samples from deceased individual’s lungs. Each
individual was categorized as either a control subject (group 1), a fatal asthma subject (group 2),
or a none-fatal asthma subject (group 3). Each subject had samples taken from two lobes and the
4 random samples per lobe were taken. The main purpose of this particular experiment was to do
a comparison of the three groupings with respect to the response measurement the perimeter of
the airway basement membrane (pbm). This experiment is a nested design (Cardinal & Aitken,
2006).
In order to test the differences in the means of the three groups, analysis of variance (ANOVA)
test was performed. ANOVA refers to a statistical technique that investigates the potential
differences in a scale-level dependent variable by a nominal-level variable having 2 or more
categories (Algina & Olejnik, 2003). This test is able to tell whether a group of three independent
factors are significantly the different or not at a given level of significance. For this study, a 5%
level of significance was applied in testing the differences in the means of the three groups.
The additive model for this design is:
yij=μ+α i + β ( i ) j+ εijk
Where:
μ is the constant; overall mean
α i is a constant for ith treatment group; deviation from mean of i
βi j is a random effect due to the ith group nested witin the jth experimental unit
2
ε ijk is the random deviation associated with each observation
Results
Box plot
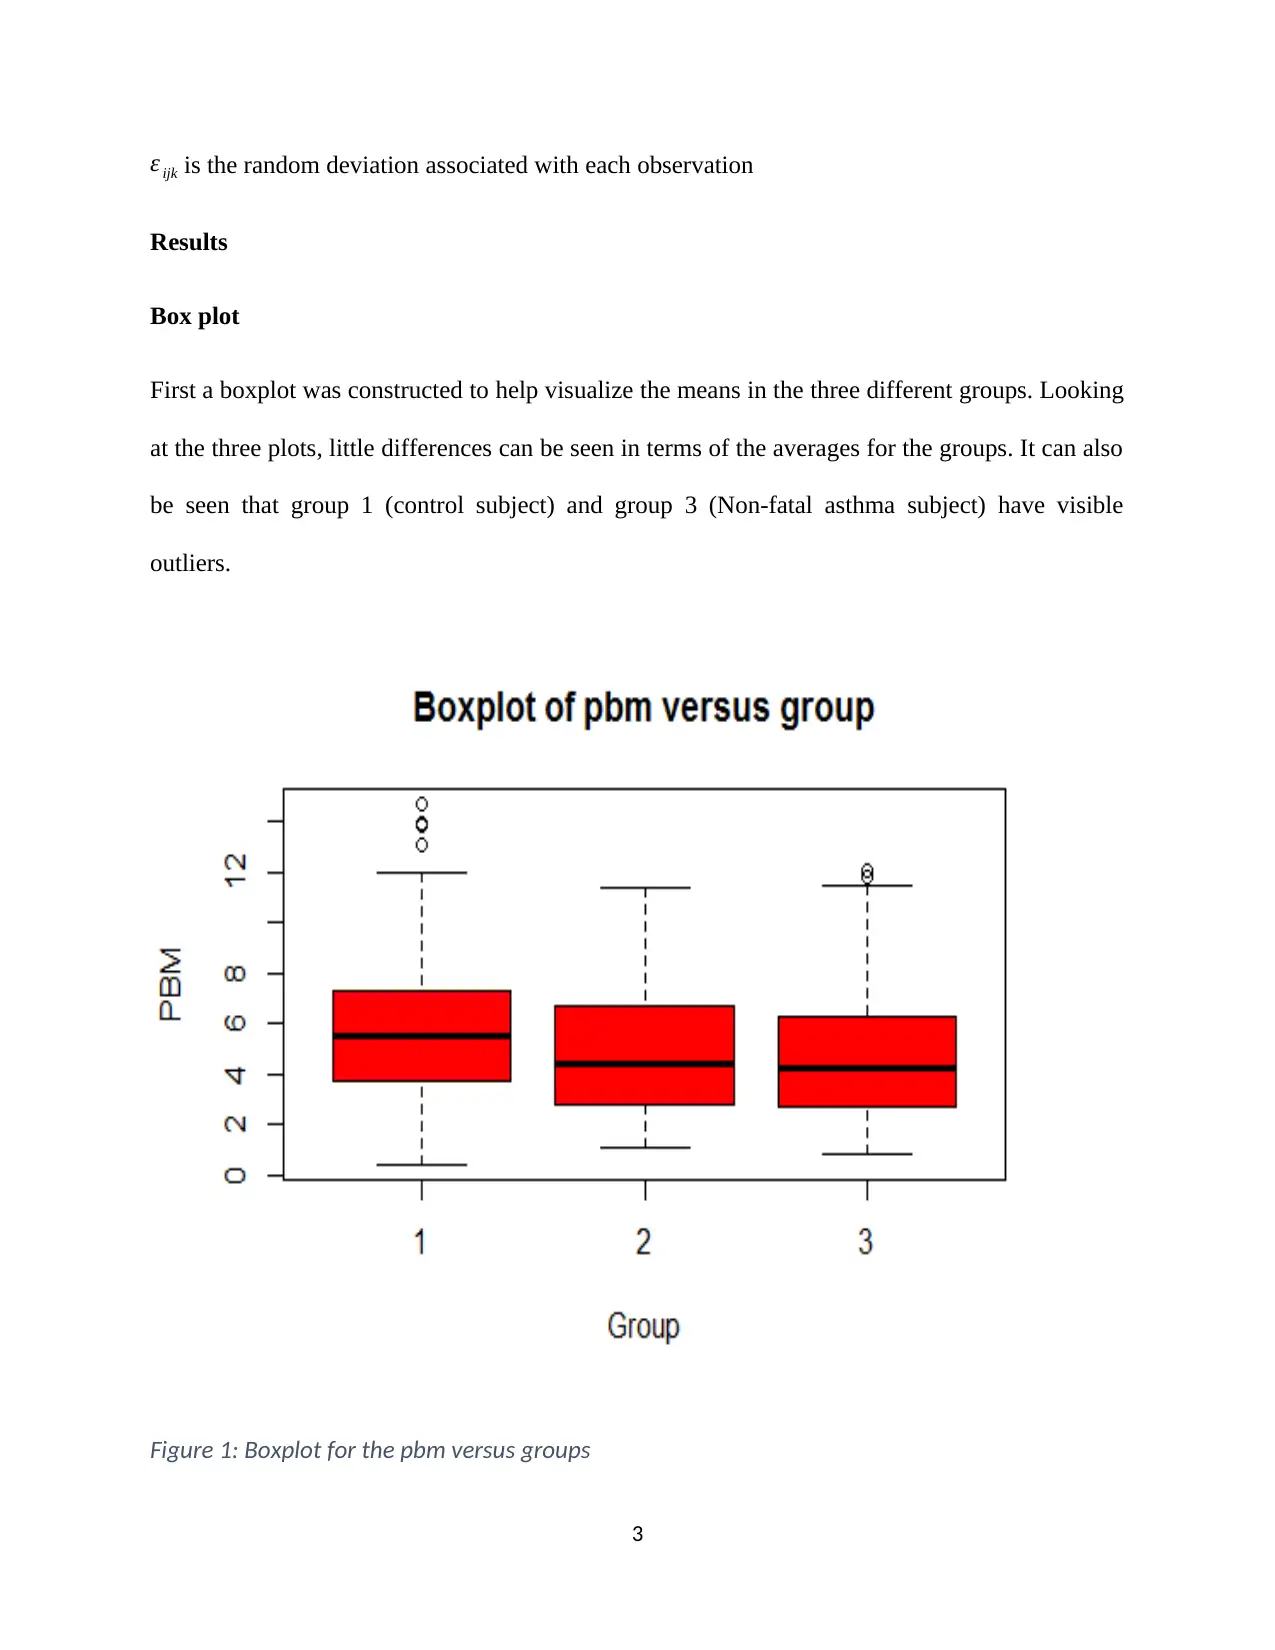
First a boxplot was constructed to help visualize the means in the three different groups. Looking
at the three plots, little differences can be seen in terms of the averages for the groups. It can also
be seen that group 1 (control subject) and group 3 (Non-fatal asthma subject) have visible
outliers.
Figure 1: Boxplot for the pbm versus groups
3
Results
Box plot
First a boxplot was constructed to help visualize the means in the three different groups. Looking
at the three plots, little differences can be seen in terms of the averages for the groups. It can also
be seen that group 1 (control subject) and group 3 (Non-fatal asthma subject) have visible
outliers.
Figure 1: Boxplot for the pbm versus groups
3
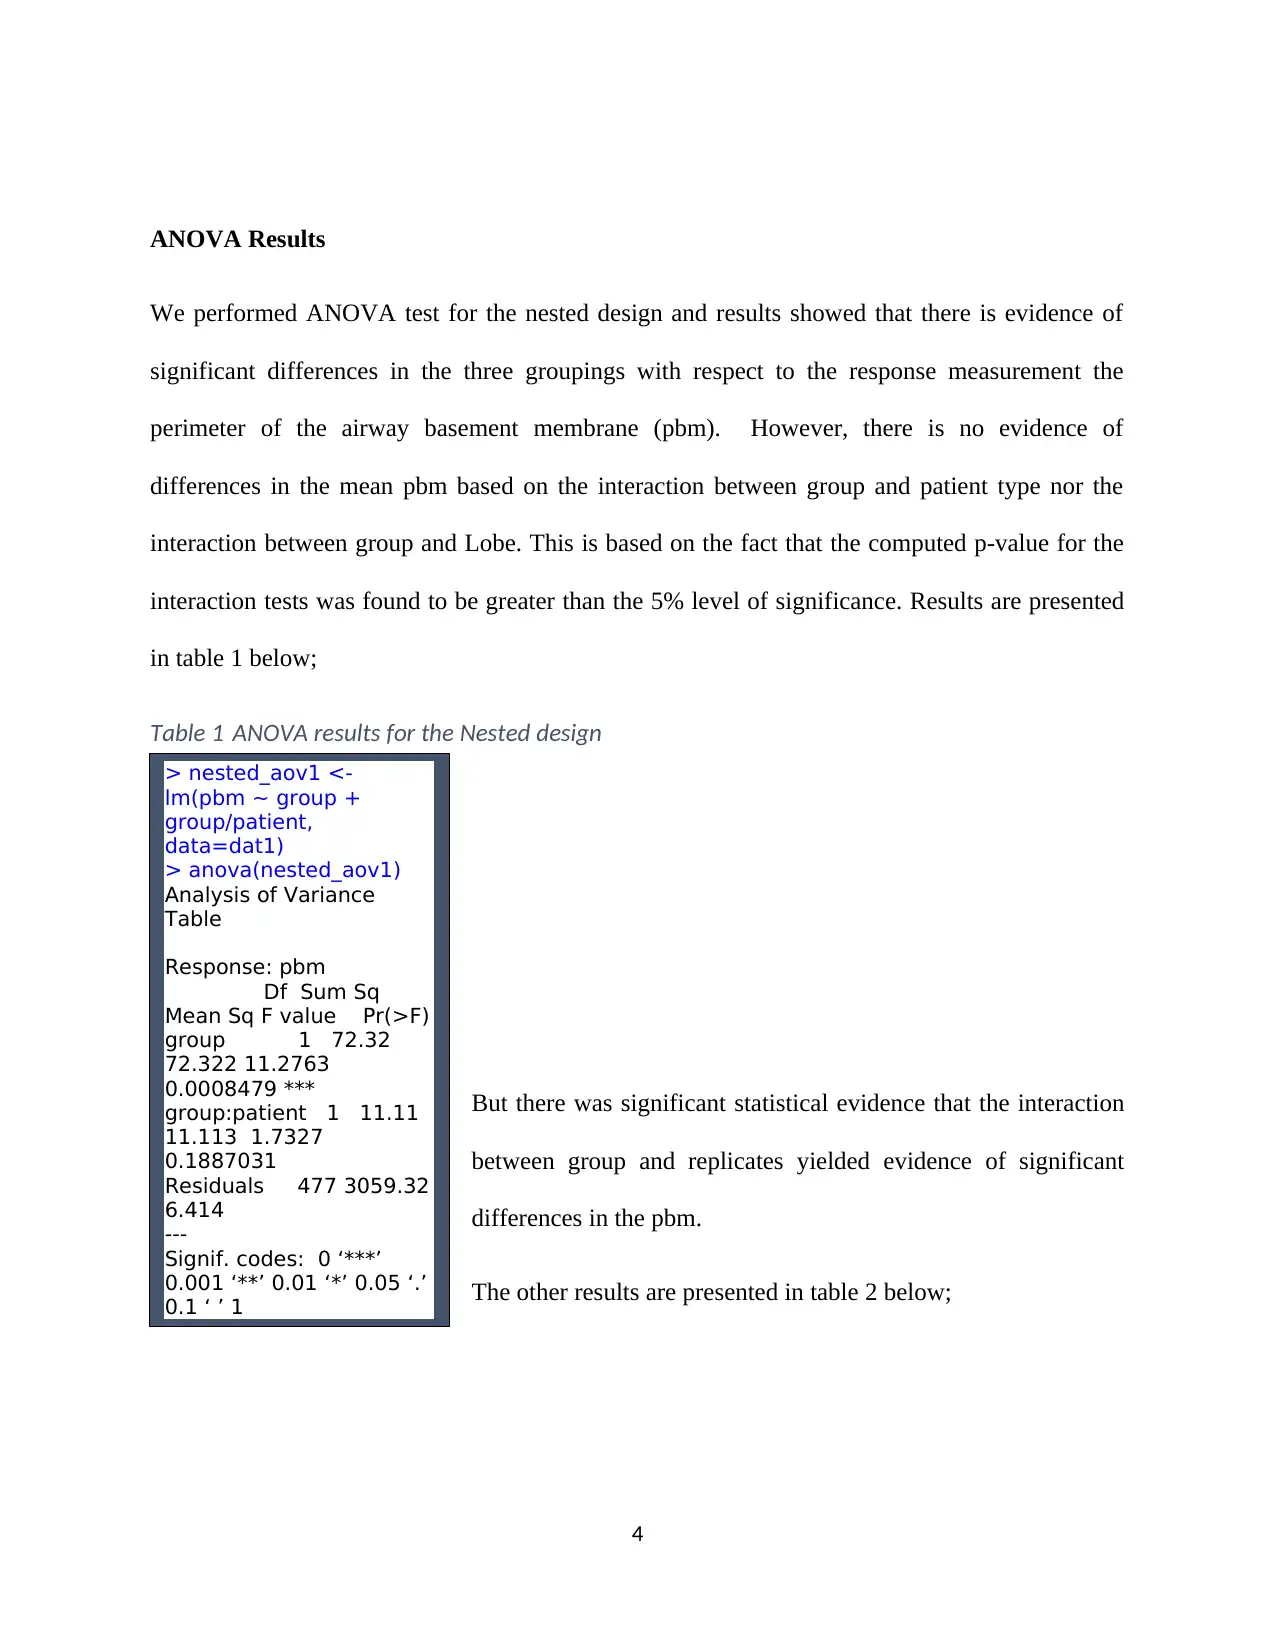
ANOVA Results
We performed ANOVA test for the nested design and results showed that there is evidence of
significant differences in the three groupings with respect to the response measurement the
perimeter of the airway basement membrane (pbm). However, there is no evidence of
differences in the mean pbm based on the interaction between group and patient type nor the
interaction between group and Lobe. This is based on the fact that the computed p-value for the
interaction tests was found to be greater than the 5% level of significance. Results are presented
in table 1 below;
But there was significant statistical evidence that the interaction
between group and replicates yielded evidence of significant
differences in the pbm.
The other results are presented in table 2 below;
4
> nested_aov1 <-
lm(pbm ~ group +
group/patient,
data=dat1)
> anova(nested_aov1)
Analysis of Variance
Table
Response: pbm
Df Sum Sq
Mean Sq F value Pr(>F)
group 1 72.32
72.322 11.2763
0.0008479 ***
group:patient 1 11.11
11.113 1.7327
0.1887031
Residuals 477 3059.32
6.414
---
Signif. codes: 0 ‘***’
0.001 ‘**’ 0.01 ‘*’ 0.05 ‘.’
0.1 ‘ ’ 1
Table 1 ANOVA results for the Nested design
Secure Best Marks with AI Grader
Need help grading? Try our AI Grader for instant feedback on your assignments.
Experiment 2
Methodology
A similar experiment again just like the previous one, involved
the taking of samples from deceased individual’s lungs.
5
> nested_aov1 <-
lm(pbm ~ group +
group/patient,
data=dat1)
> anova(nested_aov1)
Analysis of Variance
Table
Response: pbm
Df Sum Sq
Mean Sq F value Pr(>F)
group 1 72.32
72.322 11.2763
0.0008479 ***
group:patient 1 11.11
11.113 1.7327
0.1887031
Residuals 477 3059.32
6.414
---
Signif. codes: 0 ‘***’
0.001 ‘**’ 0.01 ‘*’ 0.05 ‘.’
0.1 ‘ ’ 1
> nested_aov2 <-
lm(pbm ~ group +
group/Lobe, data=dat1)
> anova(nested_aov2)
Analysis of Variance
Table
Response: pbm
Df Sum Sq Mean
Sq F value Pr(>F)
group 1 72.32
72.322 11.2970
0.0008387 ***
group:Lobe 1 16.72
16.724 2.6123
0.1066995
Residuals 477 3053.71
6.402
---
Signif. codes: 0 ‘***’
0.001 ‘**’ 0.01 ‘*’ 0.05 ‘.’
0.1 ‘ ’ 1
> nested_aov3 <-
lm(pbm ~ group +
group/replicate,
data=dat1)
> anova(nested_aov3)
Analysis of Variance
Table
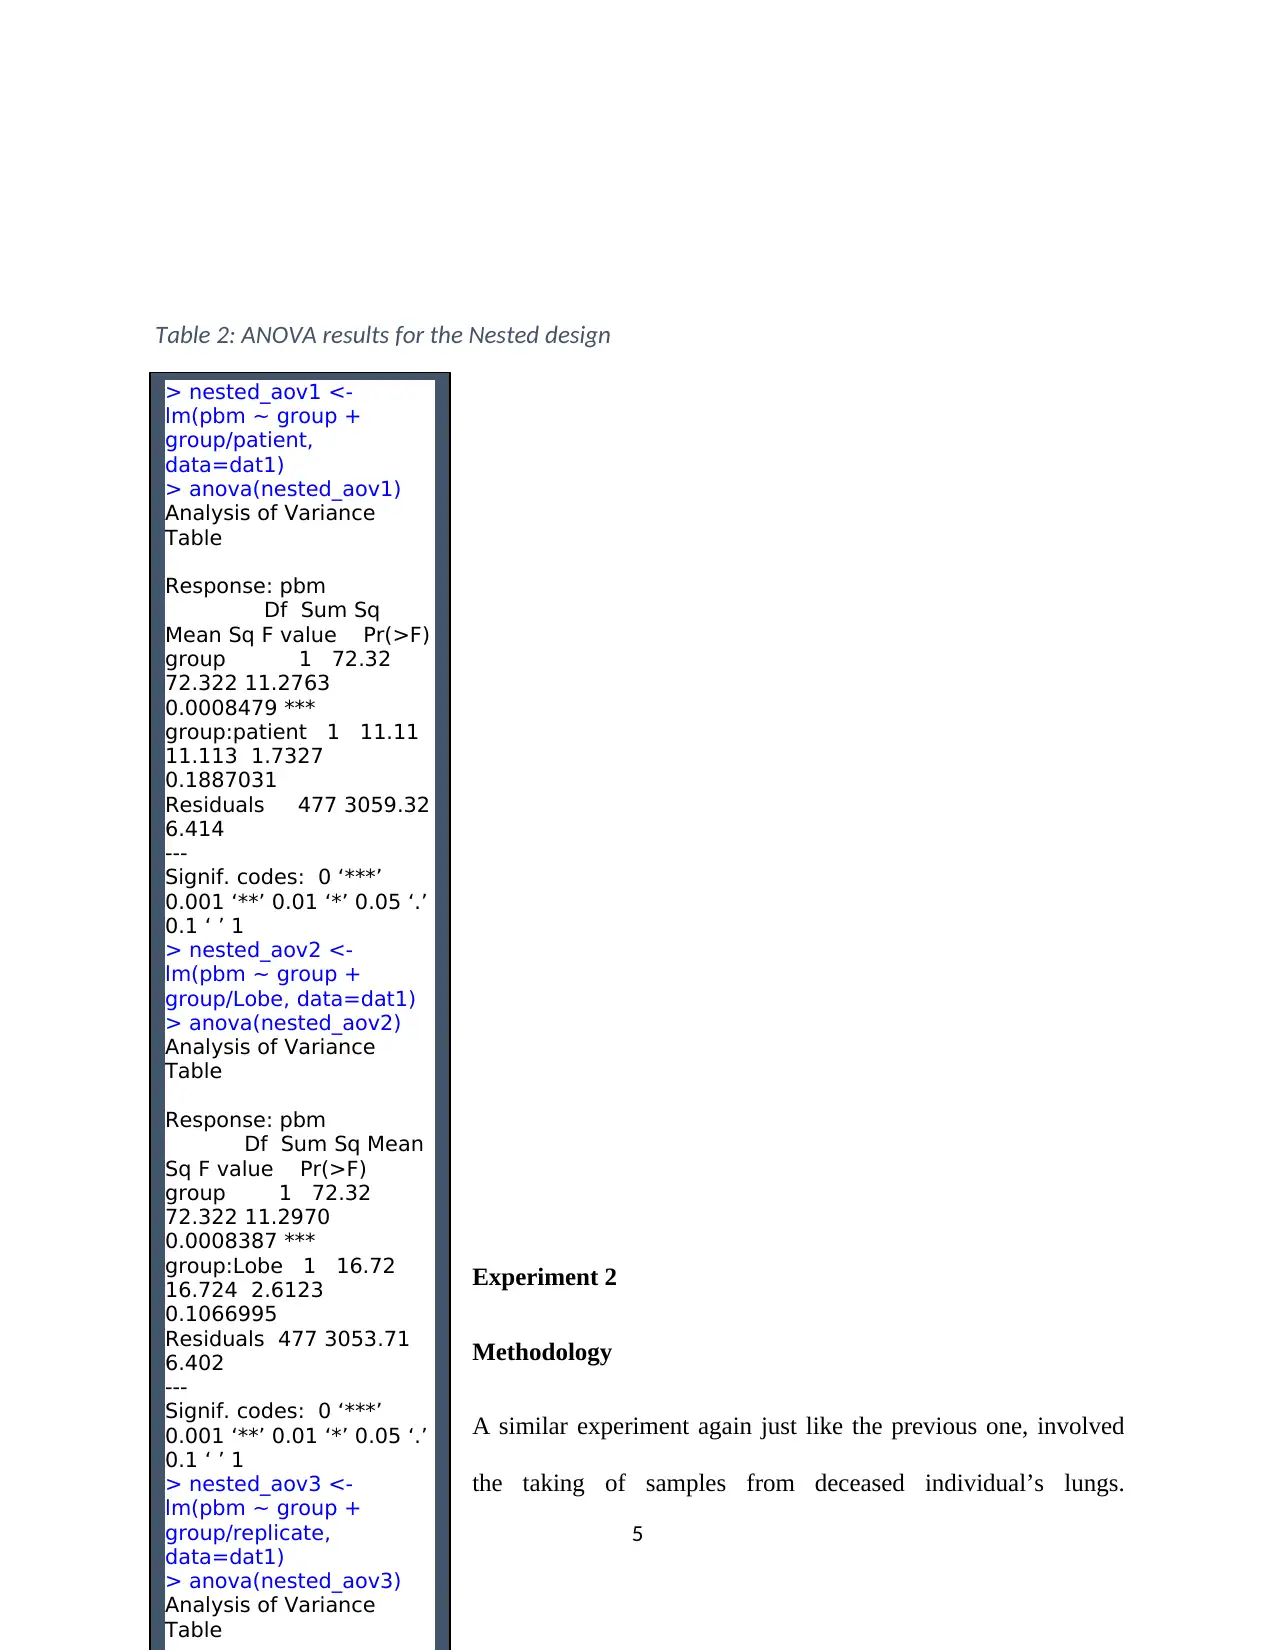
Table 2: ANOVA results for the Nested design
Methodology
A similar experiment again just like the previous one, involved
the taking of samples from deceased individual’s lungs.
5
> nested_aov1 <-
lm(pbm ~ group +
group/patient,
data=dat1)
> anova(nested_aov1)
Analysis of Variance
Table
Response: pbm
Df Sum Sq
Mean Sq F value Pr(>F)
group 1 72.32
72.322 11.2763
0.0008479 ***
group:patient 1 11.11
11.113 1.7327
0.1887031
Residuals 477 3059.32
6.414
---
Signif. codes: 0 ‘***’
0.001 ‘**’ 0.01 ‘*’ 0.05 ‘.’
0.1 ‘ ’ 1
> nested_aov2 <-
lm(pbm ~ group +
group/Lobe, data=dat1)
> anova(nested_aov2)
Analysis of Variance
Table
Response: pbm
Df Sum Sq Mean
Sq F value Pr(>F)
group 1 72.32
72.322 11.2970
0.0008387 ***
group:Lobe 1 16.72
16.724 2.6123
0.1066995
Residuals 477 3053.71
6.402
---
Signif. codes: 0 ‘***’
0.001 ‘**’ 0.01 ‘*’ 0.05 ‘.’
0.1 ‘ ’ 1
> nested_aov3 <-
lm(pbm ~ group +
group/replicate,
data=dat1)
> anova(nested_aov3)
Analysis of Variance
Table
Table 2: ANOVA results for the Nested design
However, contrary to the previous experiment, each individual was categorized as either a
control subject (group 1), or an asthma subject (group 2). However, each subject had samples
taken from only one lobe then 3 samples per lobe were taken at different levels (small, medium,
large). The main purpose of this particular experiment was to do a comparison of the two
groupings (control vs asthma) along with the level to see if they had an impact on the response
measurement the perimeter of the airway basement membrane (pbm). This experiment is a split
plot design in a completely randomized structure (Tsangari & Akritas, 2004). Just like
experiment 1, ANOVA test though in this case a split plot design was used. This test is able to
tell whether a group of three independent factors are significantly the different or not at a given
level of significance. For this study, a 5% level of significance was applied in testing the
differences in the means of the three groups.
The model for this split plot design is:
Y ijk =μ+τi + Sij +γk + ( τγ ) ik +ϵijk
Where
Y ijk= the response to diet i of subject j at time k,
τi = diet i effect
Sij= subject j's effect in diet i (whole plot error)
( τγ )ik= the interaction of diet i and time j
ϵijk= split plot error
6
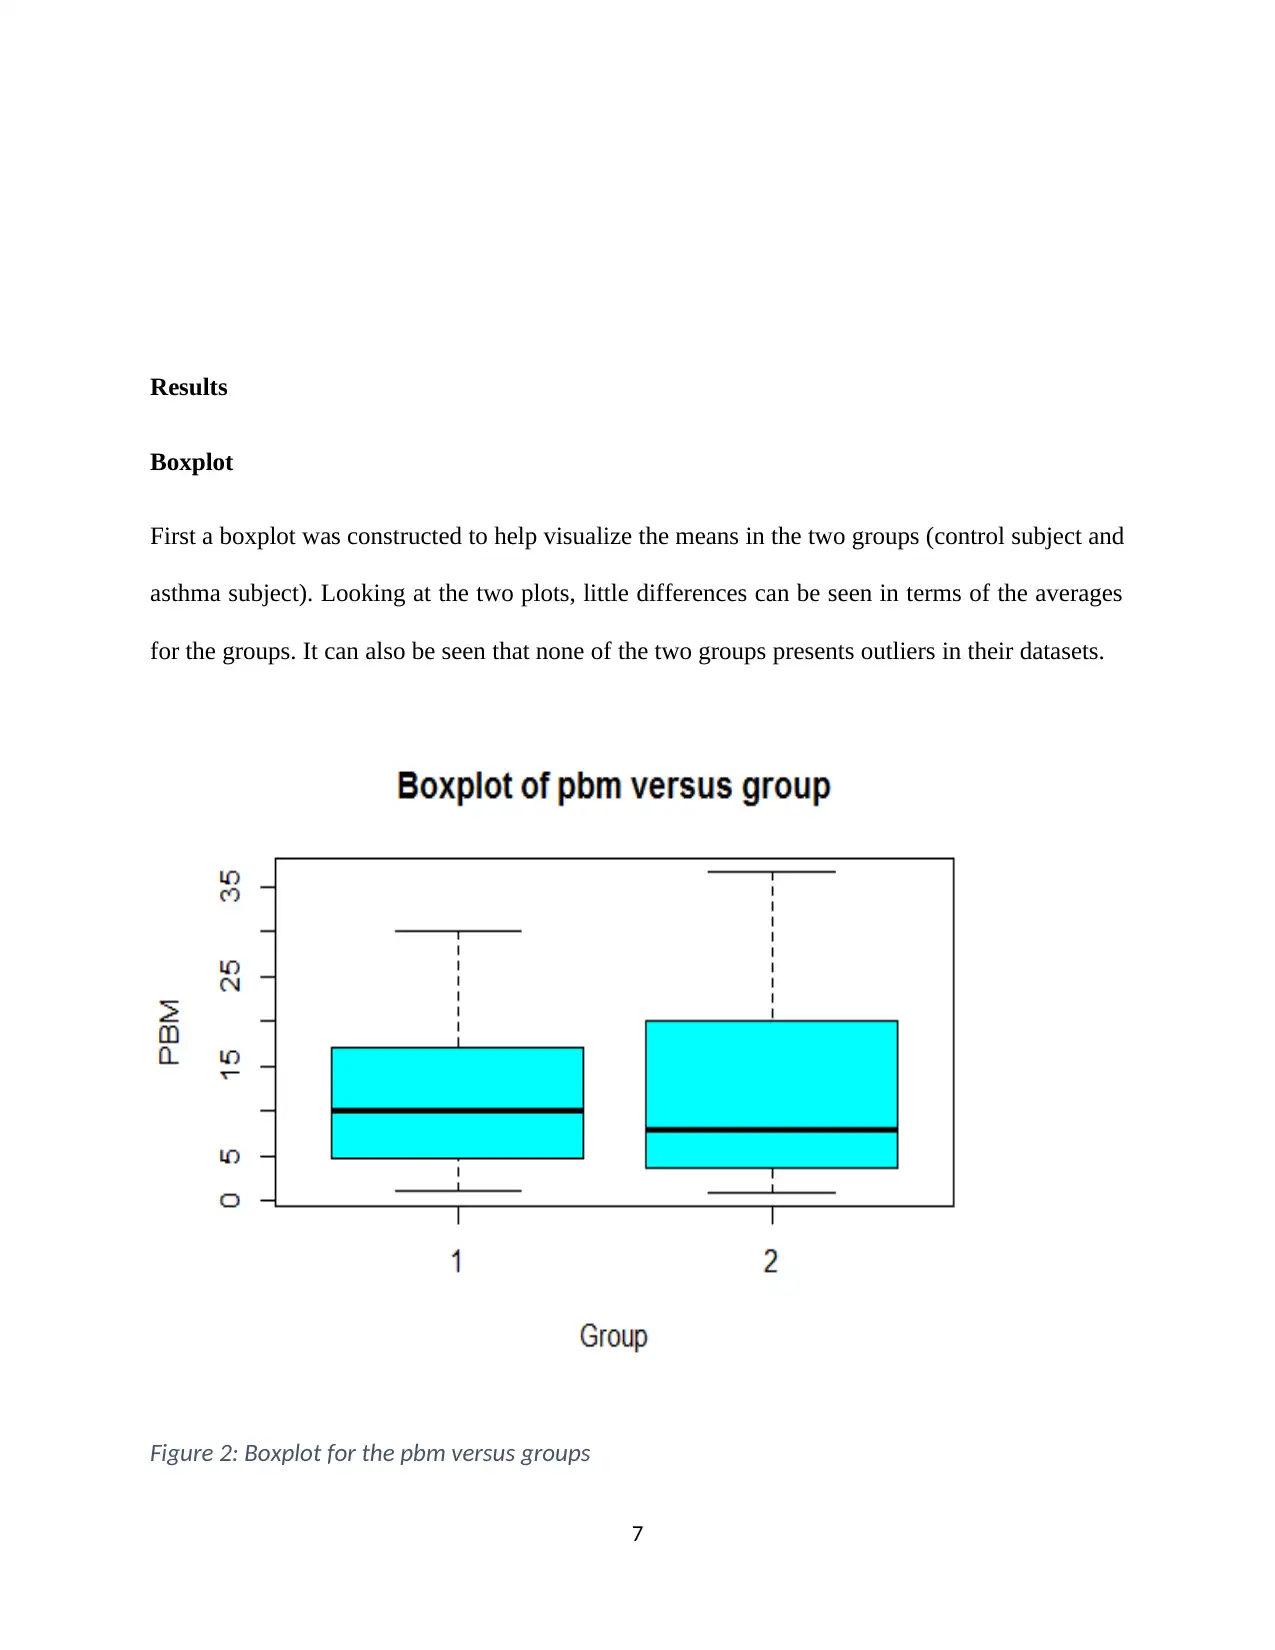
Results
Boxplot
First a boxplot was constructed to help visualize the means in the two groups (control subject and
asthma subject). Looking at the two plots, little differences can be seen in terms of the averages
for the groups. It can also be seen that none of the two groups presents outliers in their datasets.
Figure 2: Boxplot for the pbm versus groups
7
Paraphrase This Document
Need a fresh take? Get an instant paraphrase of this document with our AI Paraphraser
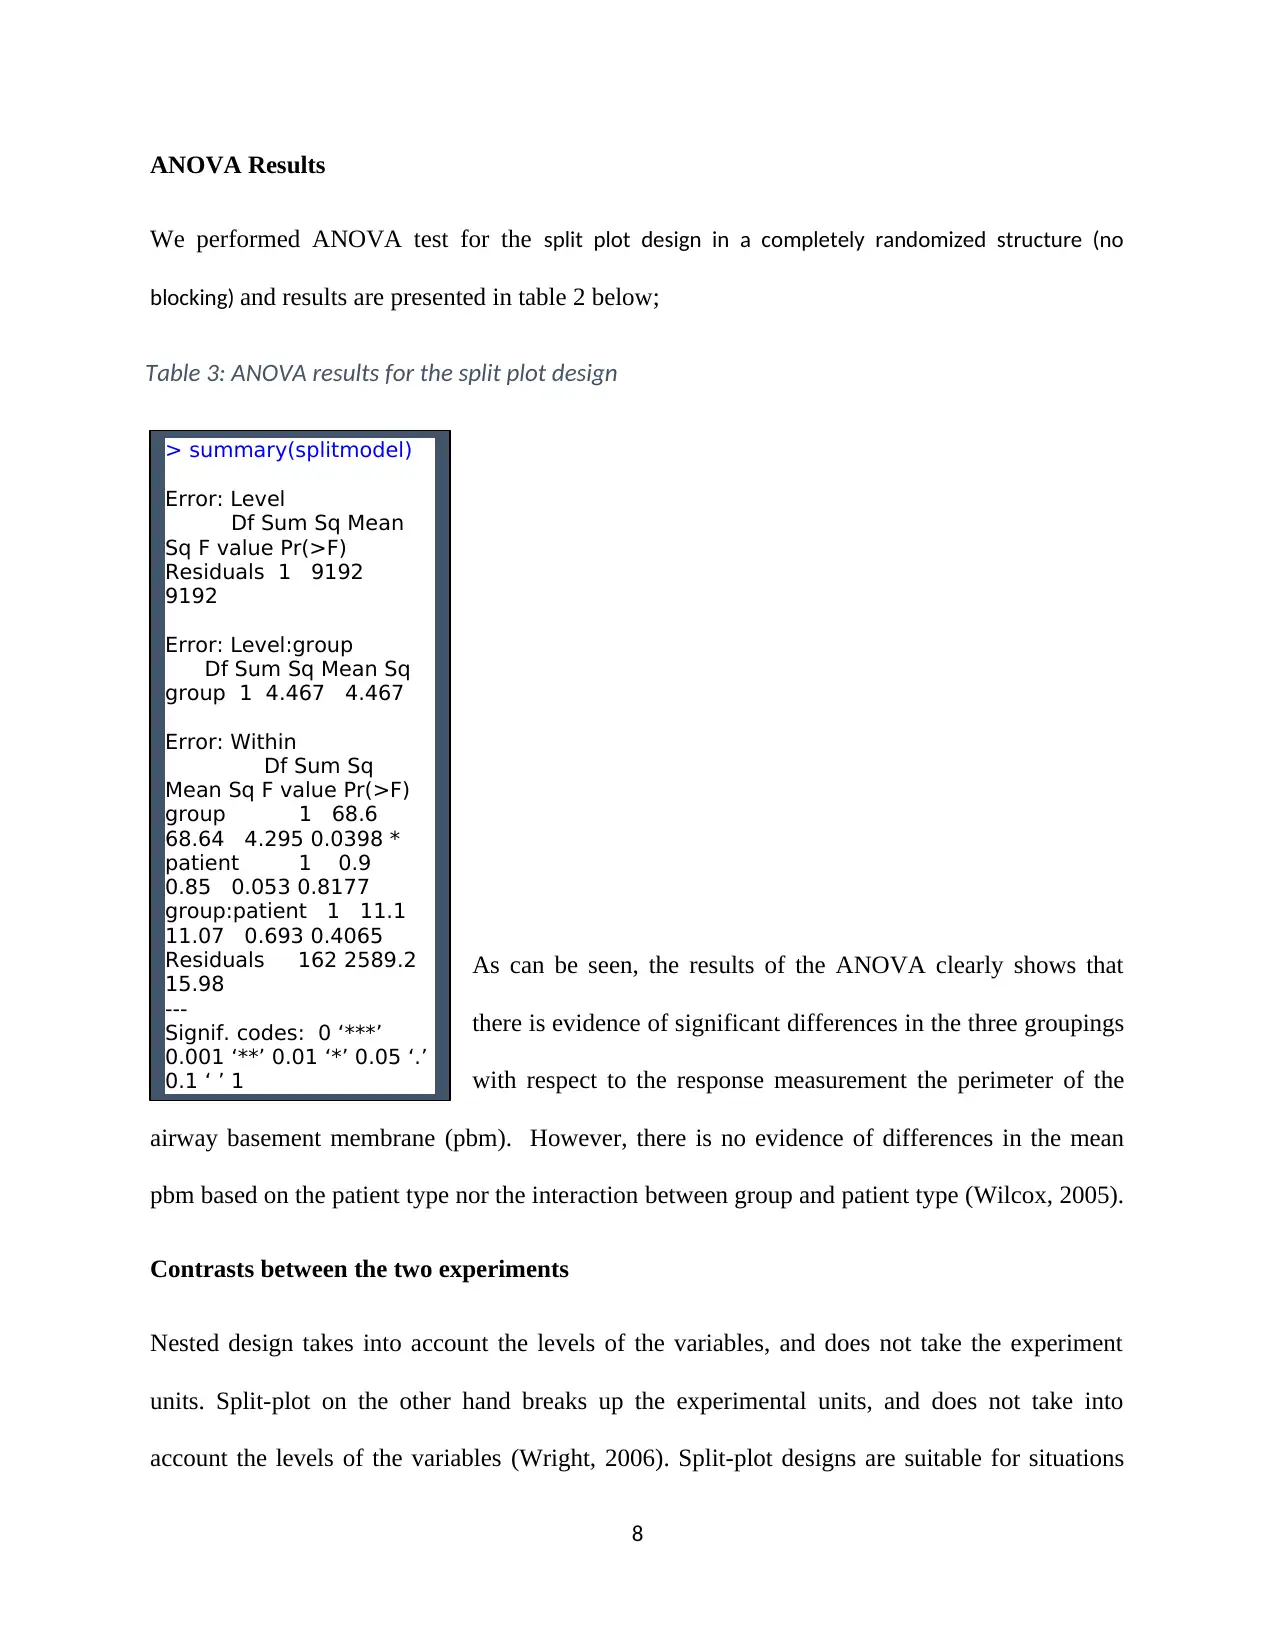
ANOVA Results
We performed ANOVA test for the split plot design in a completely randomized structure (no
blocking) and results are presented in table 2 below;
As can be seen, the results of the ANOVA clearly shows that
there is evidence of significant differences in the three groupings
with respect to the response measurement the perimeter of the
airway basement membrane (pbm). However, there is no evidence of differences in the mean
pbm based on the patient type nor the interaction between group and patient type (Wilcox, 2005).
Contrasts between the two experiments
Nested design takes into account the levels of the variables, and does not take the experiment
units. Split-plot on the other hand breaks up the experimental units, and does not take into
account the levels of the variables (Wright, 2006). Split-plot designs are suitable for situations
8
> summary(splitmodel)
Error: Level
Df Sum Sq Mean
Sq F value Pr(>F)
Residuals 1 9192
9192
Error: Level:group
Df Sum Sq Mean Sq
group 1 4.467 4.467
Error: Within
Df Sum Sq
Mean Sq F value Pr(>F)
group 1 68.6
68.64 4.295 0.0398 *
patient 1 0.9
0.85 0.053 0.8177
group:patient 1 11.1
11.07 0.693 0.4065
Residuals 162 2589.2
15.98
---
Signif. codes: 0 ‘***’
0.001 ‘**’ 0.01 ‘*’ 0.05 ‘.’
0.1 ‘ ’ 1
Table 3: ANOVA results for the split plot design
where one of the factors can only be varied on a “large” scale this is not possible for the nested
design.
Conclusion
The aim of this study was to analyze two datasets where the first experiment sought to compare
three groupings with respect to the response measurement the perimeter of the airway basement
membrane (peri-inter) using nested design approach. The second experiment sought to compare
the two groupings (control vs asthma) along with the level to see if they had an impact on the
response measurement the perimeter of the airway basement membrane (peri-inter) though in
this case using a split plot design in a completely randomized structure (no blocking). Lobe,
level, replication and patients were used in the mixed-model analysis so as to correct for any
likely confounders and also to assess the effect of asthma on Pbm. Results of both experiments
showed that there are significant differences in the groupings with respect to the response
measurement the perimeter of the airway basement membrane (pbm). The current study
indicated that the length (perimeter) of the basement membrane, which is observed on airways, is
not statistically significantly different in large airways among the subjects without asthma and
those with asthma. Based on the results, the length of the Pbm can therefore be used as a reliable
marker of airway size in comparing the dimensions of large airways from the different asthma
cases irrespective of lung size.
9
References
Algina, J. & Olejnik, S., 2003. Conducting power analyses for ANOVA and ANCOVA in
between-subjects designs. Evaluation & the Health Professions, 26(3), pp. 288-314..
Cardinal, R. N. & Aitken, M. F., 2006. ANOVA for the behavioural sciences researcher.
Tsangari, H. & Akritas, M. G., 2004. Nonparametric ANCOVA with two and three covariates.
Journal of Multivariate Analysis, 88(2), pp. 298-319.
Wilcox, R. R., 2005. An approach to ANCOVA that allows multiple covariates, nonlinearity, and
heteroscedasticity. Educational and Psychological Measurement, 65(3), pp. 442-450.
Wright, D. B., 2006. Comparing groups in a before-after design: When t test and ANCOVA
produce different results. British Journal of Educational Psychology, 76(5), pp. 663-675.
10
Secure Best Marks with AI Grader
Need help grading? Try our AI Grader for instant feedback on your assignments.
Appendix
dat1<-read.csv("C:\\Users\\310187796\\Desktop\\ass2dat1.csv")
dat2<-read.csv("C:\\Users\\310187796\\Desktop\\ass2dat2.csv")
str(dat1)
str(dat2)
#running ANOVA for the nested design
dat1_aov <- aov(pbm ~ group + Error(Lobe), dat1)
dat1_aov
summary(dat1_aov)
nested_aov1 <- lm(pbm ~ group + group/patient, data=dat1)
anova(nested_aov1)
nested_aov2 <- lm(pbm ~ group + group/Lobe, data=dat1)
anova(nested_aov2)
nested_aov3 <- lm(pbm ~ group + group/replicate, data=dat1)
anova(nested_aov3)
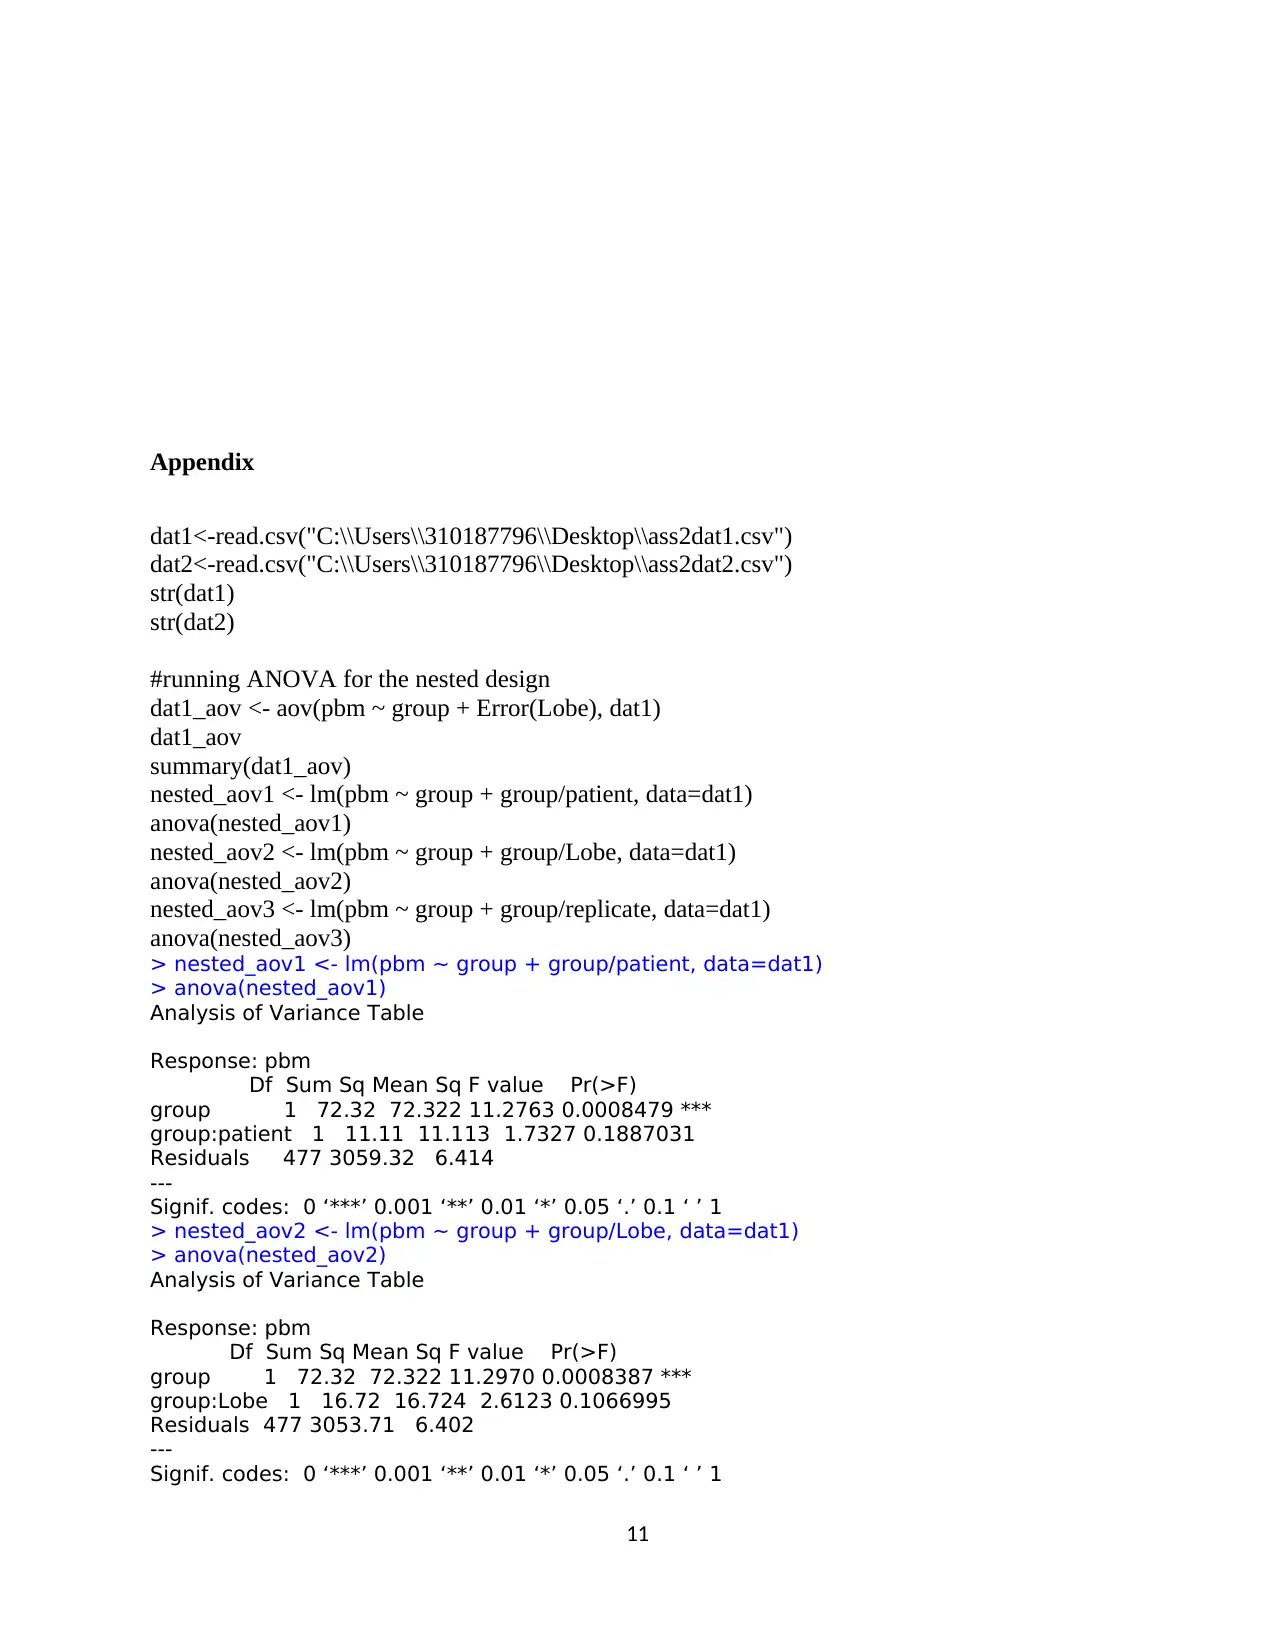
> nested_aov1 <- lm(pbm ~ group + group/patient, data=dat1)
> anova(nested_aov1)
Analysis of Variance Table
Response: pbm
Df Sum Sq Mean Sq F value Pr(>F)
group 1 72.32 72.322 11.2763 0.0008479 ***
group:patient 1 11.11 11.113 1.7327 0.1887031
Residuals 477 3059.32 6.414
---
Signif. codes: 0 ‘***’ 0.001 ‘**’ 0.01 ‘*’ 0.05 ‘.’ 0.1 ‘ ’ 1
> nested_aov2 <- lm(pbm ~ group + group/Lobe, data=dat1)
> anova(nested_aov2)
Analysis of Variance Table
Response: pbm
Df Sum Sq Mean Sq F value Pr(>F)
group 1 72.32 72.322 11.2970 0.0008387 ***
group:Lobe 1 16.72 16.724 2.6123 0.1066995
Residuals 477 3053.71 6.402
---
Signif. codes: 0 ‘***’ 0.001 ‘**’ 0.01 ‘*’ 0.05 ‘.’ 0.1 ‘ ’ 1
11
dat1<-read.csv("C:\\Users\\310187796\\Desktop\\ass2dat1.csv")
dat2<-read.csv("C:\\Users\\310187796\\Desktop\\ass2dat2.csv")
str(dat1)
str(dat2)
#running ANOVA for the nested design
dat1_aov <- aov(pbm ~ group + Error(Lobe), dat1)
dat1_aov
summary(dat1_aov)
nested_aov1 <- lm(pbm ~ group + group/patient, data=dat1)
anova(nested_aov1)
nested_aov2 <- lm(pbm ~ group + group/Lobe, data=dat1)
anova(nested_aov2)
nested_aov3 <- lm(pbm ~ group + group/replicate, data=dat1)
anova(nested_aov3)
> nested_aov1 <- lm(pbm ~ group + group/patient, data=dat1)
> anova(nested_aov1)
Analysis of Variance Table
Response: pbm
Df Sum Sq Mean Sq F value Pr(>F)
group 1 72.32 72.322 11.2763 0.0008479 ***
group:patient 1 11.11 11.113 1.7327 0.1887031
Residuals 477 3059.32 6.414
---
Signif. codes: 0 ‘***’ 0.001 ‘**’ 0.01 ‘*’ 0.05 ‘.’ 0.1 ‘ ’ 1
> nested_aov2 <- lm(pbm ~ group + group/Lobe, data=dat1)
> anova(nested_aov2)
Analysis of Variance Table
Response: pbm
Df Sum Sq Mean Sq F value Pr(>F)
group 1 72.32 72.322 11.2970 0.0008387 ***
group:Lobe 1 16.72 16.724 2.6123 0.1066995
Residuals 477 3053.71 6.402
---
Signif. codes: 0 ‘***’ 0.001 ‘**’ 0.01 ‘*’ 0.05 ‘.’ 0.1 ‘ ’ 1
11

> nested_aov3 <- lm(pbm ~ group + group/replicate, data=dat1)
> anova(nested_aov3)
Analysis of Variance Table
Response: pbm
Df Sum Sq Mean Sq F value Pr(>F)
group 1 72.32 72.32 18.814 1.76e-05 ***
group:replicate 1 1236.82 1236.82 321.748 < 2.2e-16 ***
Residuals 477 1833.62 3.84
---
Signif. codes: 0 ‘***’ 0.001 ‘**’ 0.01 ‘*’ 0.05 ‘.’ 0.1 ‘ ’ 1
boxplot(pbm ~ group, dat1, main="Boxplot of pbm versus group", xlab="Group", ylab="PBM",
col="red")
boxplot(pbm ~ Lobe, dat1, main="Boxplot of pbm versus Lobe", xlab="Lobe", ylab="PBM",
col="green")
boxplot(pbm ~ Lobe, dat1, main="Boxplot of pbm versus Replicate", xlab="Replicate",
ylab="PBM", col="purple")
12
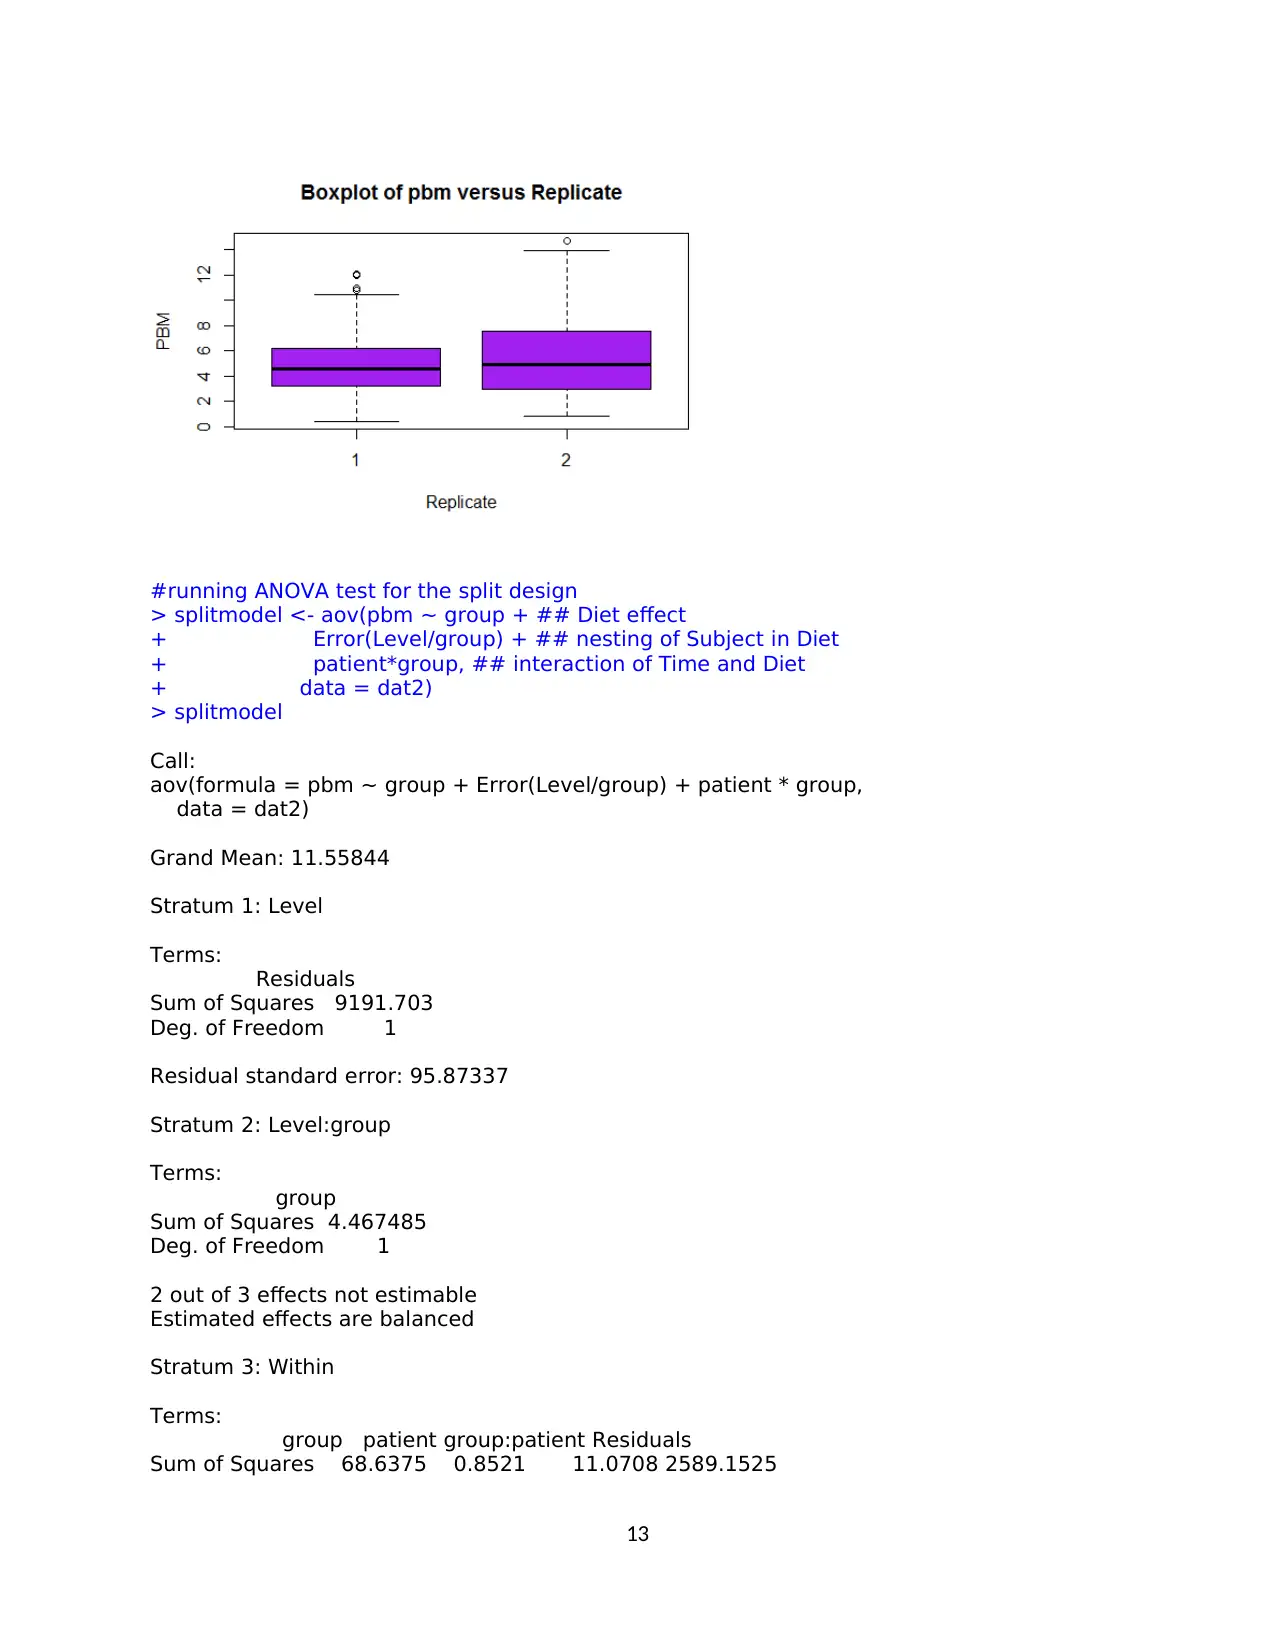
#running ANOVA test for the split design
> splitmodel <- aov(pbm ~ group + ## Diet effect
+ Error(Level/group) + ## nesting of Subject in Diet
+ patient*group, ## interaction of Time and Diet
+ data = dat2)
> splitmodel
Call:
aov(formula = pbm ~ group + Error(Level/group) + patient * group,
data = dat2)
Grand Mean: 11.55844
Stratum 1: Level
Terms:
Residuals
Sum of Squares 9191.703
Deg. of Freedom 1
Residual standard error: 95.87337
Stratum 2: Level:group
Terms:
group
Sum of Squares 4.467485
Deg. of Freedom 1
2 out of 3 effects not estimable
Estimated effects are balanced
Stratum 3: Within
Terms:
group patient group:patient Residuals
Sum of Squares 68.6375 0.8521 11.0708 2589.1525
13
Paraphrase This Document
Need a fresh take? Get an instant paraphrase of this document with our AI Paraphraser
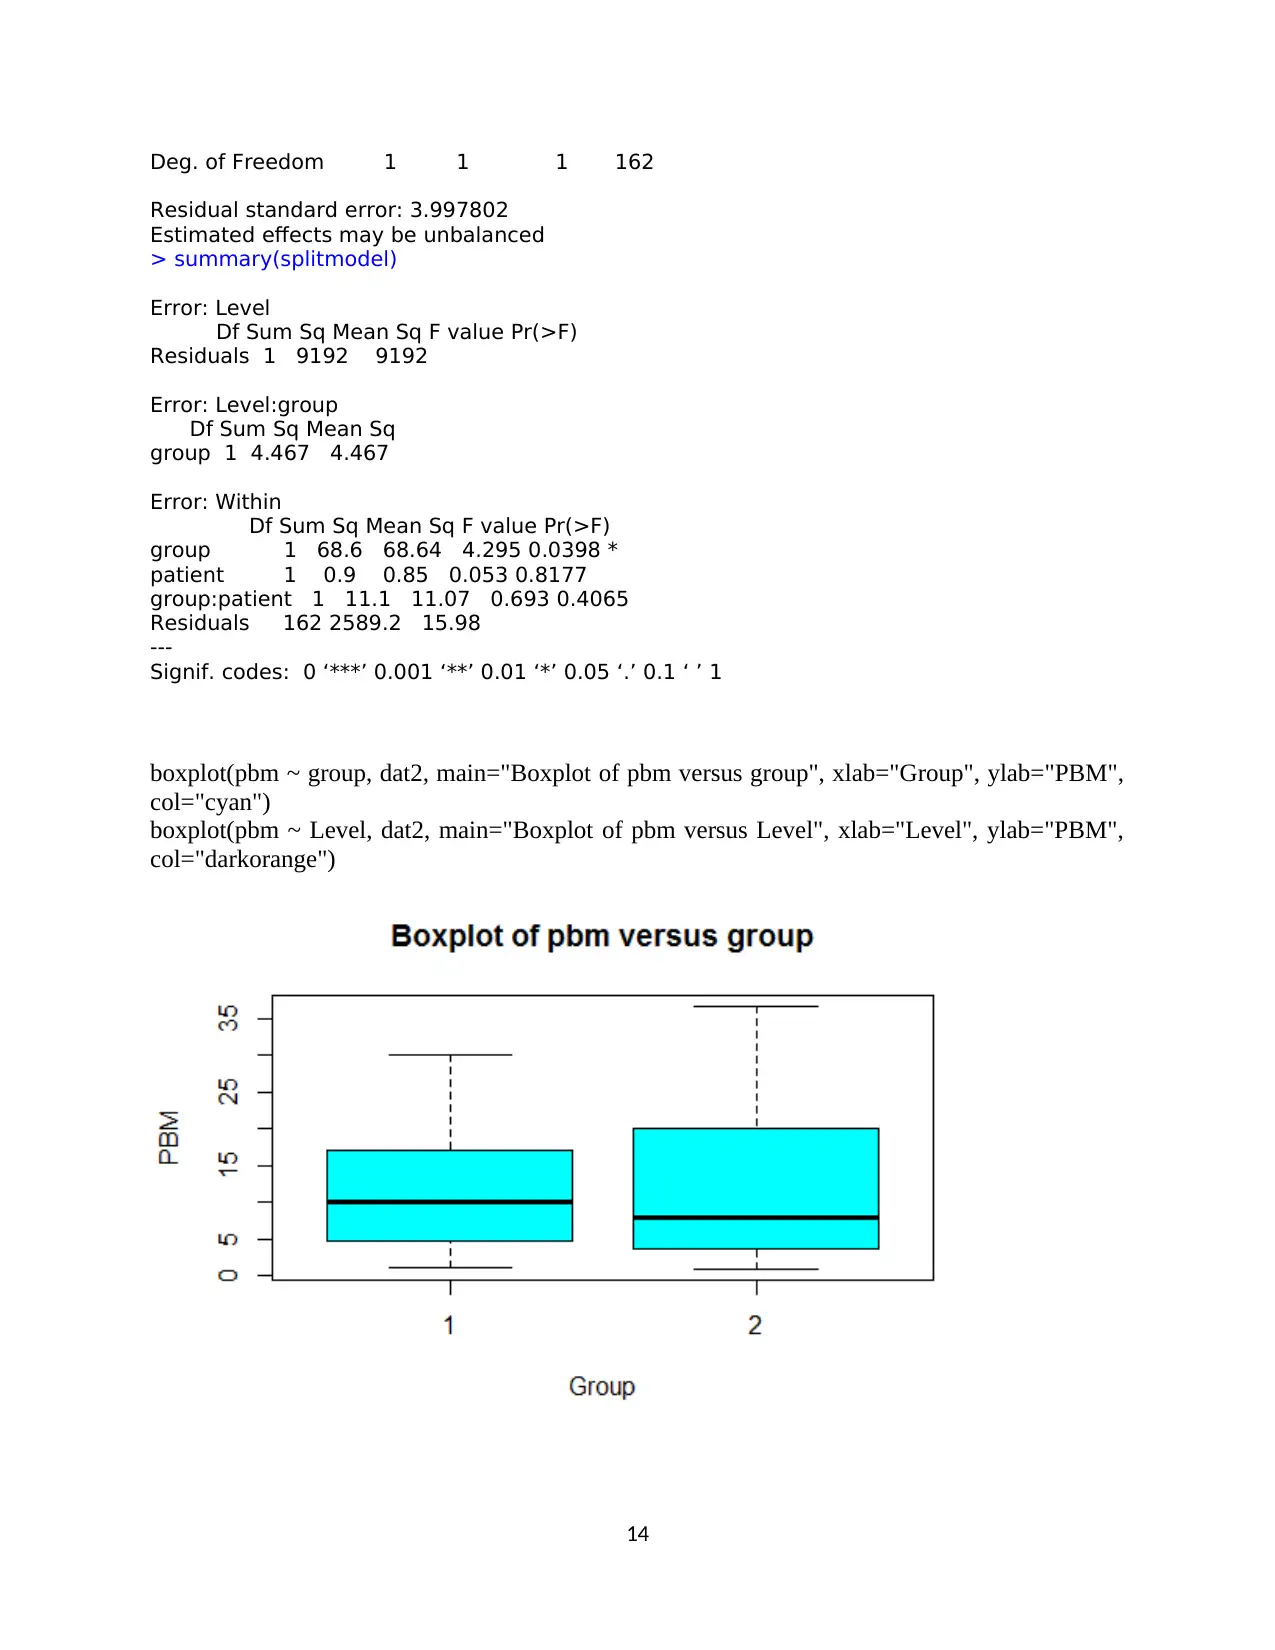
Deg. of Freedom 1 1 1 162
Residual standard error: 3.997802
Estimated effects may be unbalanced
> summary(splitmodel)
Error: Level
Df Sum Sq Mean Sq F value Pr(>F)
Residuals 1 9192 9192
Error: Level:group
Df Sum Sq Mean Sq
group 1 4.467 4.467
Error: Within
Df Sum Sq Mean Sq F value Pr(>F)
group 1 68.6 68.64 4.295 0.0398 *
patient 1 0.9 0.85 0.053 0.8177
group:patient 1 11.1 11.07 0.693 0.4065
Residuals 162 2589.2 15.98
---
Signif. codes: 0 ‘***’ 0.001 ‘**’ 0.01 ‘*’ 0.05 ‘.’ 0.1 ‘ ’ 1
boxplot(pbm ~ group, dat2, main="Boxplot of pbm versus group", xlab="Group", ylab="PBM",
col="cyan")
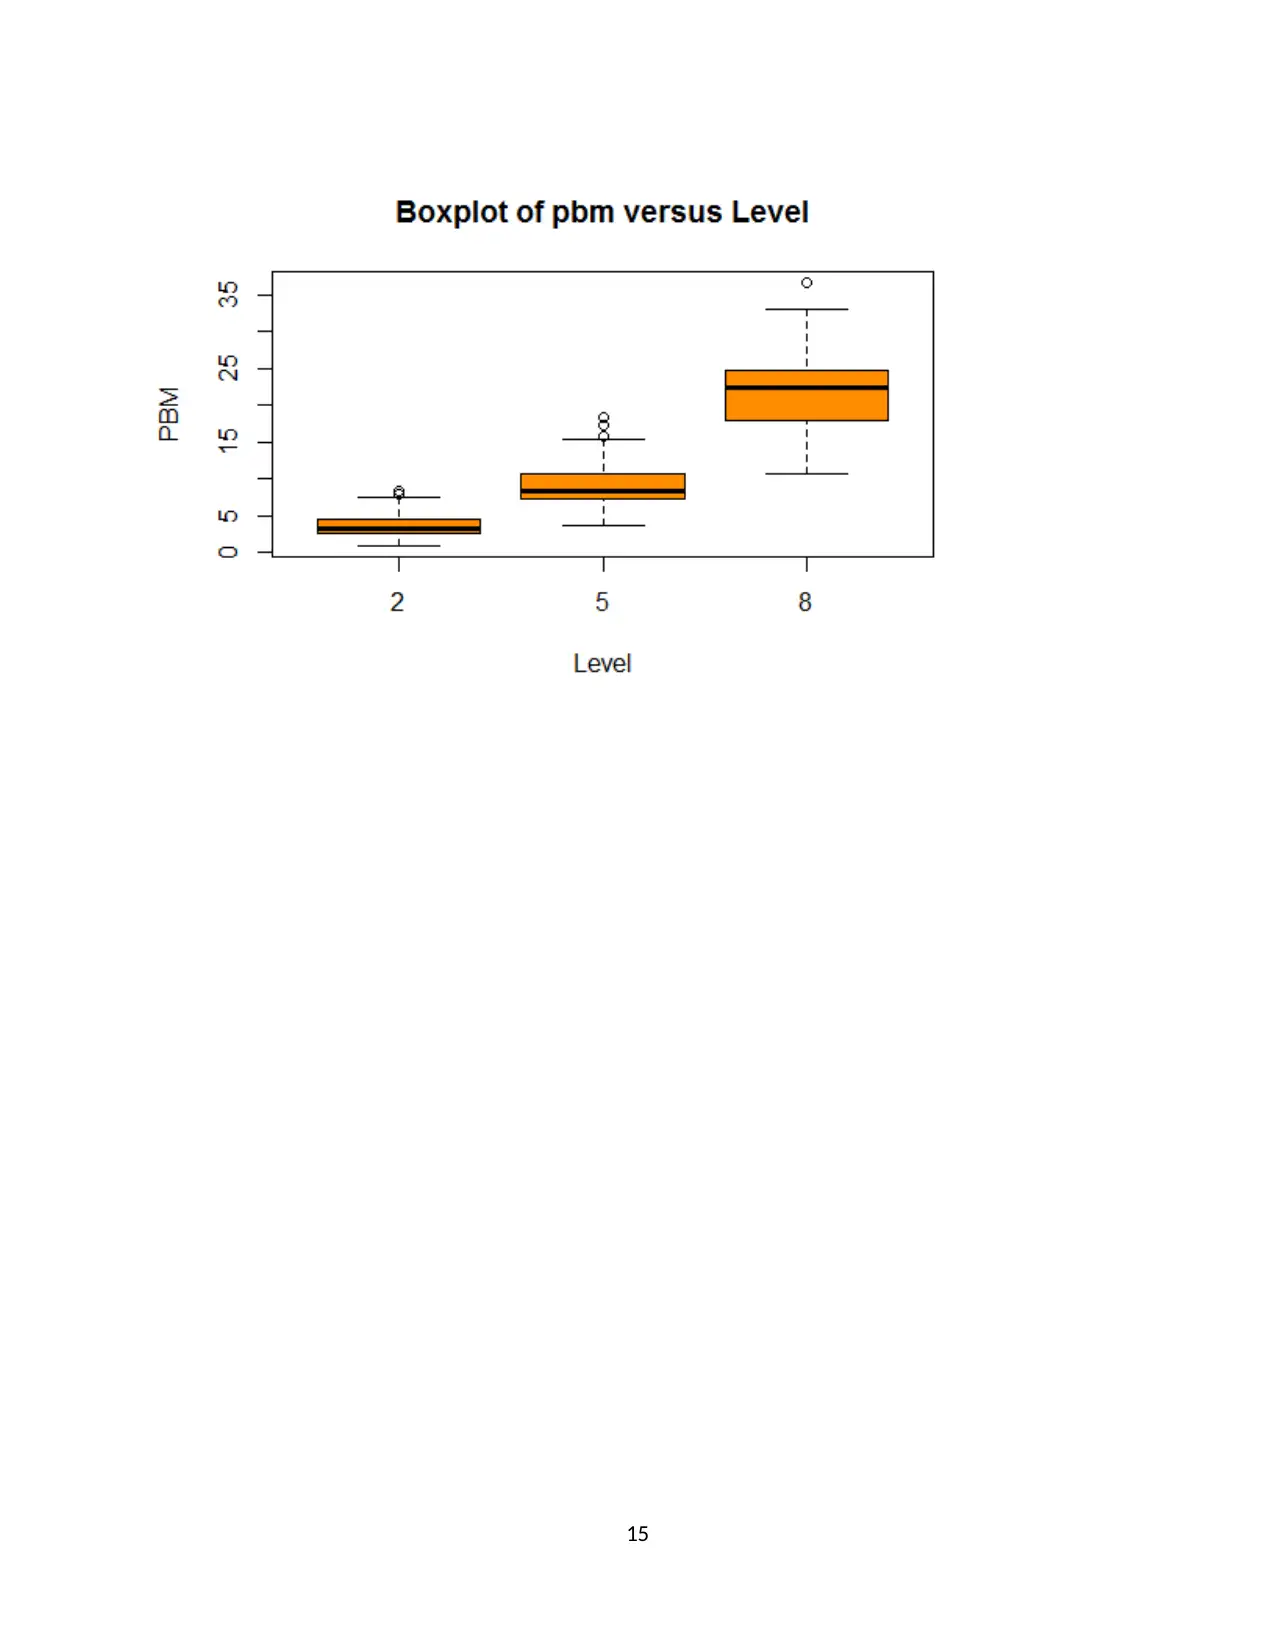
boxplot(pbm ~ Level, dat2, main="Boxplot of pbm versus Level", xlab="Level", ylab="PBM",
col="darkorange")
14
Residual standard error: 3.997802
Estimated effects may be unbalanced
> summary(splitmodel)
Error: Level
Df Sum Sq Mean Sq F value Pr(>F)
Residuals 1 9192 9192
Error: Level:group
Df Sum Sq Mean Sq
group 1 4.467 4.467
Error: Within
Df Sum Sq Mean Sq F value Pr(>F)
group 1 68.6 68.64 4.295 0.0398 *
patient 1 0.9 0.85 0.053 0.8177
group:patient 1 11.1 11.07 0.693 0.4065
Residuals 162 2589.2 15.98
---
Signif. codes: 0 ‘***’ 0.001 ‘**’ 0.01 ‘*’ 0.05 ‘.’ 0.1 ‘ ’ 1
boxplot(pbm ~ group, dat2, main="Boxplot of pbm versus group", xlab="Group", ylab="PBM",
col="cyan")
boxplot(pbm ~ Level, dat2, main="Boxplot of pbm versus Level", xlab="Level", ylab="PBM",
col="darkorange")
14
15
1 out of 15
Your All-in-One AI-Powered Toolkit for Academic Success.
+13062052269
info@desklib.com
Available 24*7 on WhatsApp / Email
![[object Object]](/_next/static/media/star-bottom.7253800d.svg)
Unlock your academic potential
© 2024 | Zucol Services PVT LTD | All rights reserved.