Financial Performance of A Plc: Detailed Ratio and Investment Analysis

Verified

Added on  2023/06/11

|10
|1854
|417
Report
AI Summary
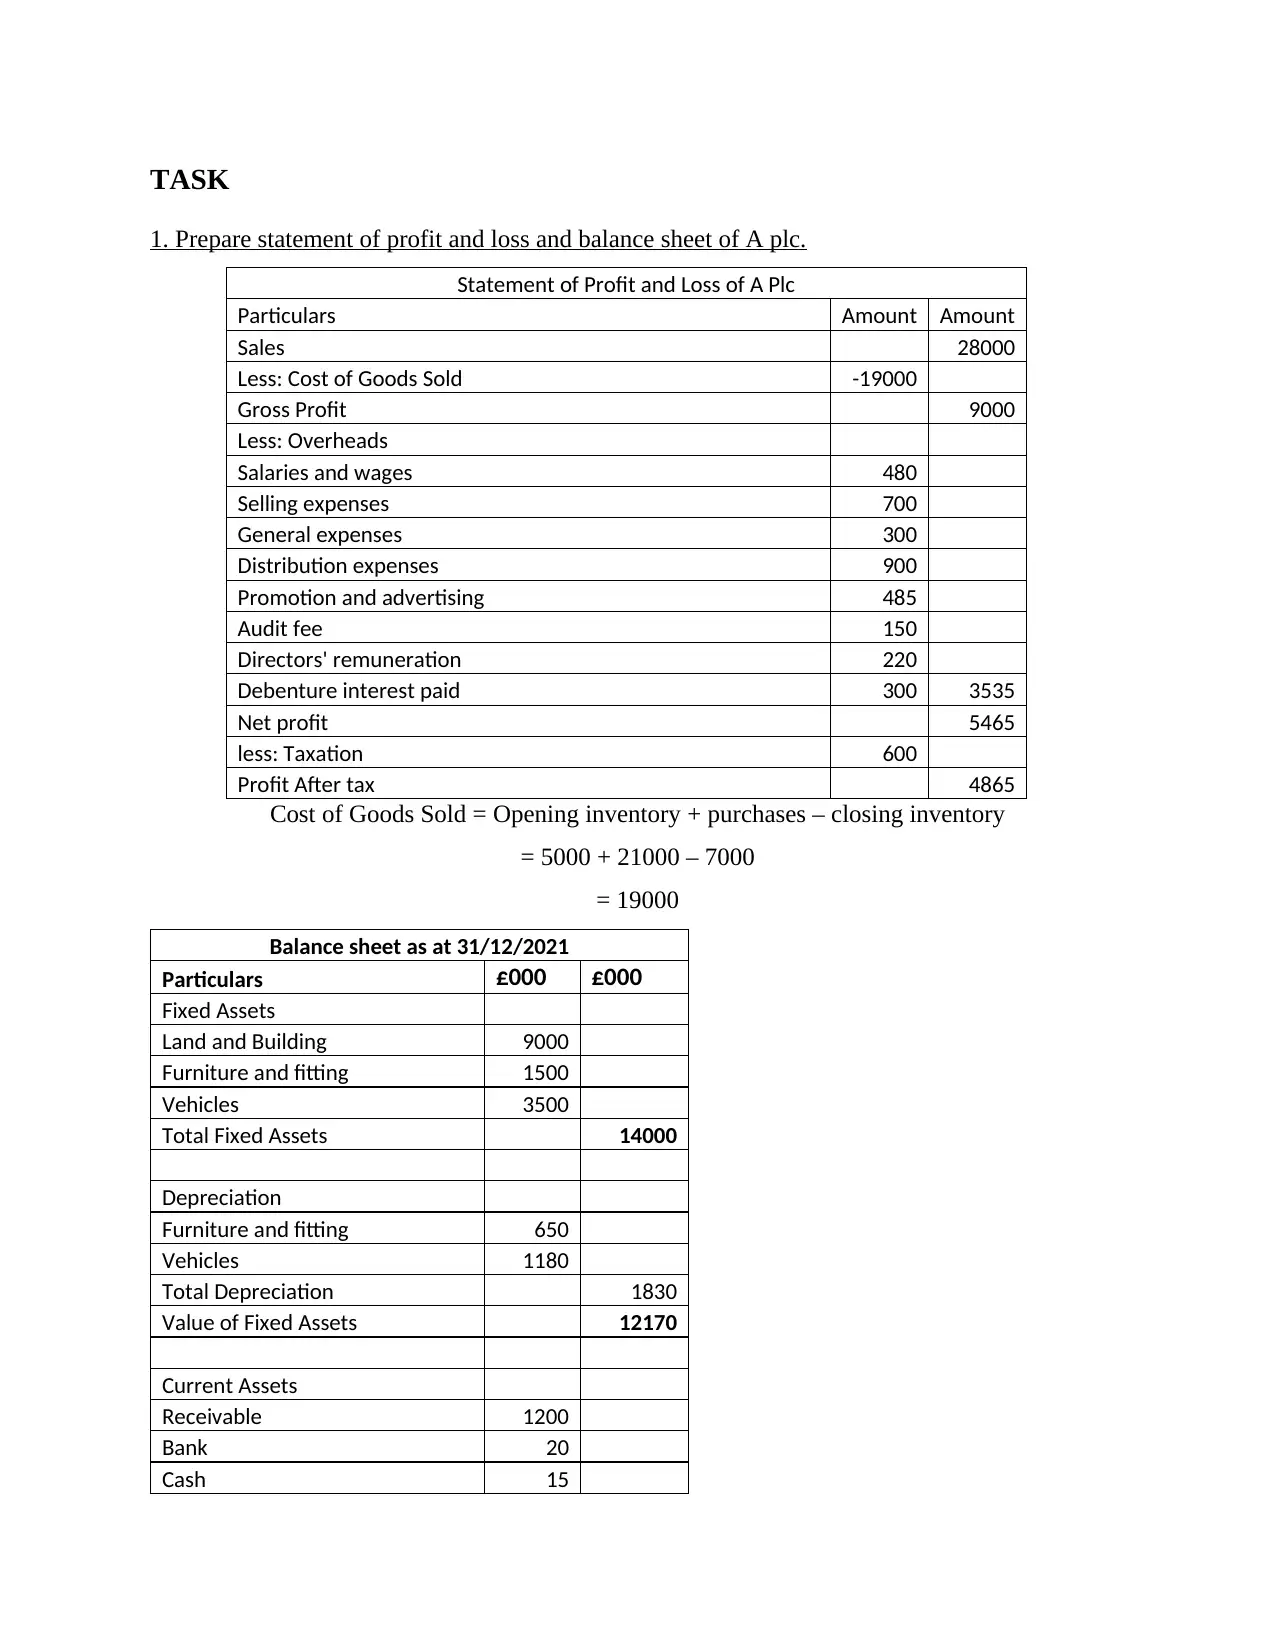
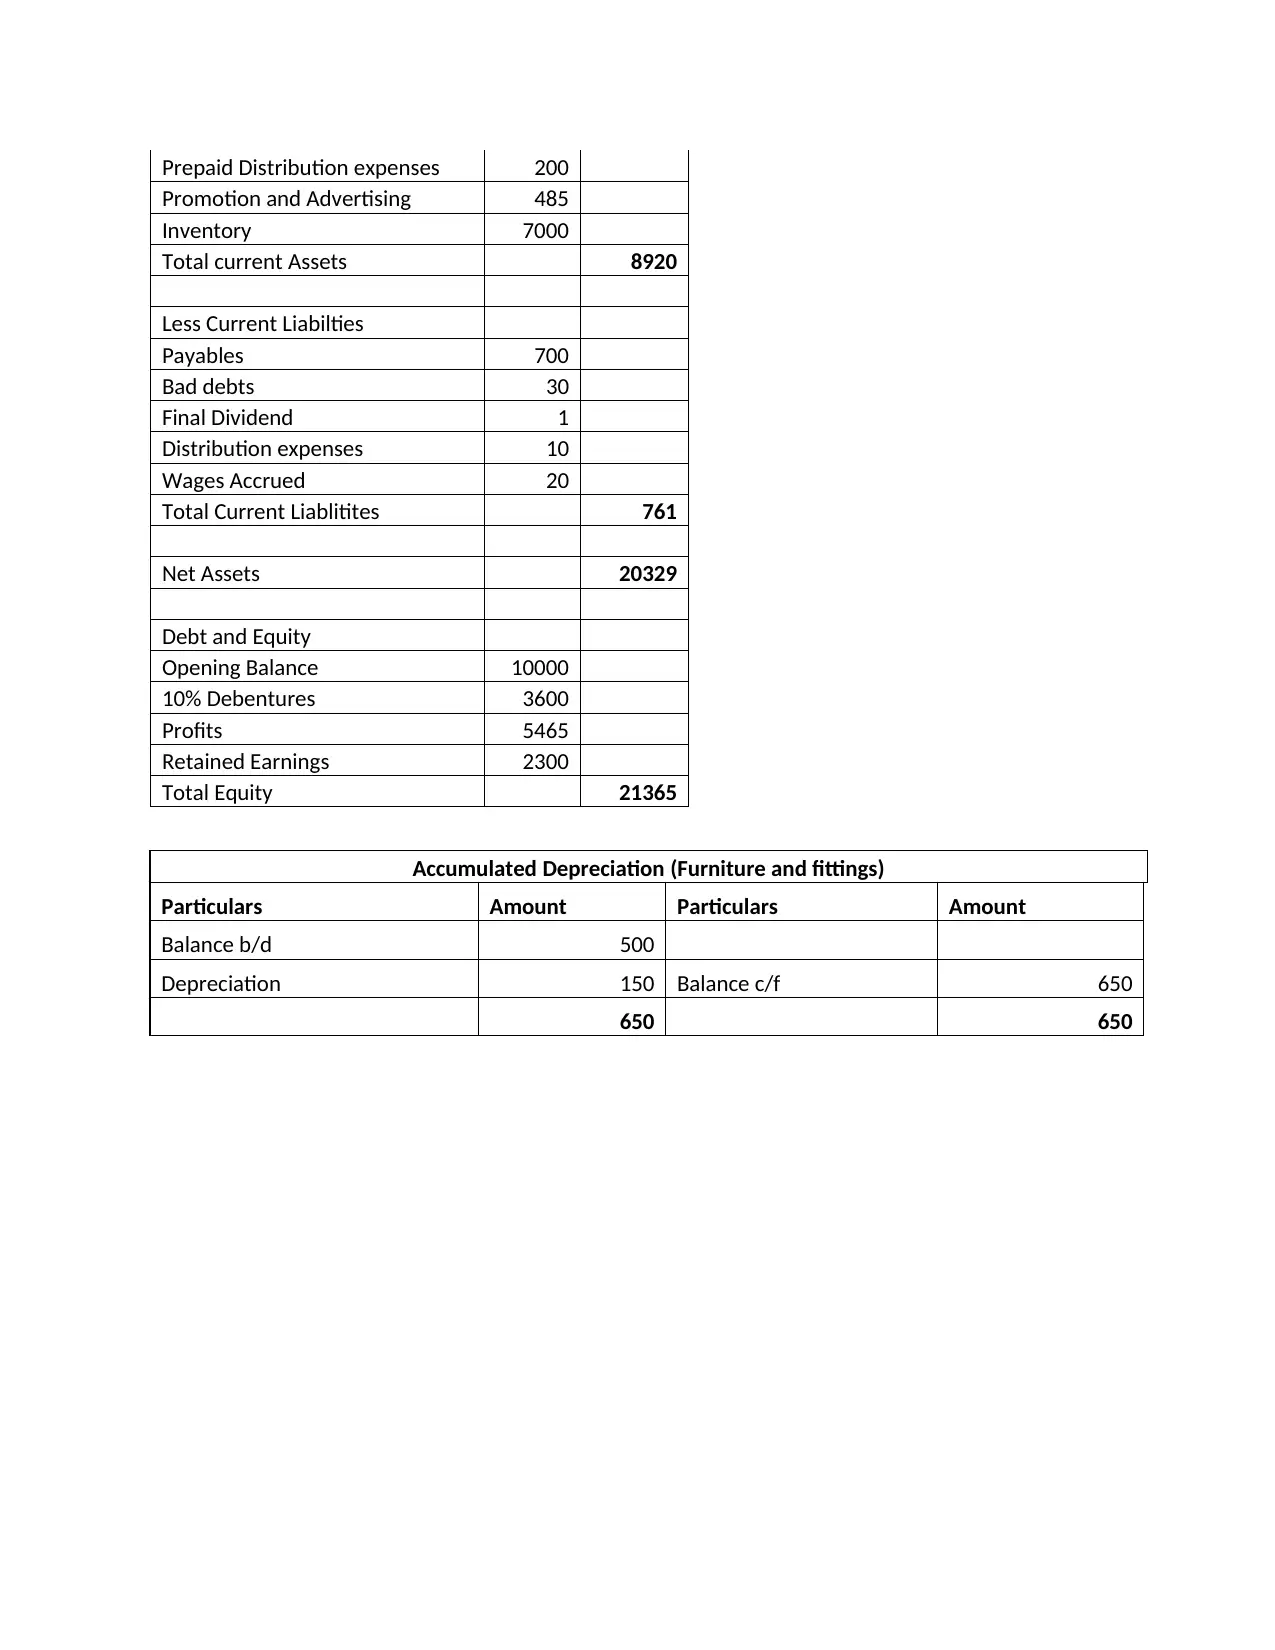
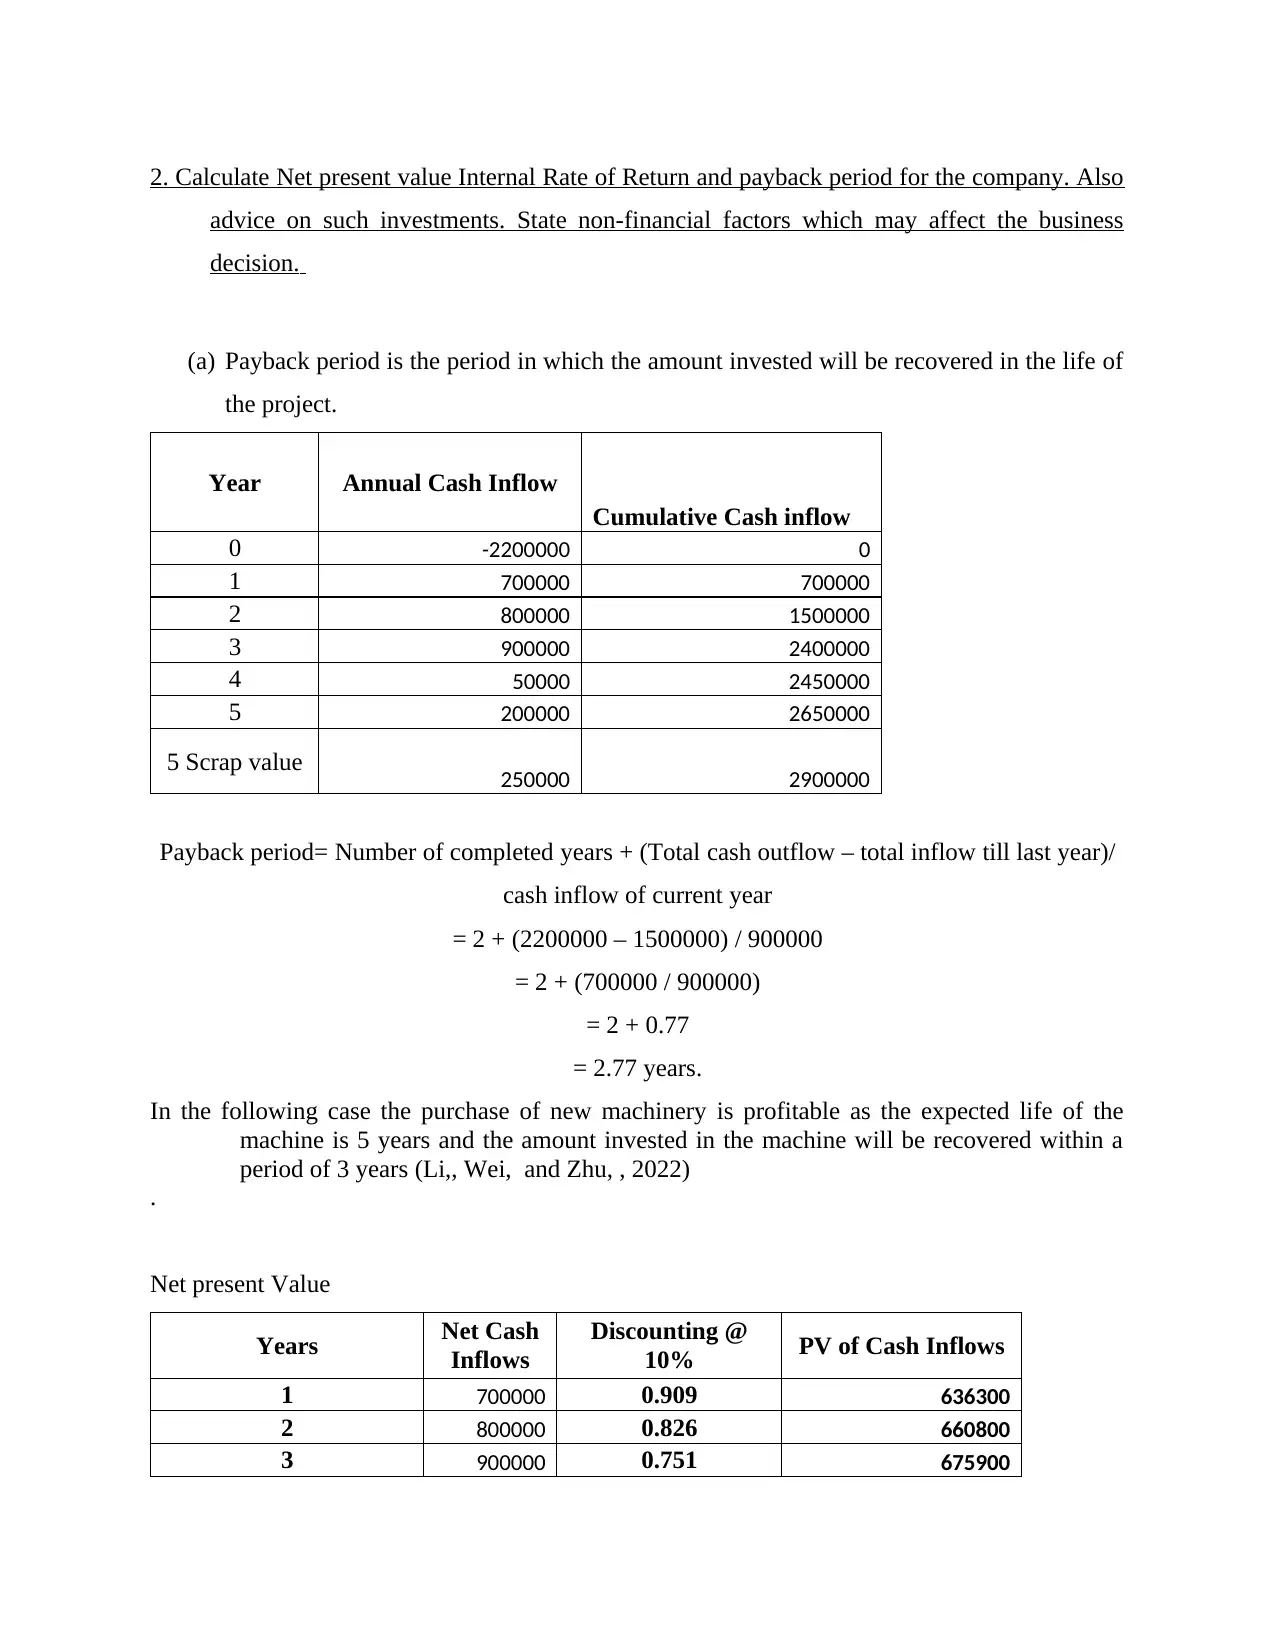
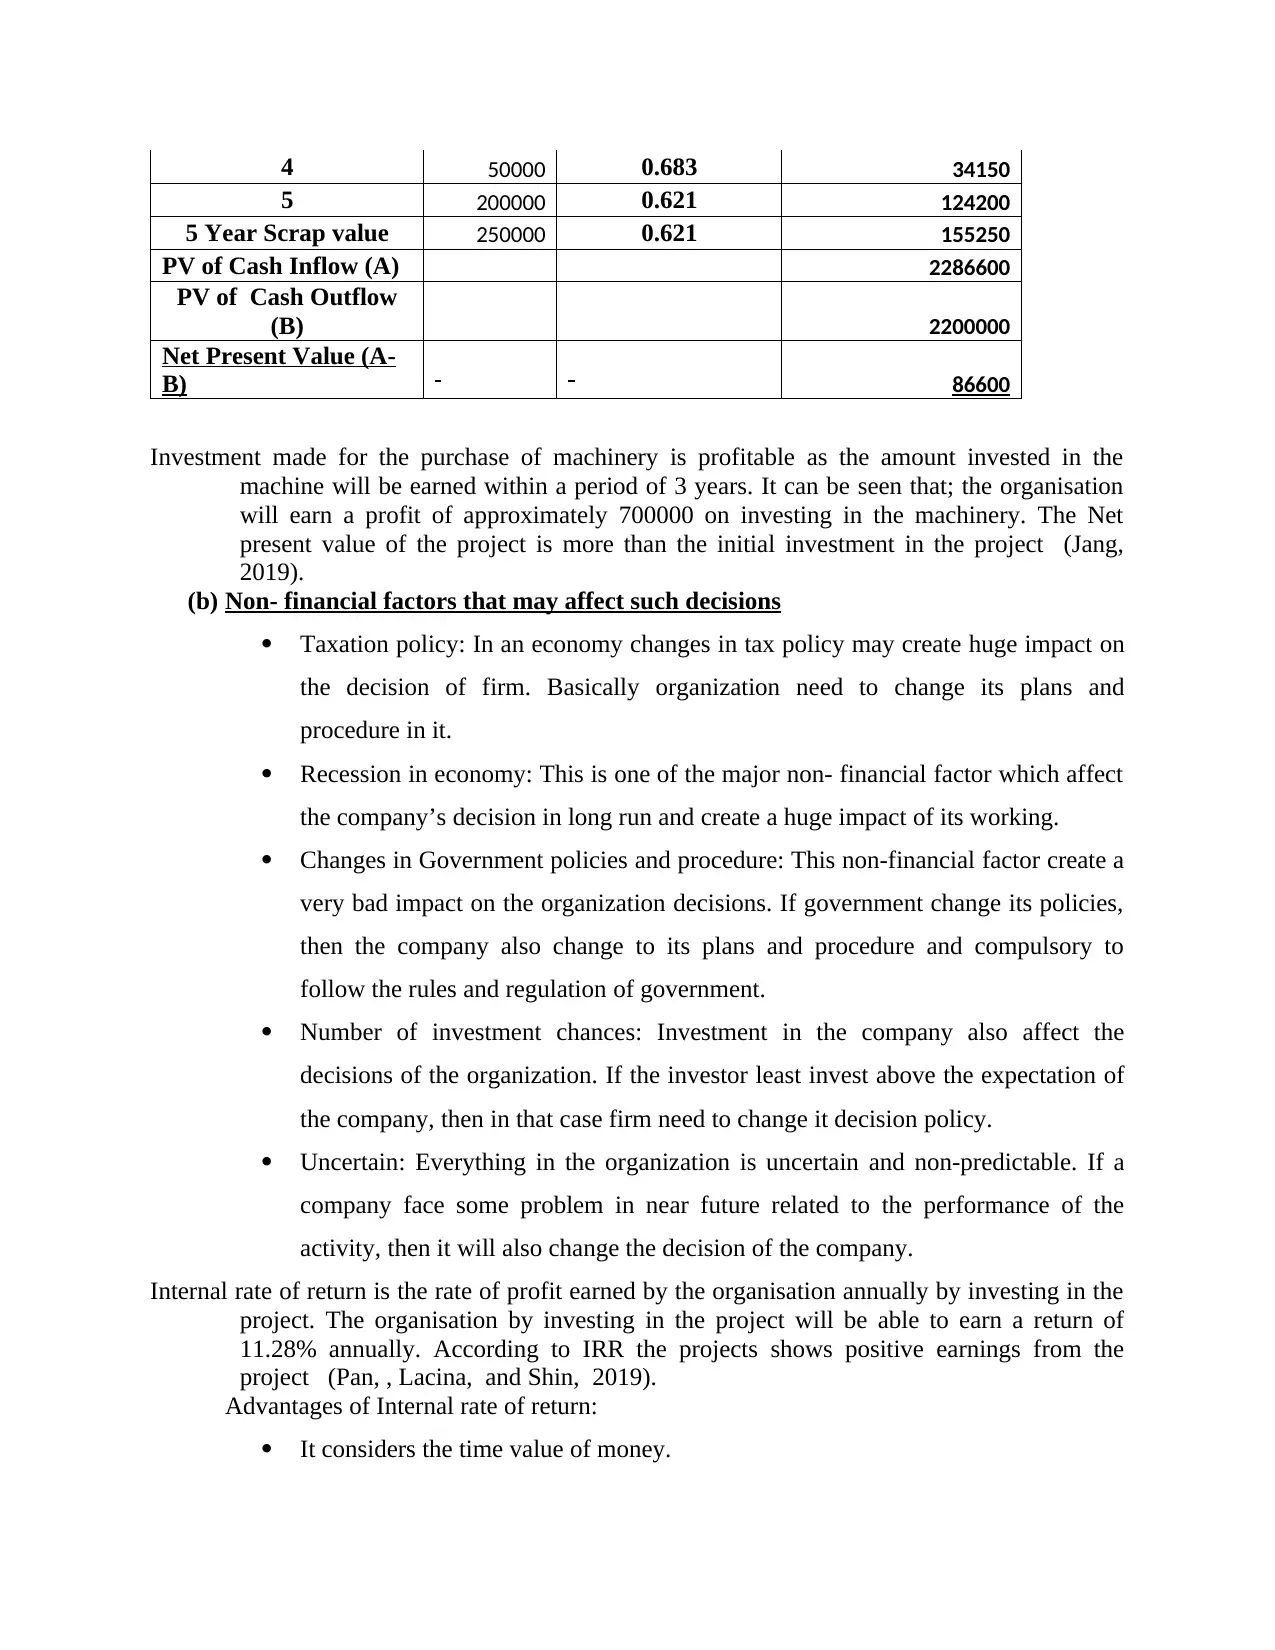
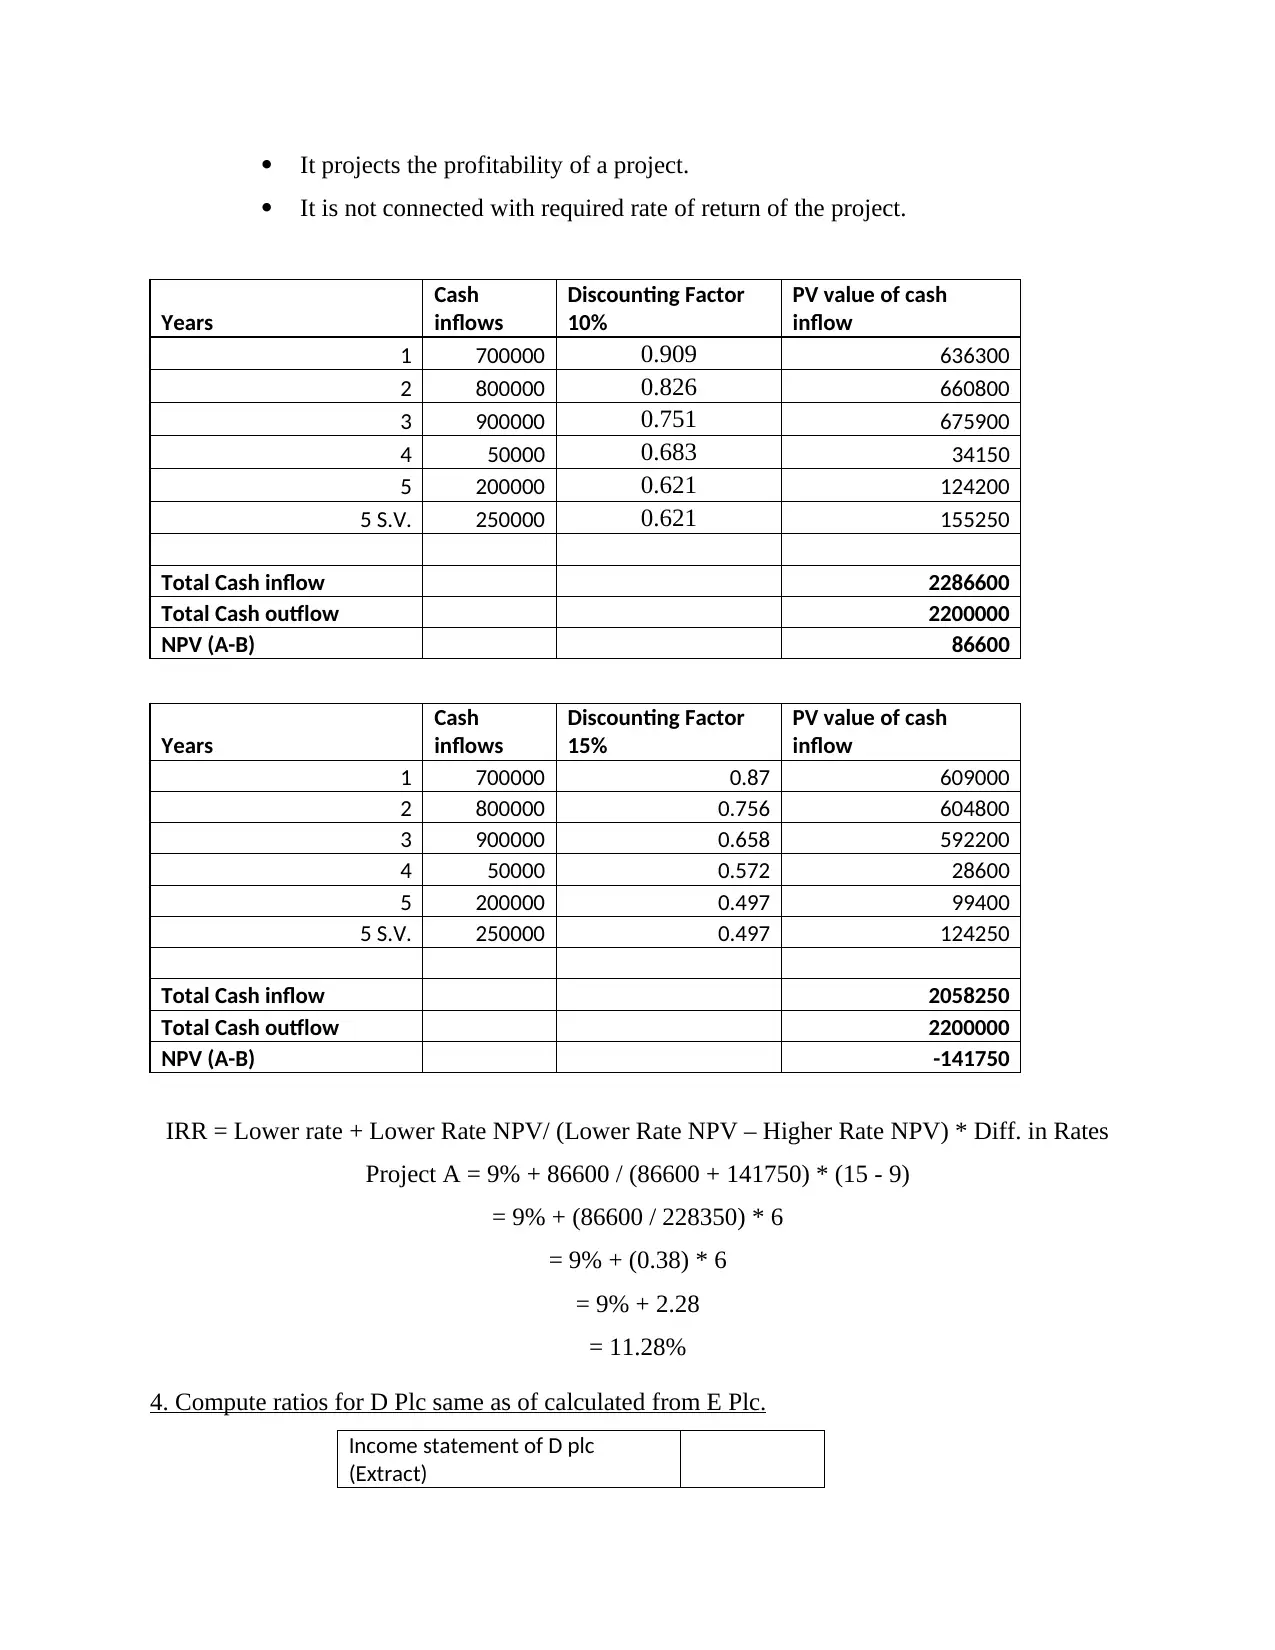
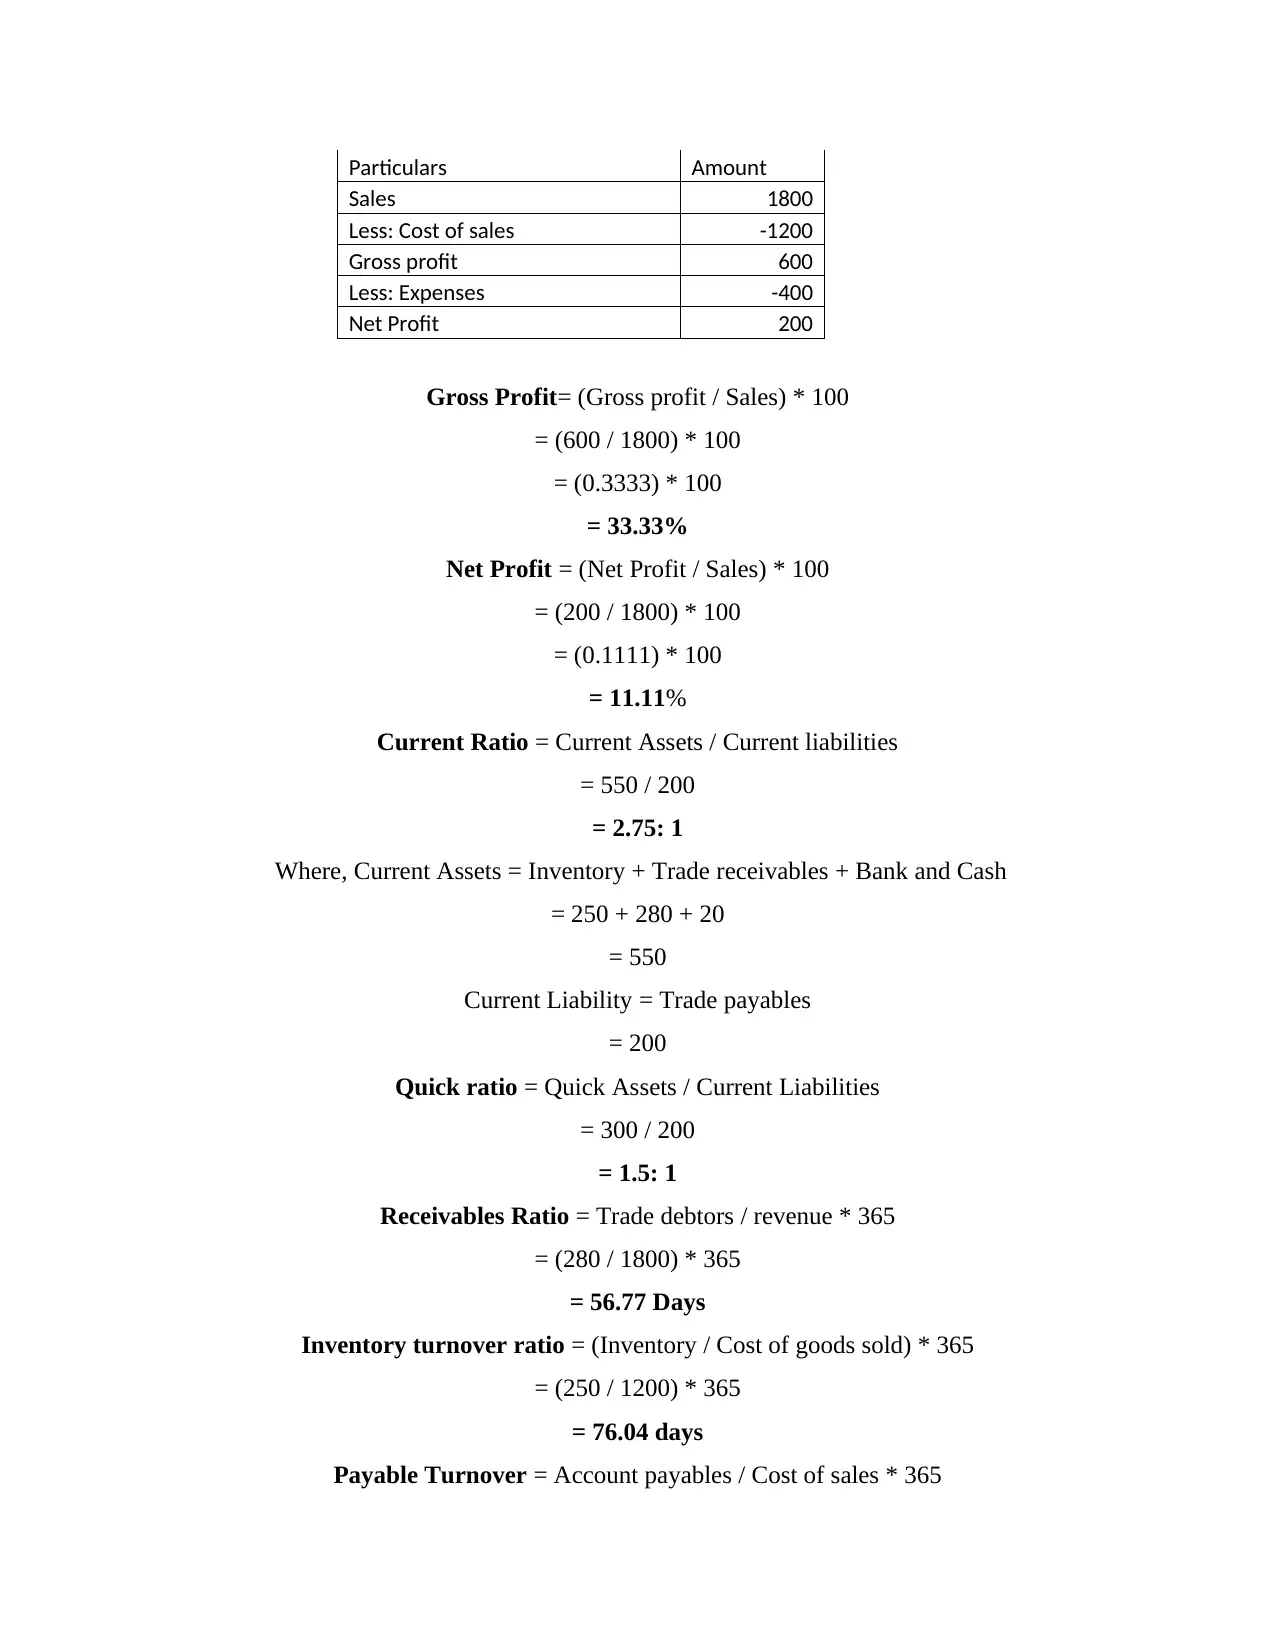
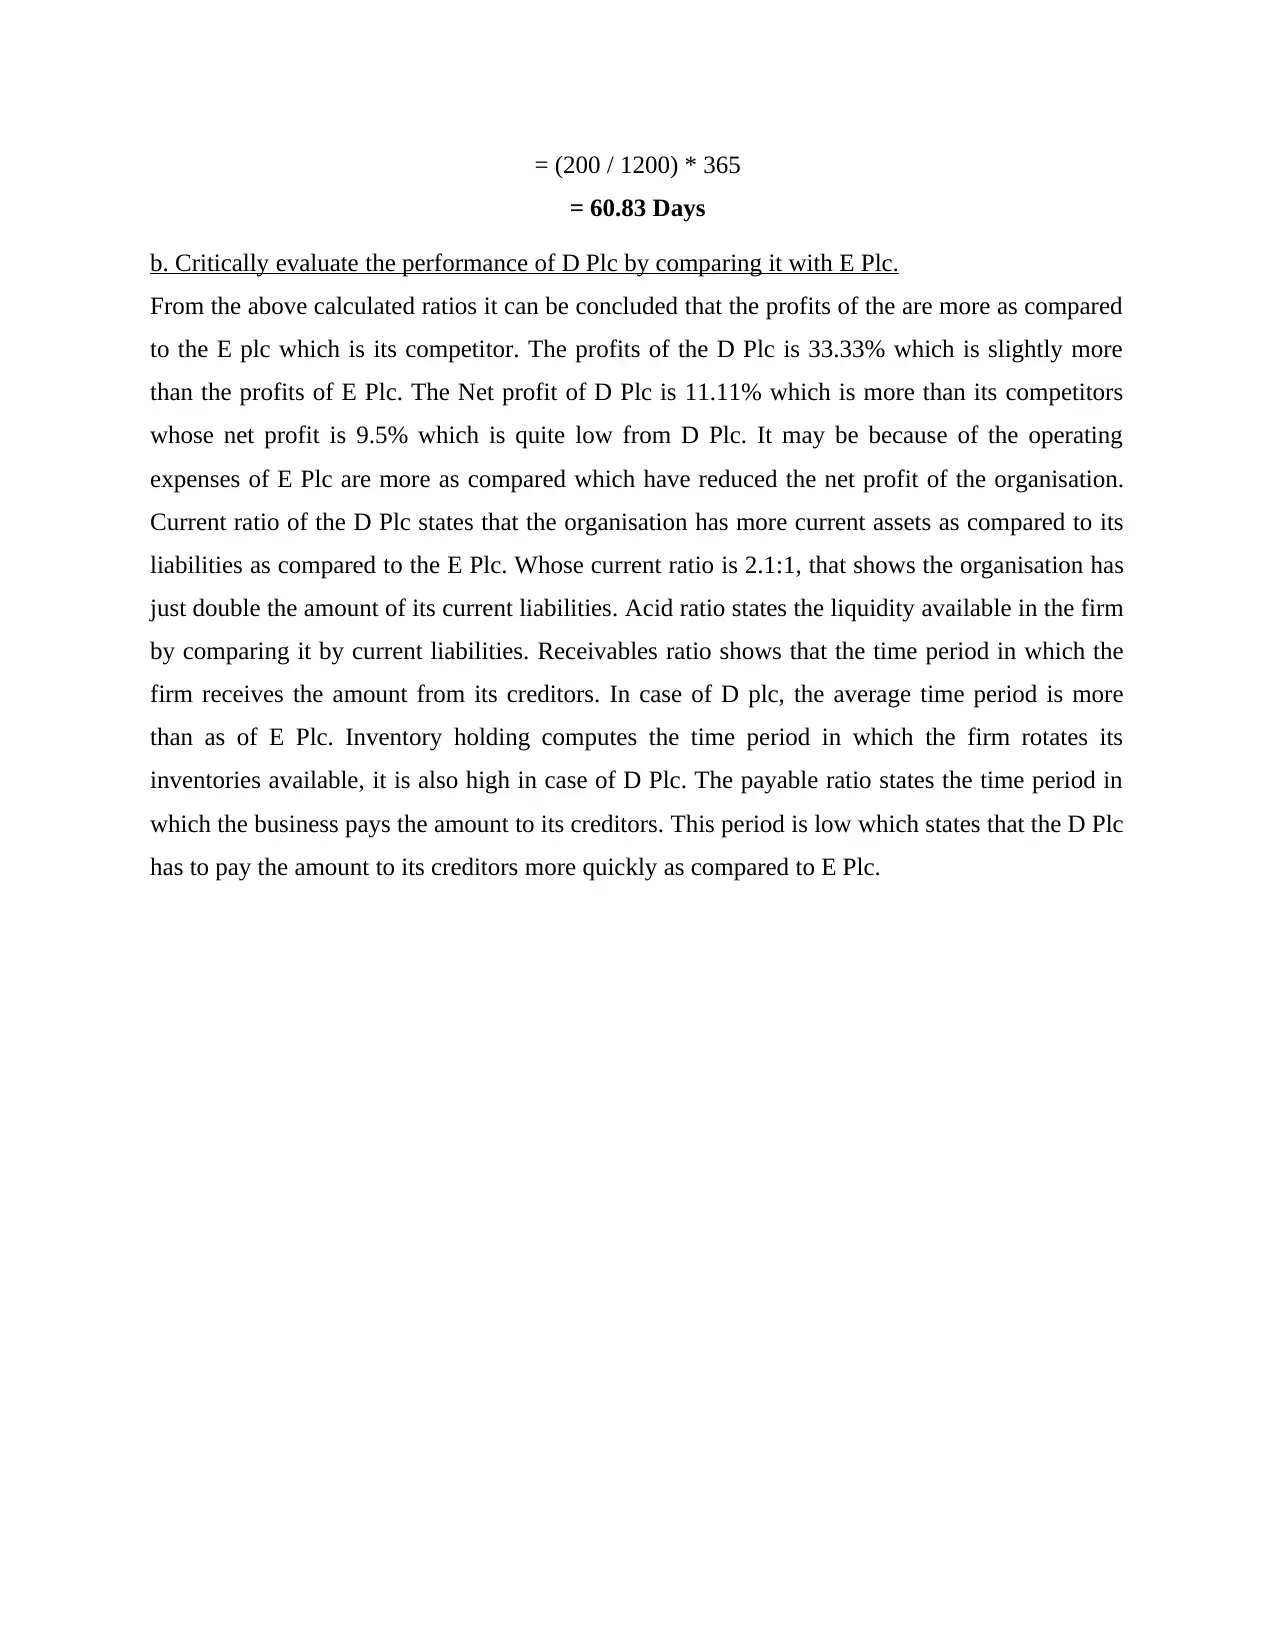
This assignment provides a comprehensive financial analysis of A Plc, including the preparation of an income statement and balance sheet. It calculates key investment metrics such as Net Present Value (NPV), Internal Rate of Return (IRR), and payback period to advise on investment decisions, also considering non-financial factors. Furthermore, the report computes financial ratios for D Plc and critically evaluates its performance by comparing it with E Plc, focusing on profitability, liquidity, and efficiency ratios. The analysis includes detailed calculations for gross profit margin, net profit margin, current ratio, quick ratio, receivables ratio, inventory turnover ratio, and payable turnover ratio, providing a thorough assessment of the companies' financial health and competitive positioning.
tabler-icon-diamond-filled.svg

Contribute Materials

Your contribution can guide someone’s learning journey. Share your documents today.
Document Page
INCOME
STATEMENET AND
INCOME
STATEMENT
FINANCIAL
Contents
tabler-icon-diamond-filled.svg

Secure Best Marks with AI Grader

Need help grading? Try our AI Grader for instant feedback on your assignments.
Document Page
TASK...............................................................................................................................................3
1. Prepare statement of profit and loss and balance sheet of A plc.............................................3
2. Calculate Net present value Internal Rate of Return and payback period for the company.
Also advice on such investments. State non-financial factors which may affect the business
decision........................................................................................................................................5
4. Compute ratios for D Plc same as of calculated from E Plc....................................................7
b. Critically evaluate the performance of D Plc by comparing it with E Plc..............................9
REFERENCES..............................................................................................................................10
Document Page
TASK
1. Prepare statement of profit and loss and balance sheet of A plc.
Statement of Profit and Loss of A Plc
Particulars Amount Amount
Sales 28000
Less: Cost of Goods Sold -19000
Gross Profit 9000
Less: Overheads
Salaries and wages 480
Selling expenses 700
General expenses 300
Distribution expenses 900
Promotion and advertising 485
Audit fee 150
Directors' remuneration 220
Debenture interest paid 300 3535
Net profit 5465
less: Taxation 600
Profit After tax 4865
Cost of Goods Sold = Opening inventory + purchases – closing inventory
= 5000 + 21000 – 7000
= 19000
Balance sheet as at 31/12/2021
Particulars ÂŁ000 ÂŁ000
Fixed Assets
Land and Building 9000
Furniture and fitting 1500
Vehicles 3500
Total Fixed Assets 14000
Depreciation
Furniture and fitting 650
Vehicles 1180
Total Depreciation 1830
Value of Fixed Assets 12170
Current Assets
Receivable 1200
Bank 20
Cash 15
Document Page
Prepaid Distribution expenses 200
Promotion and Advertising 485
Inventory 7000
Total current Assets 8920
Less Current Liabilties
Payables 700
Bad debts 30
Final Dividend 1
Distribution expenses 10
Wages Accrued 20
Total Current Liablitites 761
Net Assets 20329
Debt and Equity
Opening Balance 10000
10% Debentures 3600
Profits 5465
Retained Earnings 2300
Total Equity 21365
Accumulated Depreciation (Furniture and fittings)
Particulars Amount Particulars Amount
Balance b/d 500
Depreciation 150 Balance c/f 650
650 650
tabler-icon-diamond-filled.svg

Secure Best Marks with AI Grader

Need help grading? Try our AI Grader for instant feedback on your assignments.
Document Page
2. Calculate Net present value Internal Rate of Return and payback period for the company. Also
advice on such investments. State non-financial factors which may affect the business
decision.
(a) Payback period is the period in which the amount invested will be recovered in the life of
the project.
Year Annual Cash Inflow
Cumulative Cash inflow
0 -2200000 0
1 700000 700000
2 800000 1500000
3 900000 2400000
4 50000 2450000
5 200000 2650000
5 Scrap value 250000 2900000
Payback period= Number of completed years + (Total cash outflow – total inflow till last year)/
cash inflow of current year
= 2 + (2200000 – 1500000) / 900000
= 2 + (700000 / 900000)
= 2 + 0.77
= 2.77 years.
In the following case the purchase of new machinery is profitable as the expected life of the
machine is 5 years and the amount invested in the machine will be recovered within a
period of 3 years (Li,, Wei, and Zhu, , 2022)
.
Net present Value
Years Net Cash
Inflows
Discounting @
10% PV of Cash Inflows
1 700000 0.909 636300
2 800000 0.826 660800
3 900000 0.751 675900
Document Page
4 50000 0.683 34150
5 200000 0.621 124200
5 Year Scrap value 250000 0.621 155250
PV of Cash Inflow (A) 2286600
PV of Cash Outflow
(B) 2200000
Net Present Value (A-
B) 86600
Investment made for the purchase of machinery is profitable as the amount invested in the
machine will be earned within a period of 3 years. It can be seen that; the organisation
will earn a profit of approximately 700000 on investing in the machinery. The Net
present value of the project is more than the initial investment in the project (Jang,
2019).
(b) Non- financial factors that may affect such decisions
ď‚· Taxation policy: In an economy changes in tax policy may create huge impact on
the decision of firm. Basically organization need to change its plans and
procedure in it.
ď‚· Recession in economy: This is one of the major non- financial factor which affect
the company’s decision in long run and create a huge impact of its working.
ď‚· Changes in Government policies and procedure: This non-financial factor create a
very bad impact on the organization decisions. If government change its policies,
then the company also change to its plans and procedure and compulsory to
follow the rules and regulation of government.
ď‚· Number of investment chances: Investment in the company also affect the
decisions of the organization. If the investor least invest above the expectation of
the company, then in that case firm need to change it decision policy.
ď‚· Uncertain: Everything in the organization is uncertain and non-predictable. If a
company face some problem in near future related to the performance of the
activity, then it will also change the decision of the company.
Internal rate of return is the rate of profit earned by the organisation annually by investing in the
project. The organisation by investing in the project will be able to earn a return of
11.28% annually. According to IRR the projects shows positive earnings from the
project (Pan, , Lacina, and Shin, 2019).
Advantages of Internal rate of return:
ď‚· It considers the time value of money.
Document Page
ď‚· It projects the profitability of a project.
ď‚· It is not connected with required rate of return of the project.
Years
Cash
inflows
Discounting Factor
10%
PV value of cash
inflow
1 700000 0.909 636300
2 800000 0.826 660800
3 900000 0.751 675900
4 50000 0.683 34150
5 200000 0.621 124200
5 S.V. 250000 0.621 155250
Total Cash inflow 2286600
Total Cash outflow 2200000
NPV (A-B) 86600
Years
Cash
inflows
Discounting Factor
15%
PV value of cash
inflow
1 700000 0.87 609000
2 800000 0.756 604800
3 900000 0.658 592200
4 50000 0.572 28600
5 200000 0.497 99400
5 S.V. 250000 0.497 124250
Total Cash inflow 2058250
Total Cash outflow 2200000
NPV (A-B) -141750
IRR = Lower rate + Lower Rate NPV/ (Lower Rate NPV – Higher Rate NPV) * Diff. in Rates
Project A = 9% + 86600 / (86600 + 141750) * (15 - 9)
= 9% + (86600 / 228350) * 6
= 9% + (0.38) * 6
= 9% + 2.28
= 11.28%
4. Compute ratios for D Plc same as of calculated from E Plc.
Income statement of D plc
(Extract)
tabler-icon-diamond-filled.svg

Paraphrase This Document

Need a fresh take? Get an instant paraphrase of this document with our AI Paraphraser
Document Page
Particulars Amount
Sales 1800
Less: Cost of sales -1200
Gross profit 600
Less: Expenses -400
Net Profit 200
Gross Profit= (Gross profit / Sales) * 100
= (600 / 1800) * 100
= (0.3333) * 100
= 33.33%
Net Profit = (Net Profit / Sales) * 100
= (200 / 1800) * 100
= (0.1111) * 100
= 11.11%
Current Ratio = Current Assets / Current liabilities
= 550 / 200
= 2.75: 1
Where, Current Assets = Inventory + Trade receivables + Bank and Cash
= 250 + 280 + 20
= 550
Current Liability = Trade payables
= 200
Quick ratio = Quick Assets / Current Liabilities
= 300 / 200
= 1.5: 1
Receivables Ratio = Trade debtors / revenue * 365
= (280 / 1800) * 365
= 56.77 Days
Inventory turnover ratio = (Inventory / Cost of goods sold) * 365
= (250 / 1200) * 365
= 76.04 days
Payable Turnover = Account payables / Cost of sales * 365
Document Page
= (200 / 1200) * 365
= 60.83 Days
b. Critically evaluate the performance of D Plc by comparing it with E Plc.
From the above calculated ratios it can be concluded that the profits of the are more as compared
to the E plc which is its competitor. The profits of the D Plc is 33.33% which is slightly more
than the profits of E Plc. The Net profit of D Plc is 11.11% which is more than its competitors
whose net profit is 9.5% which is quite low from D Plc. It may be because of the operating
expenses of E Plc are more as compared which have reduced the net profit of the organisation.
Current ratio of the D Plc states that the organisation has more current assets as compared to its
liabilities as compared to the E Plc. Whose current ratio is 2.1:1, that shows the organisation has
just double the amount of its current liabilities. Acid ratio states the liquidity available in the firm
by comparing it by current liabilities. Receivables ratio shows that the time period in which the
firm receives the amount from its creditors. In case of D plc, the average time period is more
than as of E Plc. Inventory holding computes the time period in which the firm rotates its
inventories available, it is also high in case of D Plc. The payable ratio states the time period in
which the business pays the amount to its creditors. This period is low which states that the D Plc
has to pay the amount to its creditors more quickly as compared to E Plc.
Document Page
REFERENCES
Books and Journals
Clifton, and et.al., 2019. Target costing: market driven product design. CRC Press.
Jang, G.B., 2019. A Study on Business Stakeholders Identified on Income Statements-
Perspectives from Shareholder Theory, Stakeholder Theory, and the Bible. 17(3), pp.77-
98.
Li, J., Wei, L. and Zhu, X., 2022. Bank Risk Aggregation Based on Income Statement. In
Financial Statements-Based Bank Risk Aggregation (pp. 55-67). Springer, Singapore.
Novianti, T. and Firmansyah, A., 2020. The effect of tax risk, hedging, income smoothing, and
cash flows volatility on firm value. Test Engineering and Management, 83, pp.9675-
9686.
Palupi, A., 2021. Relationship Between Income Smoothing and Earnings Announcement. In
Environmental, Social, and Governance Perspectives on Economic Development in
Asia. Emerald Publishing Limited.
Pan, S., Lacina, M. and Shin, H., 2019. Income classification shifting and financial analysts’
forecasts. Review of Pacific Basin Financial Markets and Policies, 22(02), p.1950010.
Zeng, T., 2018. Relationship between corporate social responsibility and tax avoidance:
international evidence. Social Responsibility Journal.
chevron_up_icon
1 out of 10
circle_padding
hide_on_mobile
zoom_out_icon
logo.png

Your All-in-One AI-Powered Toolkit for Academic Success.

Available 24*7 on WhatsApp / Email

[object Object]