PCR and HPLC: A Detailed Practical Report on Analytical Chemistry
VerifiedAdded on 2023/04/22
|13
|2487
|78
Practical Assignment
AI Summary
This document comprises a practical report detailing the principles, materials, methods, and applications of Polymerase Chain Reaction (PCR) and High-Performance Liquid Chromatography (HPLC). The PCR section explains the DNA amplification process, including initialization, denaturation, annealing, and extension, and discusses the materials required, such as primers, DNA polymerase, and dNTPs. It also covers the interpretation of results using gel electrophoresis. The HPLC section focuses on the separation and analysis of chemical mixtures, specifically aspirin and paracetamol, using a stationary and mobile phase. It describes the components of an HPLC instrument and the calculation of correlation factors. Additionally, the report includes a protocol for analyzing metronidazole using HPLC, detailing the materials, procedure, and discussion of reverse-phase HPLC, mobile phase polarity, and stationary phase non-polarity. This student-contributed assignment is available on Desklib, where students can find similar solved assignments and study resources.
PCR and HPLC 1
PCR AND HPLC
By [Name]
Course
Professor’s Name
Institution
Location of Institution
Date
PCR AND HPLC
By [Name]
Course
Professor’s Name
Institution
Location of Institution
Date
Paraphrase This Document
Need a fresh take? Get an instant paraphrase of this document with our AI Paraphraser
PCR and HPLC 2
1. Practical Report: Polymerase Chain Reaction (PCR)
Introduction
PCR is a technique applied in molecular biology to amplify an individual copy or
substantial copies of DNA. PCR involves 20-40 cycles of temperature changes (Bartholomew et
al., 2016). The process has six steps including initialisation, denaturation, annealing, extension,
final elongation, and final hold. Denaturation step consists in increasing temperatures to separate
the strands in the double helix. During the annealing process, the temperature is lowered to allow
the binding of the primer to the single strands that should undergo amplification. The extension
step involves the introduction of Taq polymerase that catalyses the formation of complementary
strands from the separated helix. This report will discuss the application of PCR in the process of
DNA amplification.
The aim of the Experiment
The objective of the experiment is to amplify (reproduce) the specified segments of DNA
using Polymerase Chain Reactions. The amplicons are useful in several molecular applications
like gel electrophoresis among others.
Materials and Methods
Materials
The materials include primers, DNA polymerase (Taq), DNA template, dNTPs, sterile
water, and magnesium salt (Jalali, Zaborowska, and Jalali, 2017). The primers should be
appropriate to the target DNA. The buffer should also be specific to the Taq polymerase. Other
materials include micropipettes, ethanol resistant marker, thermal cycler, PCR caps, tubes, and
tube rack.
Method
PCR and HPLC 3
Place the well plate into an ice bucket to hold the PCR tubes. The cold conditions prevent
nonspecific priming and nuclease activity (Tung et al., 2015). Pipette the PCR reagents into the
PCR tube which is inside the ice bucket. Add the reagents starting with sterile water, then buffer,
followed by dNTPs, Magnesium salt, primers, and lastly template DNA. Add every reagent in
PCR tube except the DNA template to form the negative control. Close the PCR tubes using their
cups and put them inside the thermal cycler. Start the program after ensuring that the thermal
cycler lid is closed. At the end of the experiment, remove the PCR tubes and store them at 4ºC.
Results
Interpreting the results of the experiment involves loading aliquots of the reactions into
agarose gel wells and staining DNA using ethidium bromide (Hazzalin, and Mahadevan, 2017).
The staining permits the visualisation of amplified DNA through the UV illuminator. The PCR
experiment worked well since the separation of DNA was evident during electrophoresis.
However, the blanks can be due to contamination of DNA or nonspecific amplification.
Discussion
Gel electrophoresis shows whether the experiment was a success or otherwise. The
results indicate successful amplification due to correct adherence to the PCR procedures
(Hazzalin, and Mahadevan, 2017). Contamination of DNA with molecular substances like
proteins, RNA prevents amplification. Primer dimerisation also prevents successful
amplification.
Conclusion
PCR assists in the amplification of DNA strands, and it has six steps. The required
materials for the experiment include a polymerase, sterile water, primers, dNTPs, and
magnesium salt among others. Visualisation of the amplification process involves running the
⊘ This is a preview!⊘
Do you want full access?
Subscribe today to unlock all pages.
Trusted by 1+ million students worldwide

PCR and HPLC 4
products of PCR into gel electrophoresis. Accurate adherence to the procedure yields desirable
results; however, contamination and primer dimerisation can prevent amplification.
products of PCR into gel electrophoresis. Accurate adherence to the procedure yields desirable
results; however, contamination and primer dimerisation can prevent amplification.
Paraphrase This Document
Need a fresh take? Get an instant paraphrase of this document with our AI Paraphraser
PCR and HPLC 5
References
Bartholomew, R.A., Hutchison, J.R., Straub, T.M. and Call, D.R., 2016. PCR, Real-Time PCR,
Digital PCR, and Isothermal Amplification. In Manual of Environmental Microbiology, Fourth
Edition (pp. 2-3). doi:10.1128/9781555818821
Hazzalin, C.A. and Mahadevan, L.C., 2017. Acid-Urea Gel Electrophoresis and Western
Blotting of Histones. In Histones (pp. 173-198).
Jalali, M., Zaborowska, J. and Jalali, M., 2017. The Polymerase Chain Reaction: PCR, qPCR,
and RT-PCR. In Basic Science Methods for Clinical Researchers (pp. 1-18). Academic Press.
Tung, J.S., Daugherty, B.L., O'Neill, L., Law, S.W., Han, J. and Mark, G.E., 2015. PCR
Amplification of Specific Sequences. PCR Technology: Principles and Applications for DNA
Amplification, p.99.
PCR and HPLC 6
1. Practical Report: High Performance Liquid Chromatography (HPLC)
Introduction
HPLC is an analytical chemistry technique used to identify, separate, or quantify the
components of a given mixture (Skoog, Holler, and Crouch, 2017). The procedure depends on a
pump which passes a pressurised combination of solvent (mobile phase) and a sample mixture
through the stationary phase. Each constituent of the mixture interacts differently with the
stationary phase according to its physical characteristics. The non-similar interaction between the
components of the mixture and the stationary phase leads to different rates of flow; hence,
causing separation. HPLC is an upgrade of the liquid chromatography due to the application of
pressure.
The aim of the Experiment
The objective of the experiment is to analyse a mixture of Asprin and Paracetamol using
HPLC. The difference in the physical and chemical characteristics of the two drugs facilitates
their separation by HPLC. Researchers can analyse their properties after separation.
Materials and Methods
Materials
The stationary phase, mobile phase, and components of the mixture to undergo separation
( Asprin and Paracetamol). Other materials are the components of the HPLC instrument
including solvent reservoirs, eluent, detector, column, sample injection loop, and high-pressure
pump (Ismail, 2017). The stationary phase is a column filled with beads which are solid
adsorbent material. The mobile phase consists of a solvent and a mixture of components
undergoing separation.
Method
⊘ This is a preview!⊘
Do you want full access?
Subscribe today to unlock all pages.
Trusted by 1+ million students worldwide
PCR and HPLC 7
Use the control knob to inject the mixture of aspirin, paracetamol, caffeine and solvent
(mobile phase) into the loop. For additional accuracy, repeat the above procedure (Dastkhoon et
al., 2017). Allow the system to run as it separates the constituents of the mixture.
Results
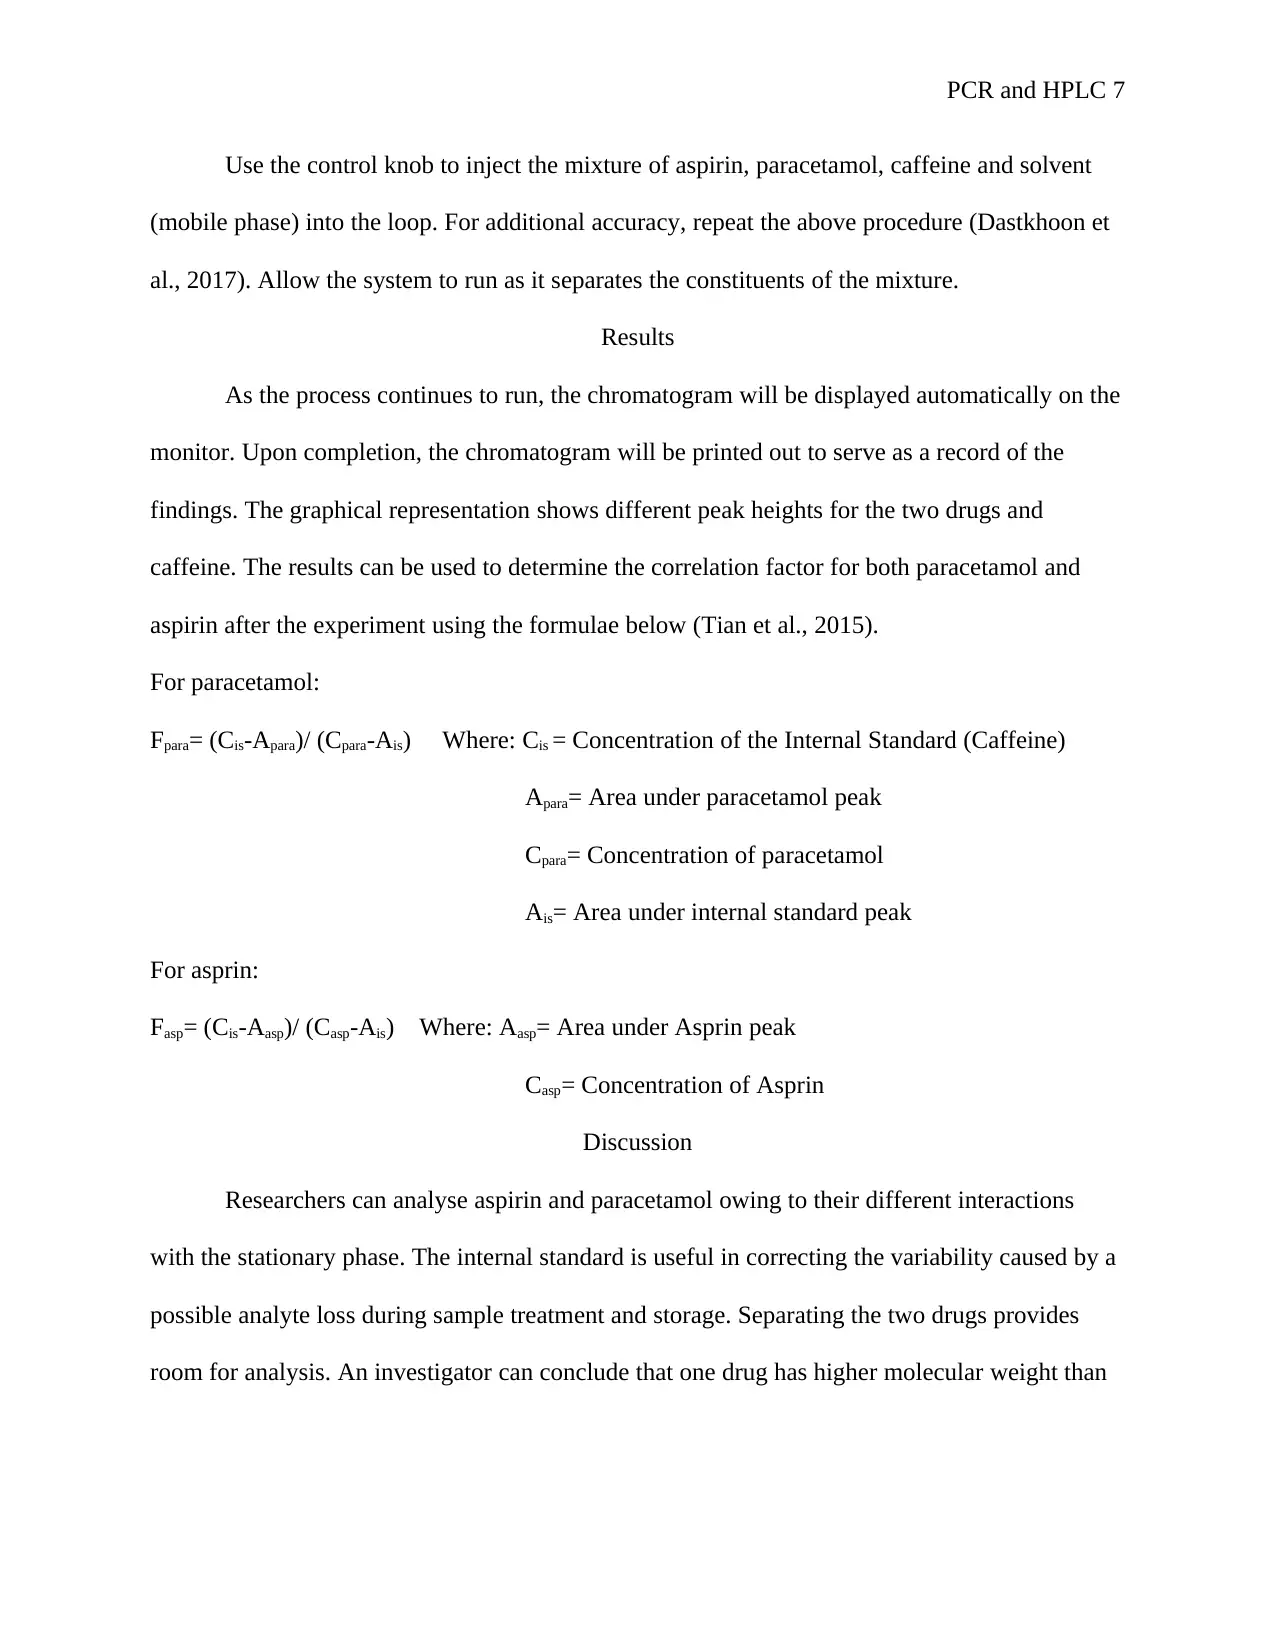
As the process continues to run, the chromatogram will be displayed automatically on the
monitor. Upon completion, the chromatogram will be printed out to serve as a record of the
findings. The graphical representation shows different peak heights for the two drugs and
caffeine. The results can be used to determine the correlation factor for both paracetamol and
aspirin after the experiment using the formulae below (Tian et al., 2015).
For paracetamol:
Fpara= (Cis-Apara)/ (Cpara-Ais) Where: Cis = Concentration of the Internal Standard (Caffeine)
Apara= Area under paracetamol peak
Cpara= Concentration of paracetamol
Ais= Area under internal standard peak
For asprin:
Fasp= (Cis-Aasp)/ (Casp-Ais) Where: Aasp= Area under Asprin peak
Casp= Concentration of Asprin
Discussion
Researchers can analyse aspirin and paracetamol owing to their different interactions
with the stationary phase. The internal standard is useful in correcting the variability caused by a
possible analyte loss during sample treatment and storage. Separating the two drugs provides
room for analysis. An investigator can conclude that one drug has higher molecular weight than
Use the control knob to inject the mixture of aspirin, paracetamol, caffeine and solvent
(mobile phase) into the loop. For additional accuracy, repeat the above procedure (Dastkhoon et
al., 2017). Allow the system to run as it separates the constituents of the mixture.
Results
As the process continues to run, the chromatogram will be displayed automatically on the
monitor. Upon completion, the chromatogram will be printed out to serve as a record of the
findings. The graphical representation shows different peak heights for the two drugs and
caffeine. The results can be used to determine the correlation factor for both paracetamol and
aspirin after the experiment using the formulae below (Tian et al., 2015).
For paracetamol:
Fpara= (Cis-Apara)/ (Cpara-Ais) Where: Cis = Concentration of the Internal Standard (Caffeine)
Apara= Area under paracetamol peak
Cpara= Concentration of paracetamol
Ais= Area under internal standard peak
For asprin:
Fasp= (Cis-Aasp)/ (Casp-Ais) Where: Aasp= Area under Asprin peak
Casp= Concentration of Asprin
Discussion
Researchers can analyse aspirin and paracetamol owing to their different interactions
with the stationary phase. The internal standard is useful in correcting the variability caused by a
possible analyte loss during sample treatment and storage. Separating the two drugs provides
room for analysis. An investigator can conclude that one drug has higher molecular weight than
Paraphrase This Document
Need a fresh take? Get an instant paraphrase of this document with our AI Paraphraser
PCR and HPLC 8
the other based on how high it rises from the baseline. A component that rises highest has the
lowest molecular weight.
Conclusion
HPLC assists in the analysis of aspirin and paracetamol after the separation of the two
components. The application of pressure makes HPLC more efficient than other
chromatographic techniques like liquid chromatography. The presentation from the
chromatogram can be used to calculate the correlation factors of the drugs.
PCR and HPLC 9
References
Dastkhoon, M., Ghaedi, M., Asfaram, A., Arabi, M., Ostovan, A. and Goudarzi, A., 2017. Cu@
SnS/SnO2 nanoparticles as a novel sorbent for dispersive micro solid phase extraction of
atorvastatin in human plasma and urine samples by high-performance liquid chromatography
with UV detection: application of central composite design (CCD). Ultrasonics sonochemistry,
36, pp.42-49.
Ismail, B.P., 2017. Basic principles of chromatography. In Food Analysis (pp. 185-211).
Skoog, D.A., Holler, F.J. and Crouch, S.R., 2017. Principles of instrumental analysis. 7 (30) pp
45-89
Tian, S., Liu, W., Liu, F., Zhang, X. and Upur, H., 2015. Development and validation of a high-
performance liquid chromatography-diode array detector method for the simultaneous
determination of six phenolic compounds in abnormal savda munziq decoction. Pharmacognosy
Magazine, 11(41), p.157.
⊘ This is a preview!⊘
Do you want full access?
Subscribe today to unlock all pages.
Trusted by 1+ million students worldwide
PCR and HPLC 10
Protocol for analysing Metronidazole using HPLC
Introduction
Metronidazole is an antimicrobial medication used as a remedy for anaerobic bacterial
infections and protozoal complications (Lewis et al., 2015). The gastrointestinal tract completely
and readily absorbs the drug after few hours from oral administration. Metronidazole metabolism
occurs in the liver through glucuronide conjugation and side chain oxidation. Metronidazole has
a molecular weight of 171.156g/mol. The drug absorbs UV rays at a λ max of 288nm, and its
molecular formulae are C6H9N3O3. Additionally, the drug has a pKa of 5.8 in saturated solutions
and a melting point of 160ºC. HPLC is useful in analysing the drug; since the findings are useful
in calculating the correlation factor among other parameters.
Materials
The required materials include the stationary phase, mobile phase, and the HPLC
components. The constituents of HPLC include a solvent reservoir, a column, a high-pressure
pump, a detector, and an injector system (Rheodyne injector) (Fare, and Adamovics, 2017).
Procedure
Add the internal standard to 50 mg of metronidazole. The proper standard to use is
ranitidine. Add the mixture of metronidazole and the internal standard to the mobile phase
(solvent). A suitable mobile phase to use is acetonitrile in KH2PO4 buffer (Jeon et al., 2016). The
appropriate stationary phase is μBondapak phenyl column. Use the high-pressure pump to push
the components of the mobile phase through the stationary phase. Monitor the effluents at 320nm
using the UV detector. 320nm wavelength is an efficient monitoring front; since metronidazole
absorbs UV at a maximum of 288nm. Allow the chromatography to run and use the peak area
Paraphrase This Document
Need a fresh take? Get an instant paraphrase of this document with our AI Paraphraser
PCR and HPLC 11
under the internal control and metronidazole to calculate the various correlation factors (F). The
correlation factor for metronidazole can be calculated using the formulae below.
Fmet= (Cis-Amet)/ (Cmet-Ais) Where: Cis= Concentration of the internal standard (ranitide)
Amet= Area under the metronidazole peak
Cmet=Concentration of Metronidazole
Ais= Area under the internal standard peak
Discussion
Analysis of metronidazole occurs best using the reverse-phase HPLC (Wong et al.,
2018). Hydrocarbon chains are added to the stationary phase to make the columns non-polar. A
polar solvent is used as the mobile phase; hence, preventing the stationary and the aqueous phase
from mixing. The polar molecules present in the sample mixture strongly attract the solvent;
hence, facilitating the speed of elution. In the protocol, acetonitrile is used as the mobile phase
due to its high polarity index of 5.8 (Kaur et al., 2016). μBondapak phenyl column is used as the
stationary phase due to its non-polarity (Madhu et al., 2015). Additionally, Rheodyne injector is
used due to its precision and accuracy. The type of elution that suits the above protocol is the
isocratic mode involving keeping the components of the mobile phase constant throughout the
experiment. The flow rate is high due to the elevated pressure and difference in polarity between
the stationary and mobile phase. Improving the polarity of the mobile phase improves the peak
sharpness. The parameters affecting the reliability of the protocol include the nature of the
stationary and mobile phase among other determinants.
PCR and HPLC 12
References
Fare, D.L. and Adamovics, J.A., 2017. High-Performance Liquid Chromatography. In
Chromatographic Analysis of Pharmaceuticals, Second Edition (pp. 135-208).
Jeon, J.S., Kim, H.T., Kim, M.G., Oh, M.S., Hong, S.R., Yoon, M.H., Cho, S.M., Shin, H.C.,
Shim, J.H., Ramadan, A. and Abd El‐Aty, A.M., 2016. Simultaneous determination of water‐
soluble whitening ingredients and adenosine in different cosmetic formulations by high‐
performance liquid chromatography coupled with photodiode array detection. International
journal of cosmetic science, 38(3), pp.286-293.
Kaur, I., Wakode, S., Pal Singh, H. and Manachanda, S., 2016. Development and Validation of a
Stability-Indicating Reverse Phase HPLC-PDA Method for Determination of Canagliflozin in
Bulk and Pharmaceutical Dosage Form. Pharmaceutical Methods, 7(1).
Lewis, B.B., Buffie, C.G., Carter, R.A., Leiner, I., Toussaint, N.C., Miller, L.C., Gobourne, A.,
Ling, L. and Pamer, E.G., 2015. Loss of microbiota-mediated colonisation resistance to
Clostridium difficile infection with oral vancomycin compared with metronidazole. The Journal
of infectious diseases, 212(10), pp.1656-1665.
Madhu, M., Sreeram, V., Nagendrakumar, A.V.D. and Reddy, T.V., 2015. Validated RP-HPLC
method for the determination of mepyramine maleate in bulk and pharmaceutical formulation.
IJCS, 2(5), pp.22-26.
⊘ This is a preview!⊘
Do you want full access?
Subscribe today to unlock all pages.
Trusted by 1+ million students worldwide
1 out of 13
Related Documents


Your All-in-One AI-Powered Toolkit for Academic Success.
+13062052269
info@desklib.com
Available 24*7 on WhatsApp / Email
![[object Object]](/_next/static/media/star-bottom.7253800d.svg)
Unlock your academic potential
Copyright © 2020–2026 A2Z Services. All Rights Reserved. Developed and managed by ZUCOL.