Managerial Finance: Ratio Analysis and Investment Appraisal Report
VerifiedAdded on 2022/12/29
|18
|4158
|1
Report
AI Summary
This report provides a comprehensive financial analysis of Tesco plc and Sainsbury plc, two leading UK retail chains. The analysis begins with an overview of both companies, followed by a detailed examination of their financial performance using ratio analysis, including current ratio, quick ratio, gross profit margin, net profit margin, P/E ratio, gearing ratio, return on capital employed, inventory turnover, dividend payout ratio, and earnings per share. The report interprets these ratios, comparing the performance of both companies and offering recommendations. Furthermore, the report delves into investment appraisal techniques, evaluating project A and project B, and discusses the limitations of these techniques for long-term decision-making. The conclusion summarizes the key findings, highlighting the strengths and weaknesses of each company's financial position and investment strategies.

Managerial Finance
Paraphrase This Document
Need a fresh take? Get an instant paraphrase of this document with our AI Paraphraser
Table of Contents
INTRODUCTION...........................................................................................................................3
PORTFOLIO 1................................................................................................................................3
Ratio analysis:..............................................................................................................................4
Interpretation:..............................................................................................................................5
Recommendations:....................................................................................................................11
Limitations for using ratio analysis for knowing firms financial position:...............................11
PORTFOLIO 2..............................................................................................................................12
Investment appraisal techniques for project A and project B:...................................................12
Limitations of using investment appraisal techniques for long term decision-making:............14
CONCLUSION..............................................................................................................................17
REFERENCES..............................................................................................................................18
INTRODUCTION
Managing Finance is primarily a combination of finance/economics and accounting.
Initially, finance officers utilize accounting reports, cashflows reports and other key reports to
plan and allocate the fiscal resources of the firm. In addition, managers use economic principles
as a basis for strategic decision-makings which meets the needs of the business. In simplistic
terms, finances are an aspect of economics driven by financial skills. Because finance and its
related activities add values to the whole enterprise, finance managers are crucial personnel for
the most of organisations (Abor, 2016). Financial managers analyse the sustainability of the
business, comprehend the financial effects, trends, and consider how to manage the company's
assets for long-term success of entity. The study includes the financial review of UK's top retail
chains, notably Tesco plc and Sainsbury, as well as gives suggestions to enterprises. It also
covers practical case study on the investment appraisal strategies and the main shortcomings of
these techniques.
PORTFOLIO 1
Overview of Companies:
Tesco Plc: It's a grocery store chain company. The Organization is active in Online retail and
other operations like Retail Banking business, Insurance Services business. Company also
operates its business throughout United Kingdom, Republic of Ireland, areas of Centre Europe,
which also comprise Czech Republic, Poland, Slovakia, Hungary. Company also operates as
Tesco Banks, which carry financial services, insurance and banking operations in UK.
Corporation's sector consists of United Kingdom, Czech State, United Kingdom. The Company
delivers a series of personal banking product lines and resources, including lending. The
Company delivers a range of personal finance product categories and programmes, comprising
credit cards, credits receivables, personal loans and advances.
Sainsbury Plc: Sainsbury is the top-leading retailer of products across the Uk. The Company
functions in following areas: Retail segment, Financial Activities and Investing. The supermarket
section is active in the operation of grocery stores and grocery stores. The segment on fiscal
product encompasses the operational processes of Sainsbury's Banks. The Commercial property
Investments segment comprises of mutual ventures between the Company and British Property
Corporation, namely Land Securities Company. Sainsbury Bank aims at providing a wide array
⊘ This is a preview!⊘
Do you want full access?
Subscribe today to unlock all pages.
Trusted by 1+ million students worldwide
of services, such as savings, secured loans, savings and mortgage debt. Sainsbury Bank gives
automobile, home, animal insurance, and health insurance plans. Sainsbury's Power delivers
gasoline and electricity, and also a number of power generators. Sainsbury's
Entertainments offers films and shows, tracks, books, sports and other entertainment media.
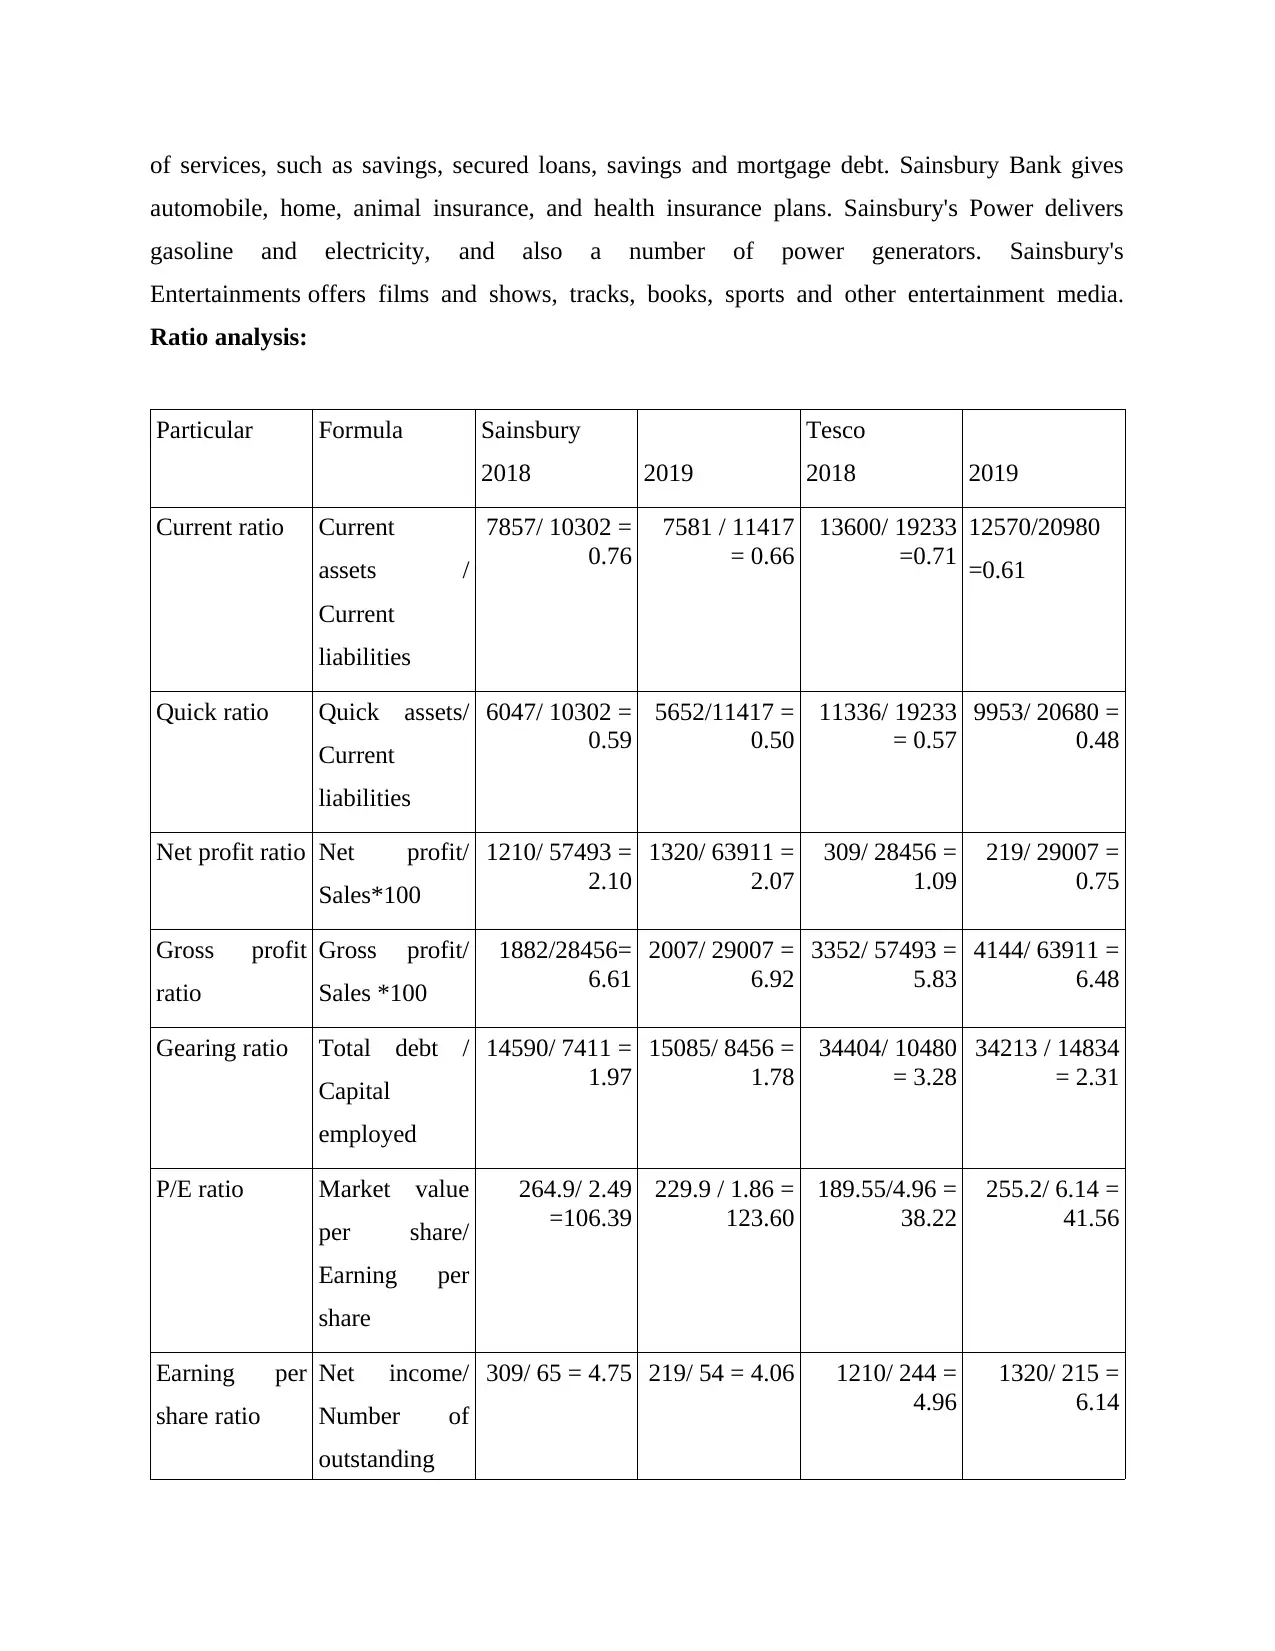
Ratio analysis:
Particular Formula Sainsbury
2018 2019
Tesco
2018 2019
Current ratio Current
assets /
Current
liabilities
7857/ 10302 =
0.76
7581 / 11417
= 0.66
13600/ 19233
=0.71
12570/20980
=0.61
Quick ratio Quick assets/
Current
liabilities
6047/ 10302 =
0.59
5652/11417 =
0.50
11336/ 19233
= 0.57
9953/ 20680 =
0.48
Net profit ratio Net profit/
Sales*100
1210/ 57493 =
2.10
1320/ 63911 =
2.07
309/ 28456 =
1.09
219/ 29007 =
0.75
Gross profit
ratio
Gross profit/
Sales *100
1882/28456=
6.61
2007/ 29007 =
6.92
3352/ 57493 =
5.83
4144/ 63911 =
6.48
Gearing ratio Total debt /
Capital
employed
14590/ 7411 =
1.97
15085/ 8456 =
1.78
34404/ 10480
= 3.28
34213 / 14834
= 2.31
P/E ratio Market value
per share/
Earning per
share
264.9/ 2.49
=106.39
229.9 / 1.86 =
123.60
189.55/4.96 =
38.22
255.2/ 6.14 =
41.56
Earning per
share ratio
Net income/
Number of
outstanding
309/ 65 = 4.75 219/ 54 = 4.06 1210/ 244 =
4.96
1320/ 215 =
6.14
automobile, home, animal insurance, and health insurance plans. Sainsbury's Power delivers
gasoline and electricity, and also a number of power generators. Sainsbury's
Entertainments offers films and shows, tracks, books, sports and other entertainment media.
Ratio analysis:
Particular Formula Sainsbury
2018 2019
Tesco
2018 2019
Current ratio Current
assets /
Current
liabilities
7857/ 10302 =
0.76
7581 / 11417
= 0.66
13600/ 19233
=0.71
12570/20980
=0.61
Quick ratio Quick assets/
Current
liabilities
6047/ 10302 =
0.59
5652/11417 =
0.50
11336/ 19233
= 0.57
9953/ 20680 =
0.48
Net profit ratio Net profit/
Sales*100
1210/ 57493 =
2.10
1320/ 63911 =
2.07
309/ 28456 =
1.09
219/ 29007 =
0.75
Gross profit
ratio
Gross profit/
Sales *100
1882/28456=
6.61
2007/ 29007 =
6.92
3352/ 57493 =
5.83
4144/ 63911 =
6.48
Gearing ratio Total debt /
Capital
employed
14590/ 7411 =
1.97
15085/ 8456 =
1.78
34404/ 10480
= 3.28
34213 / 14834
= 2.31
P/E ratio Market value
per share/
Earning per
share
264.9/ 2.49
=106.39
229.9 / 1.86 =
123.60
189.55/4.96 =
38.22
255.2/ 6.14 =
41.56
Earning per
share ratio
Net income/
Number of
outstanding
309/ 65 = 4.75 219/ 54 = 4.06 1210/ 244 =
4.96
1320/ 215 =
6.14
Paraphrase This Document
Need a fresh take? Get an instant paraphrase of this document with our AI Paraphraser
Tesco
Sainsbury
00.20.40.60.8 0.71 0.76
0.61 0.66
Current ratio
2018 2019
share
Return on
capital
employed
Operating
profit/ Capital
employed
518/ 11699 =
4.43
601/ 12097 =
4.97
1566 / 25502
= 6.14
2639 / 28269
= 9.34
Average stock
turnover
Cost of goods
sold/ Average
stock
26574/ 1792.5
= 14.83
27000/ 1869.5
= 14.44
54141/ 2282 =
23.73
59769/ 2440 =
24.50
Dividend
payout ratio
Dividend per
share/ Earning
per share
235 / 309 =
76.05
247/ 219 =
112.79
82/ 1210 =
6.78
357/ 1320 =
27.05
Capital employed = Total assets- Total current liabilities
Tesco
2018 2019
44735 – 19233 = 25502 48949 – 20680 = 28269
Sainsbury’s
2018 2019
22001 – 10302 = 11699 23514 – 11417 = 12097
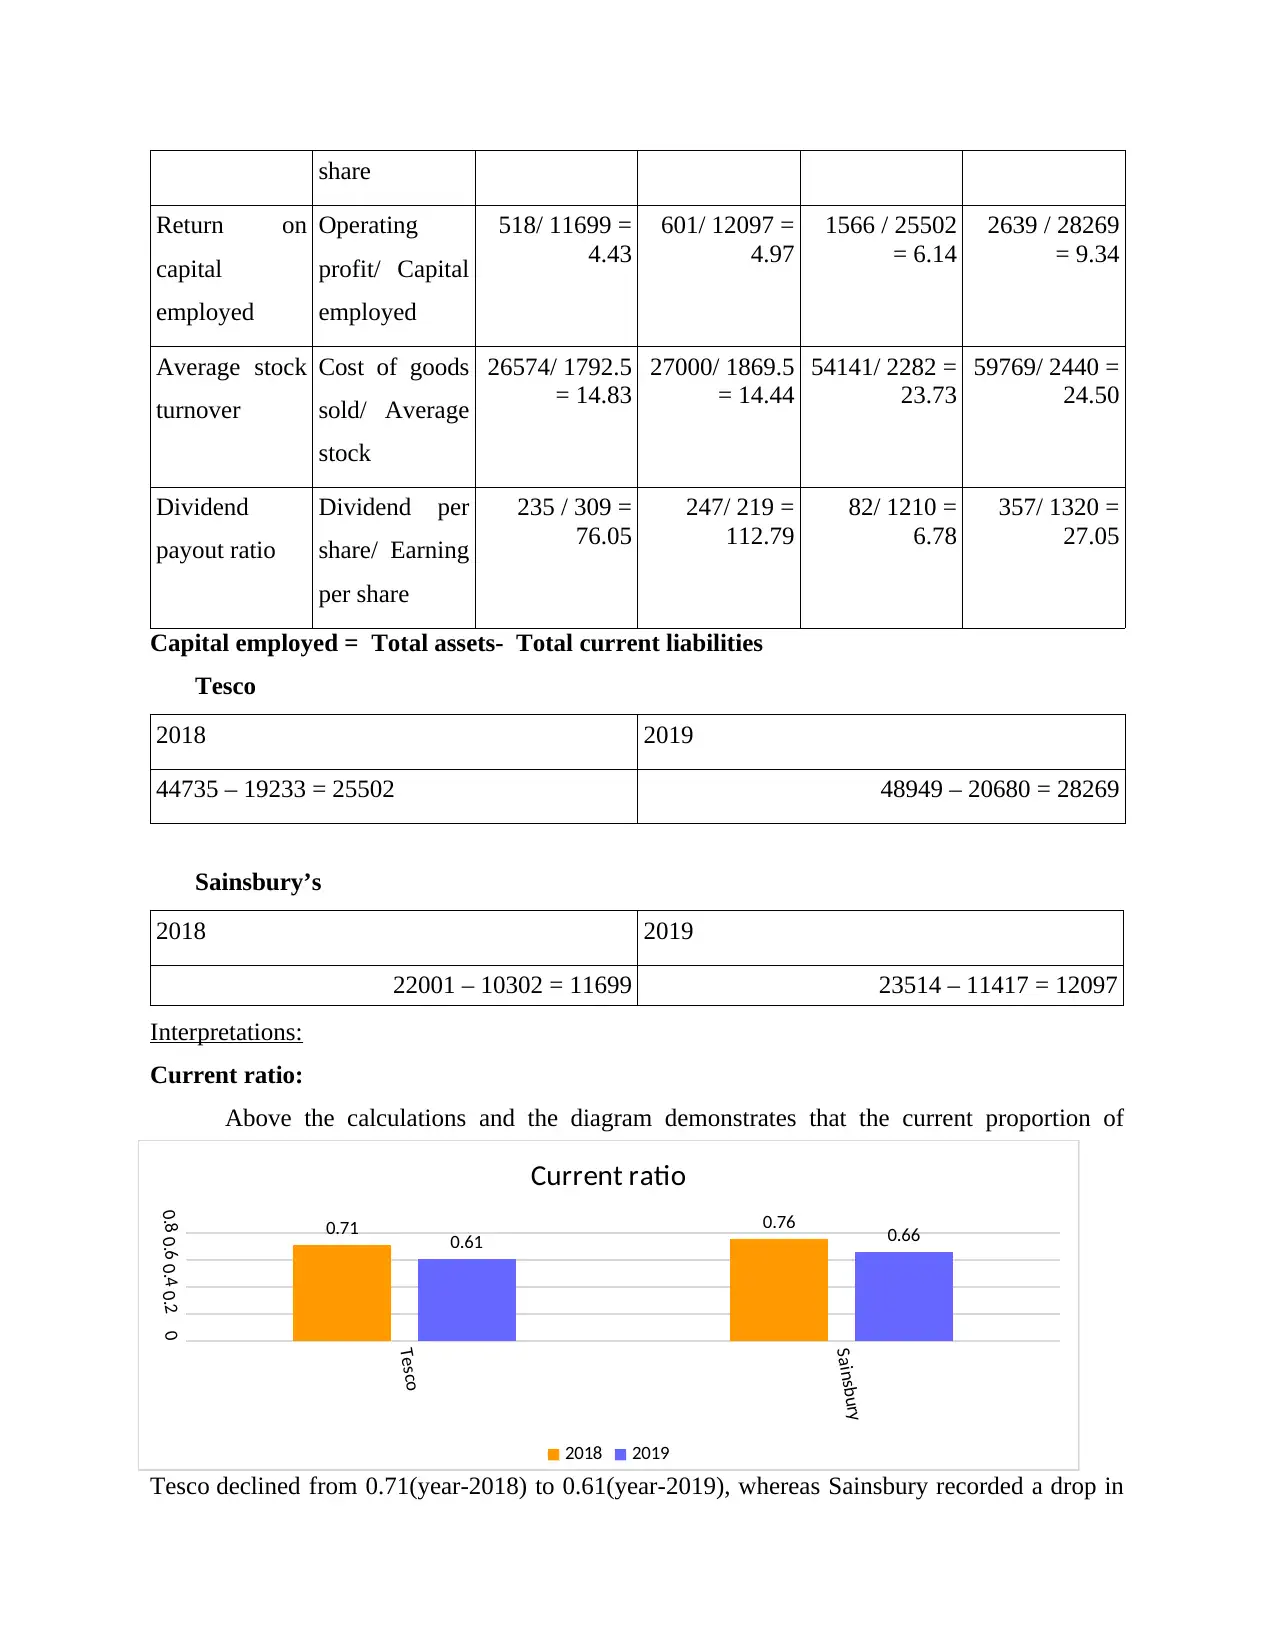
Interpretations:
Current ratio:
Above the calculations and the diagram demonstrates that the current proportion of
Tesco declined from 0.71(year-2018) to 0.61(year-2019), whereas Sainsbury recorded a drop in
Sainsbury
00.20.40.60.8 0.71 0.76
0.61 0.66
Current ratio
2018 2019
share
Return on
capital
employed
Operating
profit/ Capital
employed
518/ 11699 =
4.43
601/ 12097 =
4.97
1566 / 25502
= 6.14
2639 / 28269
= 9.34
Average stock
turnover
Cost of goods
sold/ Average
stock
26574/ 1792.5
= 14.83
27000/ 1869.5
= 14.44
54141/ 2282 =
23.73
59769/ 2440 =
24.50
Dividend
payout ratio
Dividend per
share/ Earning
per share
235 / 309 =
76.05
247/ 219 =
112.79
82/ 1210 =
6.78
357/ 1320 =
27.05
Capital employed = Total assets- Total current liabilities
Tesco
2018 2019
44735 – 19233 = 25502 48949 – 20680 = 28269
Sainsbury’s
2018 2019
22001 – 10302 = 11699 23514 – 11417 = 12097
Interpretations:
Current ratio:
Above the calculations and the diagram demonstrates that the current proportion of
Tesco declined from 0.71(year-2018) to 0.61(year-2019), whereas Sainsbury recorded a drop in
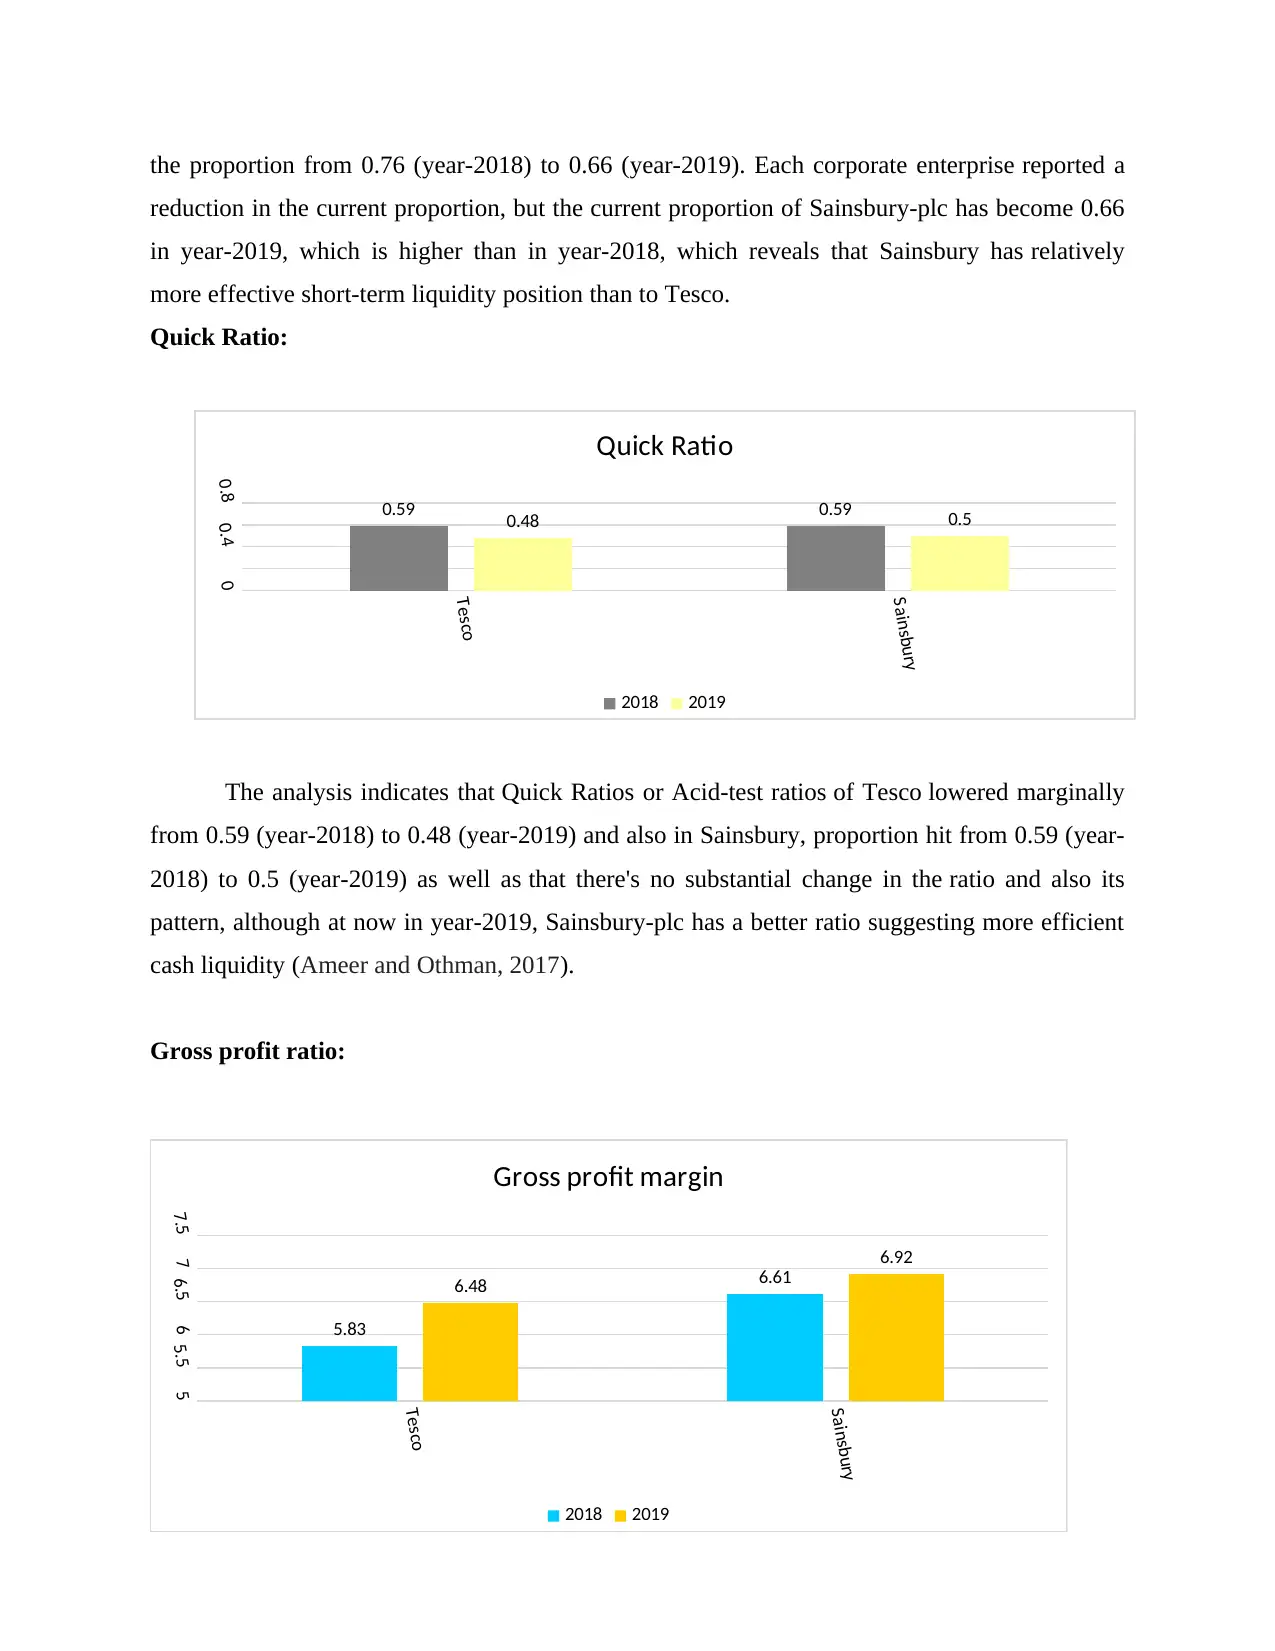
the proportion from 0.76 (year-2018) to 0.66 (year-2019). Each corporate enterprise reported a
reduction in the current proportion, but the current proportion of Sainsbury-plc has become 0.66
in year-2019, which is higher than in year-2018, which reveals that Sainsbury has relatively
more effective short-term liquidity position than to Tesco.
Quick Ratio:
The analysis indicates that Quick Ratios or Acid-test ratios of Tesco lowered marginally
from 0.59 (year-2018) to 0.48 (year-2019) and also in Sainsbury, proportion hit from 0.59 (year-
2018) to 0.5 (year-2019) as well as that there's no substantial change in the ratio and also its
pattern, although at now in year-2019, Sainsbury-plc has a better ratio suggesting more efficient
cash liquidity (Ameer and Othman, 2017).
Gross profit ratio:
Tesco
Sainsbury
00.40.8 0.59 0.59
0.48 0.5
Quick Ratio
2018 2019
Tesco
Sainsbury
55.566.577.5
5.83
6.616.48
6.92
Gross profit margin
2018 2019
⊘ This is a preview!⊘
Do you want full access?
Subscribe today to unlock all pages.
Trusted by 1+ million students worldwide
The overall profitability ratio was enhanced from 5.83 per cent (year-2018) to 6.48 per
cent (year-2019), while those of Sainsbury rose from 6.61 (year-2018) to 6,92 (year-2019). So
both enterprises are displaying gradual trends in gross margins. While Sainsbury had a higher
gross margin-rate in year-2019. Which tends to suggest that Sainsbury-plc is more effective of
producing operating income via their base business operations/activities.
Net Profit/margin ratio:
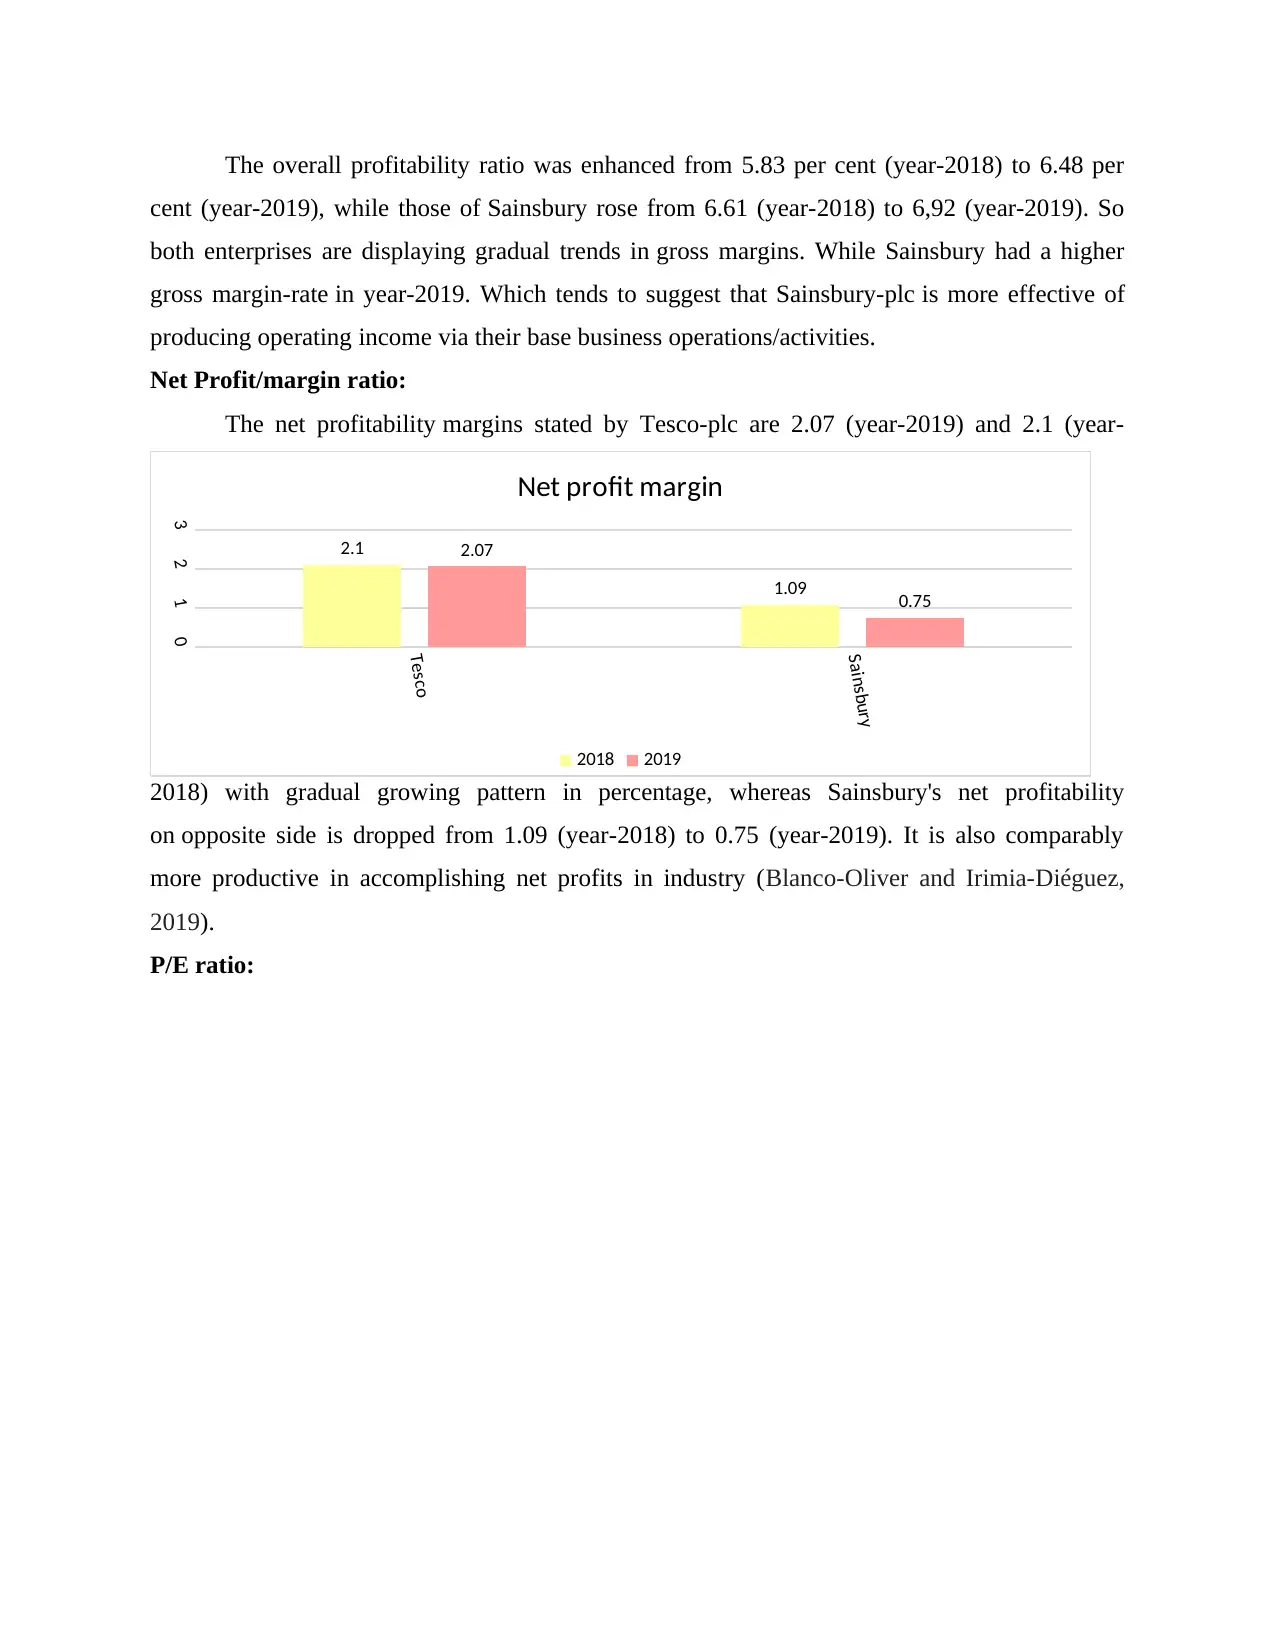
The net profitability margins stated by Tesco-plc are 2.07 (year-2019) and 2.1 (year-
2018) with gradual growing pattern in percentage, whereas Sainsbury's net profitability
on opposite side is dropped from 1.09 (year-2018) to 0.75 (year-2019). It is also comparably
more productive in accomplishing net profits in industry (Blanco-Oliver and Irimia-Diéguez,
2019).
P/E ratio:
Tesco
Sainsbury
0123
2.1
1.09
2.07
0.75
Net profit margin
2018 2019
cent (year-2019), while those of Sainsbury rose from 6.61 (year-2018) to 6,92 (year-2019). So
both enterprises are displaying gradual trends in gross margins. While Sainsbury had a higher
gross margin-rate in year-2019. Which tends to suggest that Sainsbury-plc is more effective of
producing operating income via their base business operations/activities.
Net Profit/margin ratio:
The net profitability margins stated by Tesco-plc are 2.07 (year-2019) and 2.1 (year-
2018) with gradual growing pattern in percentage, whereas Sainsbury's net profitability
on opposite side is dropped from 1.09 (year-2018) to 0.75 (year-2019). It is also comparably
more productive in accomplishing net profits in industry (Blanco-Oliver and Irimia-Diéguez,
2019).
P/E ratio:
Tesco
Sainsbury
0123
2.1
1.09
2.07
0.75
Net profit margin
2018 2019
Paraphrase This Document
Need a fresh take? Get an instant paraphrase of this document with our AI Paraphraser
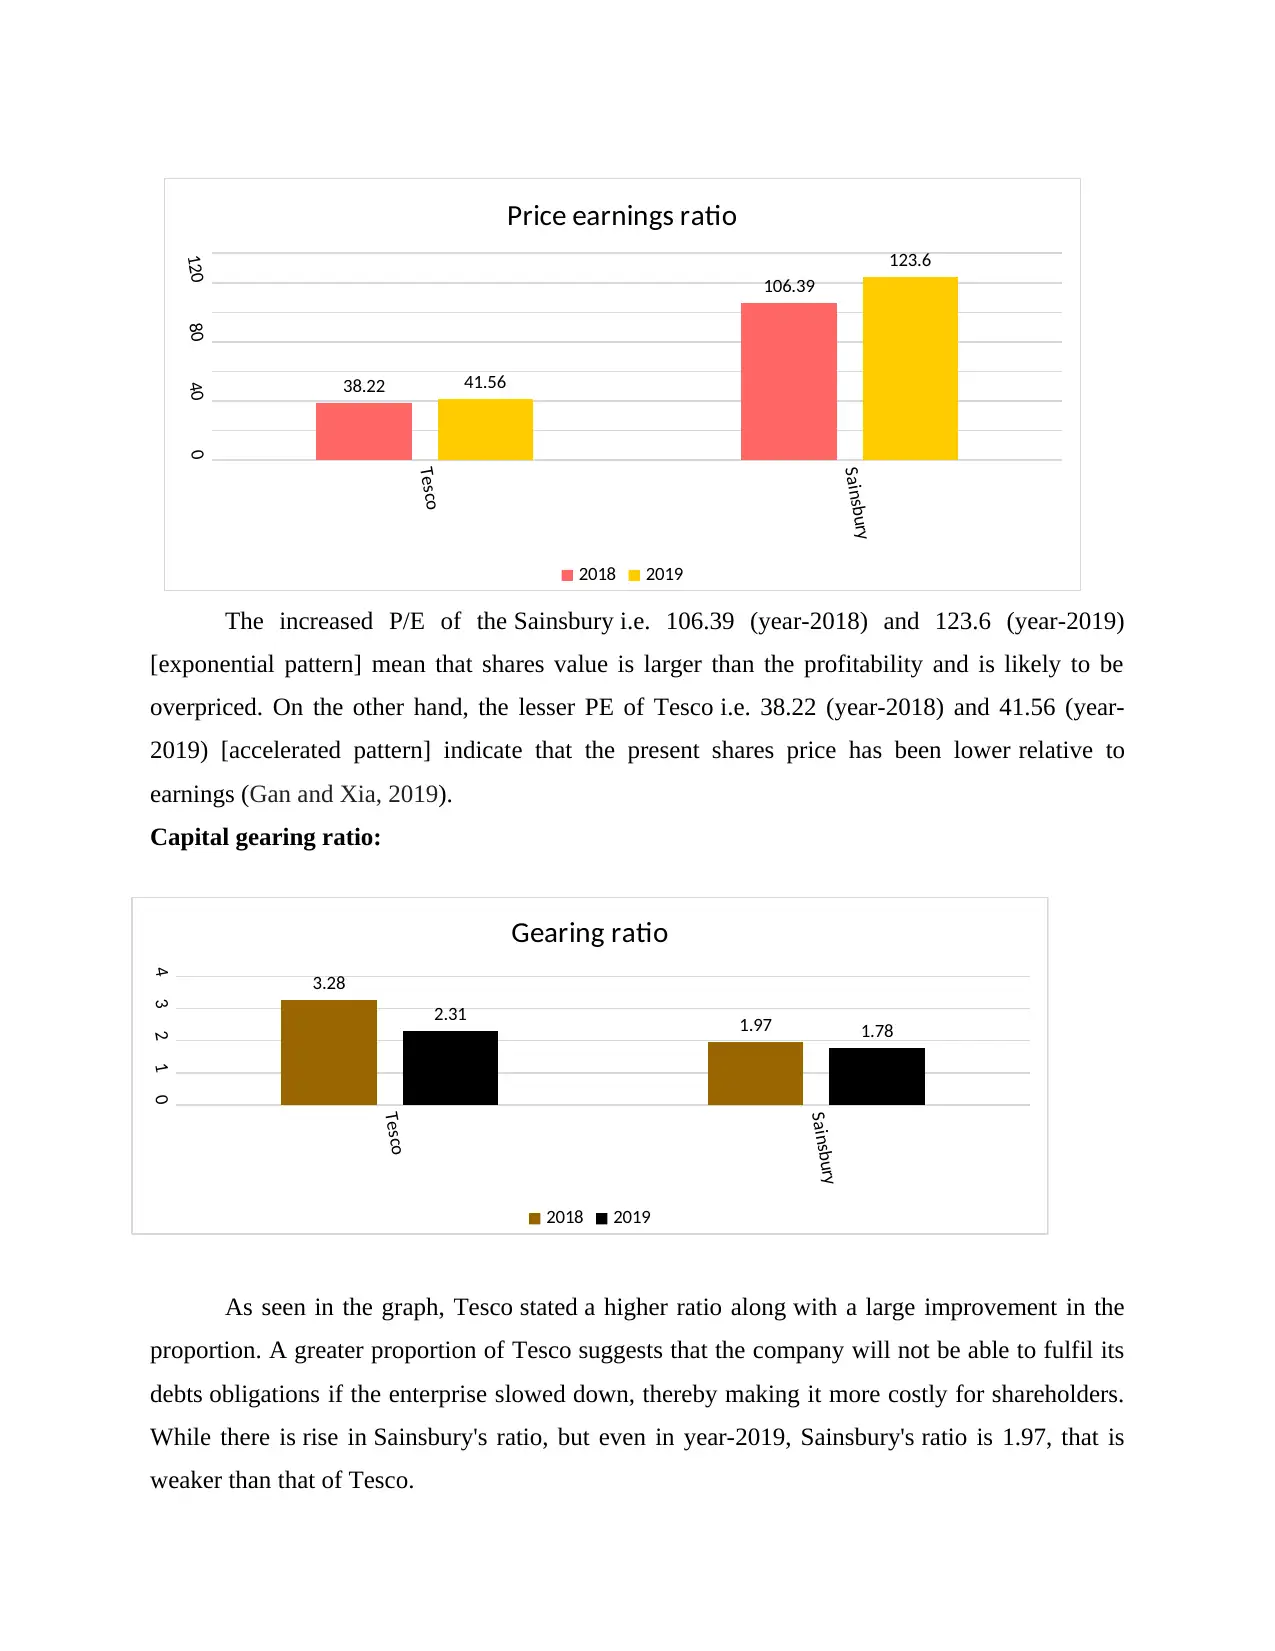
The increased P/E of the Sainsbury i.e. 106.39 (year-2018) and 123.6 (year-2019)
[exponential pattern] mean that shares value is larger than the profitability and is likely to be
overpriced. On the other hand, the lesser PE of Tesco i.e. 38.22 (year-2018) and 41.56 (year-
2019) [accelerated pattern] indicate that the present shares price has been lower relative to
earnings (Gan and Xia, 2019).
Capital gearing ratio:
As seen in the graph, Tesco stated a higher ratio along with a large improvement in the
proportion. A greater proportion of Tesco suggests that the company will not be able to fulfil its
debts obligations if the enterprise slowed down, thereby making it more costly for shareholders.
While there is rise in Sainsbury's ratio, but even in year-2019, Sainsbury's ratio is 1.97, that is
weaker than that of Tesco.
Tesco
Sainsbury
0
40
80
120
38.22
106.39
41.56
123.6
Price earnings ratio
2018 2019
Tesco
Sainsbury
01234 3.28
1.97
2.31 1.78
Gearing ratio
2018 2019
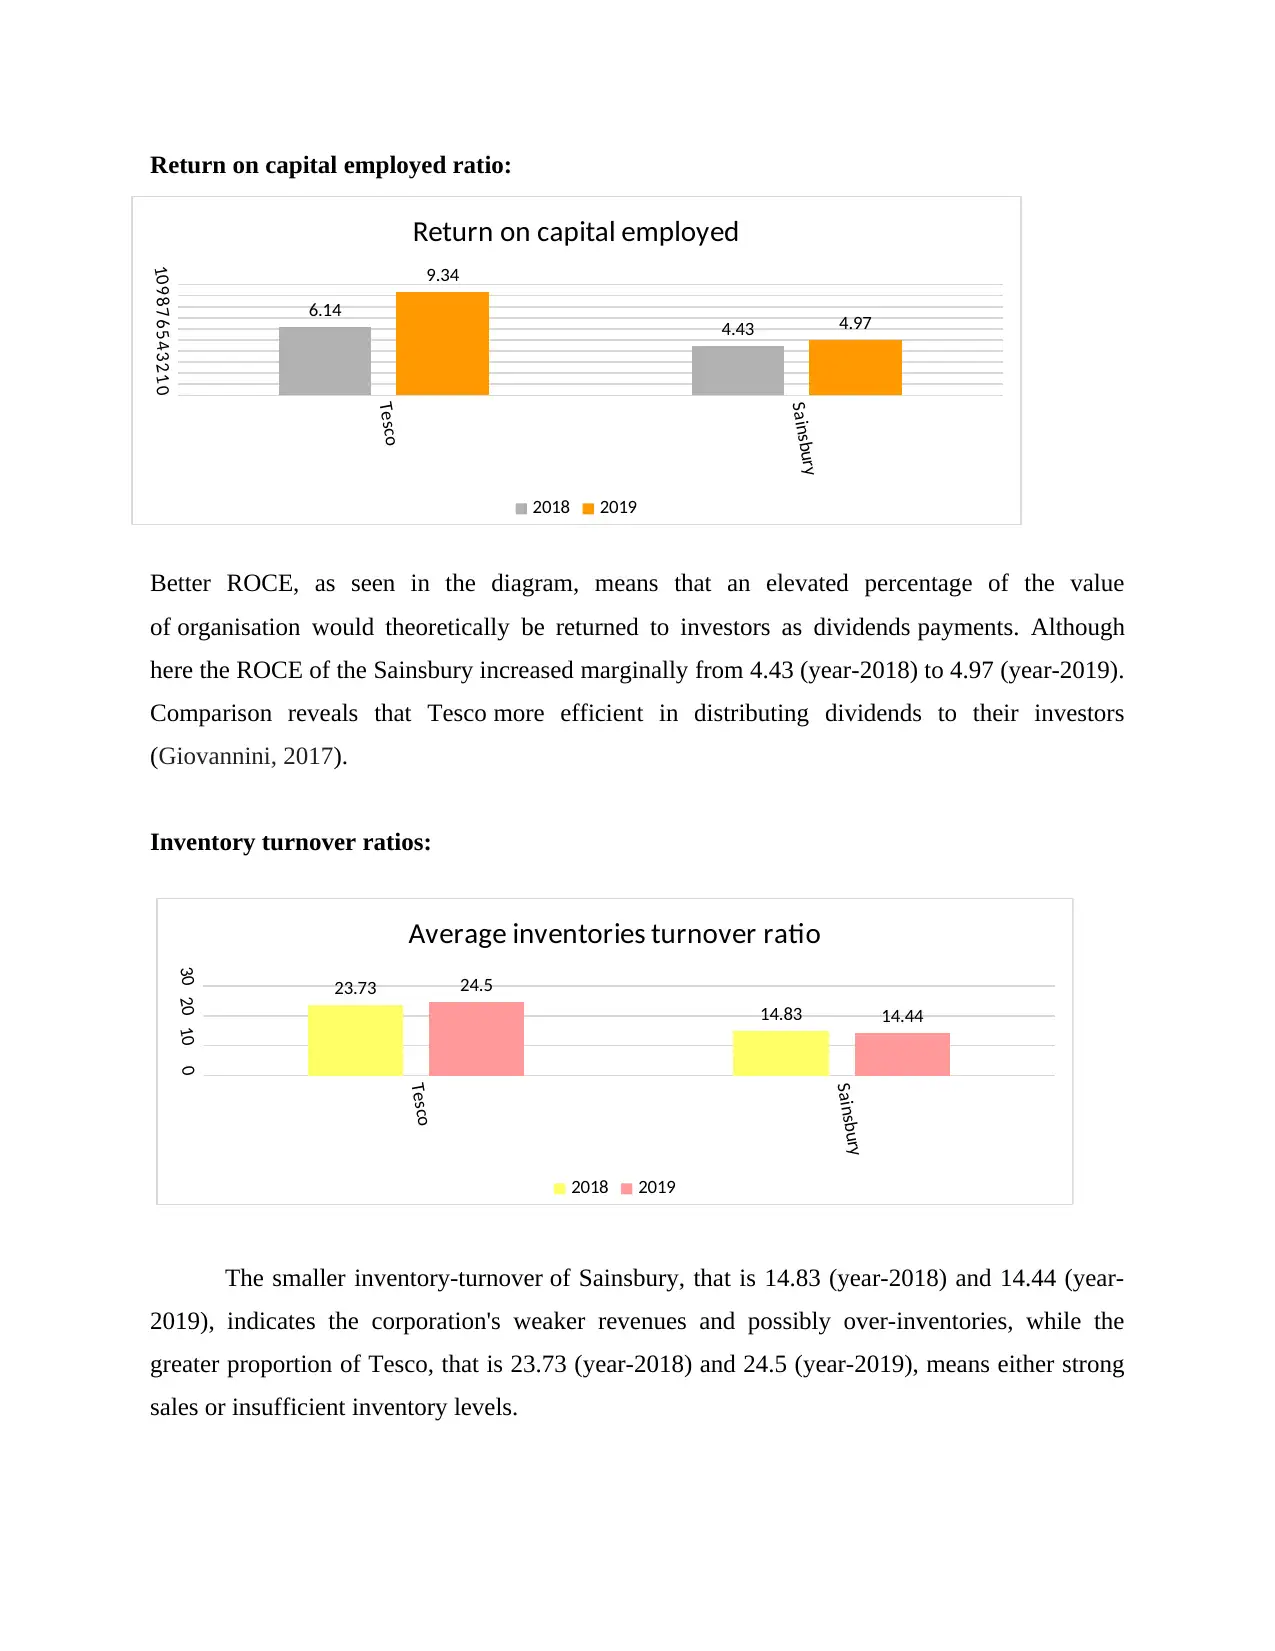
Return on capital employed ratio:
Better ROCE, as seen in the diagram, means that an elevated percentage of the value
of organisation would theoretically be returned to investors as dividends payments. Although
here the ROCE of the Sainsbury increased marginally from 4.43 (year-2018) to 4.97 (year-2019).
Comparison reveals that Tesco more efficient in distributing dividends to their investors
(Giovannini, 2017).
Inventory turnover ratios:
The smaller inventory-turnover of Sainsbury, that is 14.83 (year-2018) and 14.44 (year-
2019), indicates the corporation's weaker revenues and possibly over-inventories, while the
greater proportion of Tesco, that is 23.73 (year-2018) and 24.5 (year-2019), means either strong
sales or insufficient inventory levels.
Tesco
Sainsbury
012345678910
6.14
4.43
9.34
4.97
Return on capital employed
2018 2019
Tesco
Sainsbury
0102030 23.73
14.83
24.5
14.44
Average inventories turnover ratio
2018 2019
⊘ This is a preview!⊘
Do you want full access?
Subscribe today to unlock all pages.
Trusted by 1+ million students worldwide
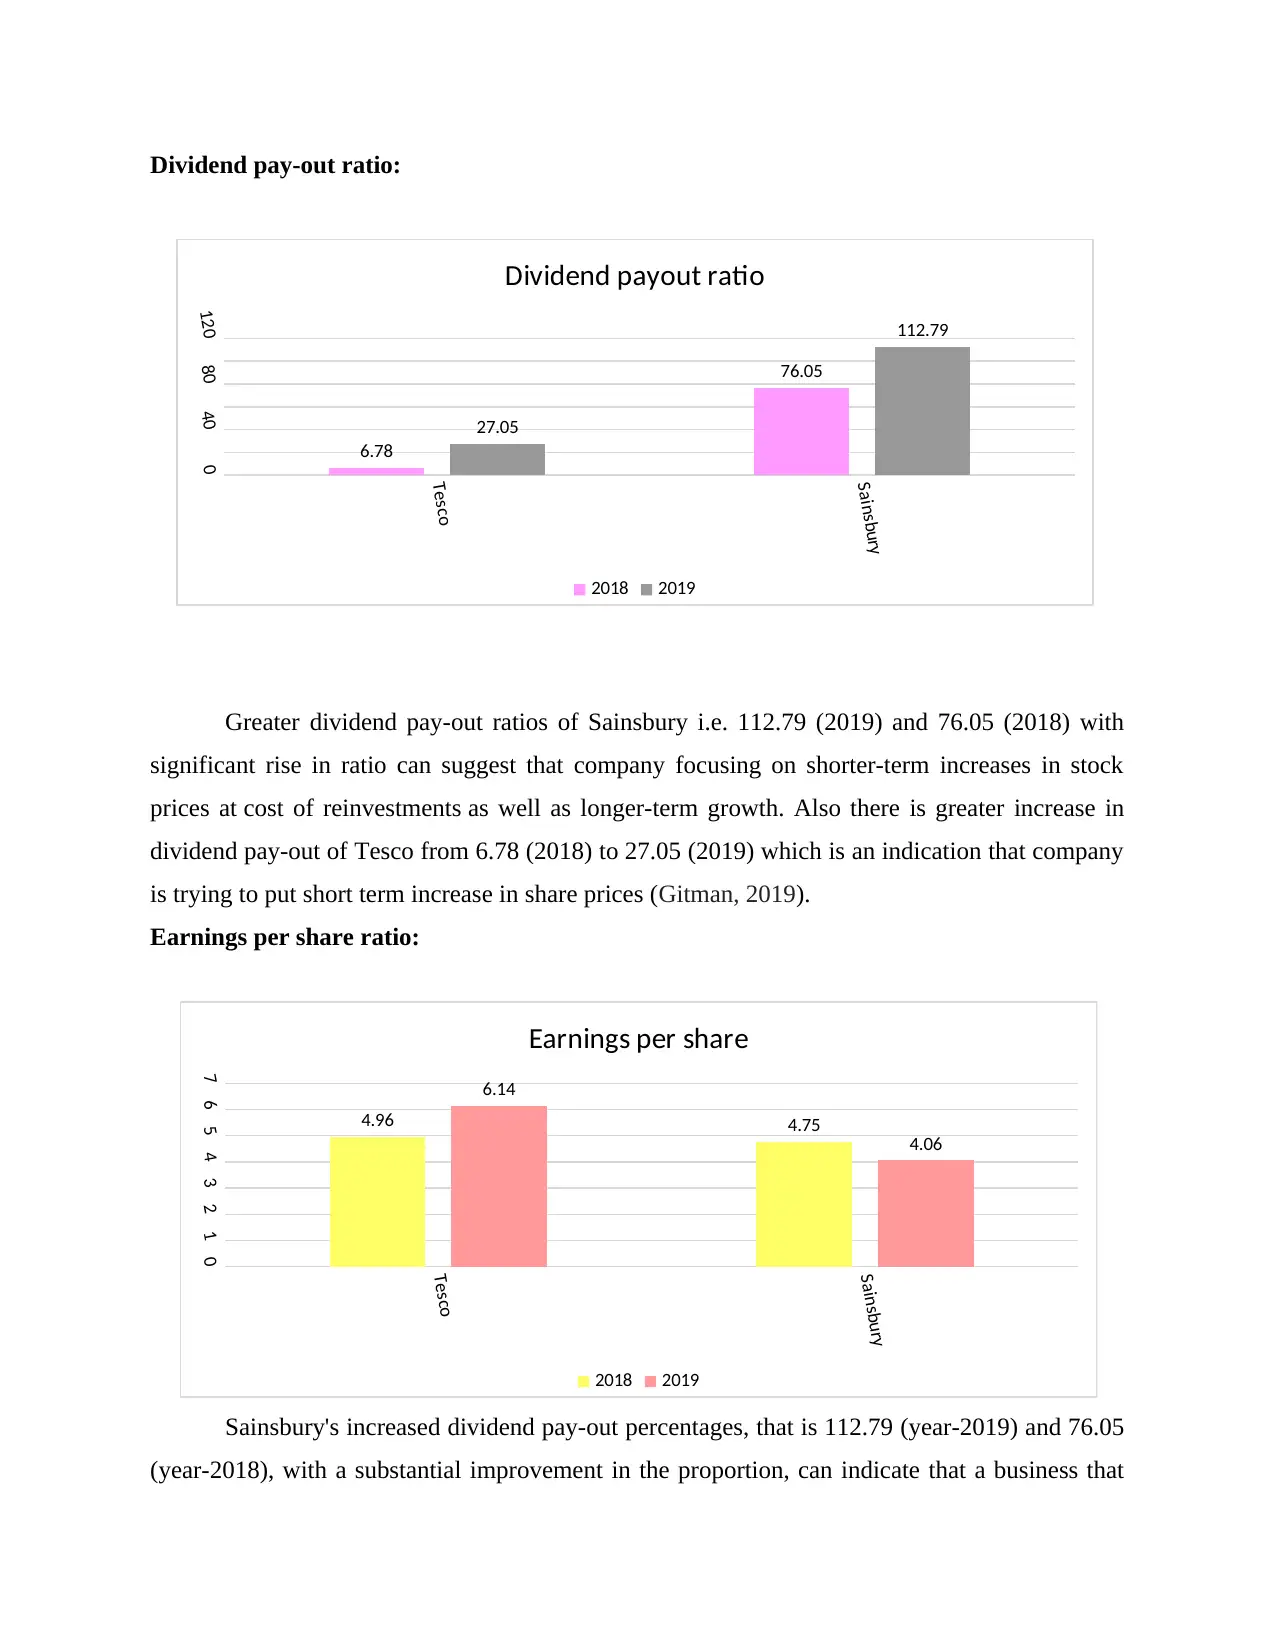
Dividend pay-out ratio:
Greater dividend pay-out ratios of Sainsbury i.e. 112.79 (2019) and 76.05 (2018) with
significant rise in ratio can suggest that company focusing on shorter-term increases in stock
prices at cost of reinvestments as well as longer-term growth. Also there is greater increase in
dividend pay-out of Tesco from 6.78 (2018) to 27.05 (2019) which is an indication that company
is trying to put short term increase in share prices (Gitman, 2019).
Earnings per share ratio:
Sainsbury's increased dividend pay-out percentages, that is 112.79 (year-2019) and 76.05
(year-2018), with a substantial improvement in the proportion, can indicate that a business that
Tesco
Sainsbury
04080120
6.78
76.05
27.05
112.79
Dividend payout ratio
2018 2019
Tesco
Sainsbury
01234567
4.96 4.75
6.14
4.06
Earnings per share
2018 2019
Paraphrase This Document
Need a fresh take? Get an instant paraphrase of this document with our AI Paraphraser
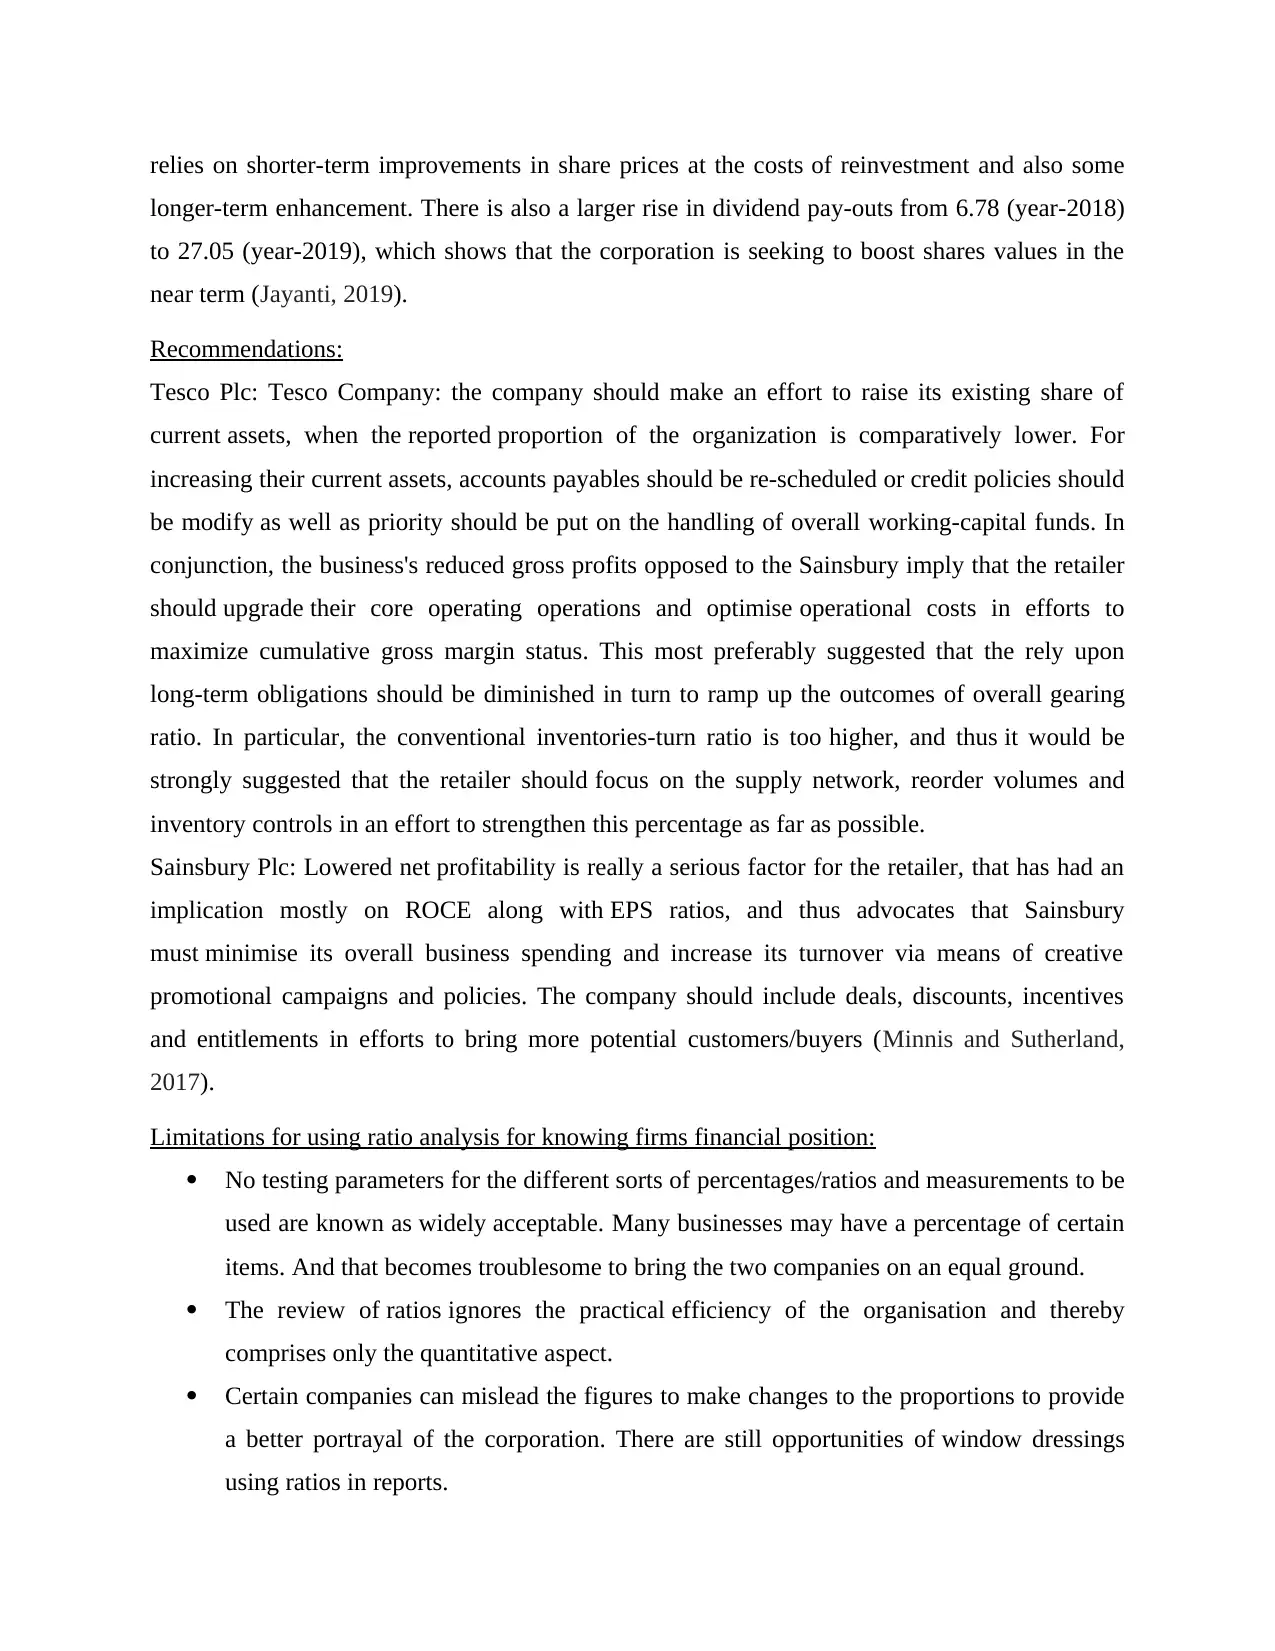
relies on shorter-term improvements in share prices at the costs of reinvestment and also some
longer-term enhancement. There is also a larger rise in dividend pay-outs from 6.78 (year-2018)
to 27.05 (year-2019), which shows that the corporation is seeking to boost shares values in the
near term (Jayanti, 2019).
Recommendations:
Tesco Plc: Tesco Company: the company should make an effort to raise its existing share of
current assets, when the reported proportion of the organization is comparatively lower. For
increasing their current assets, accounts payables should be re-scheduled or credit policies should
be modify as well as priority should be put on the handling of overall working-capital funds. In
conjunction, the business's reduced gross profits opposed to the Sainsbury imply that the retailer
should upgrade their core operating operations and optimise operational costs in efforts to
maximize cumulative gross margin status. This most preferably suggested that the rely upon
long-term obligations should be diminished in turn to ramp up the outcomes of overall gearing
ratio. In particular, the conventional inventories-turn ratio is too higher, and thus it would be
strongly suggested that the retailer should focus on the supply network, reorder volumes and
inventory controls in an effort to strengthen this percentage as far as possible.
Sainsbury Plc: Lowered net profitability is really a serious factor for the retailer, that has had an
implication mostly on ROCE along with EPS ratios, and thus advocates that Sainsbury
must minimise its overall business spending and increase its turnover via means of creative
promotional campaigns and policies. The company should include deals, discounts, incentives
and entitlements in efforts to bring more potential customers/buyers (Minnis and Sutherland,
2017).
Limitations for using ratio analysis for knowing firms financial position:
No testing parameters for the different sorts of percentages/ratios and measurements to be
used are known as widely acceptable. Many businesses may have a percentage of certain
items. And that becomes troublesome to bring the two companies on an equal ground.
The review of ratios ignores the practical efficiency of the organisation and thereby
comprises only the quantitative aspect.
Certain companies can mislead the figures to make changes to the proportions to provide
a better portrayal of the corporation. There are still opportunities of window dressings
using ratios in reports.
Conceptual analyses can also be inaccurate, as the inputs of P&L statements rely on
actual expenditures and earnings, while the inputs of the financial statements concentrate
on historical statistics. Differing inputs as a blend of both would always be inconsistent
and does not have the intended effect (Roloff, 2017).
For all those sums, Financial statement would be approved on last day of each financial
cycle. Accordingly, if some figures on that last day of fiscal period are suddenly shot or
eliminated, the as a whole ratio calculation would have a drastic impact.
PORTFOLIO 2
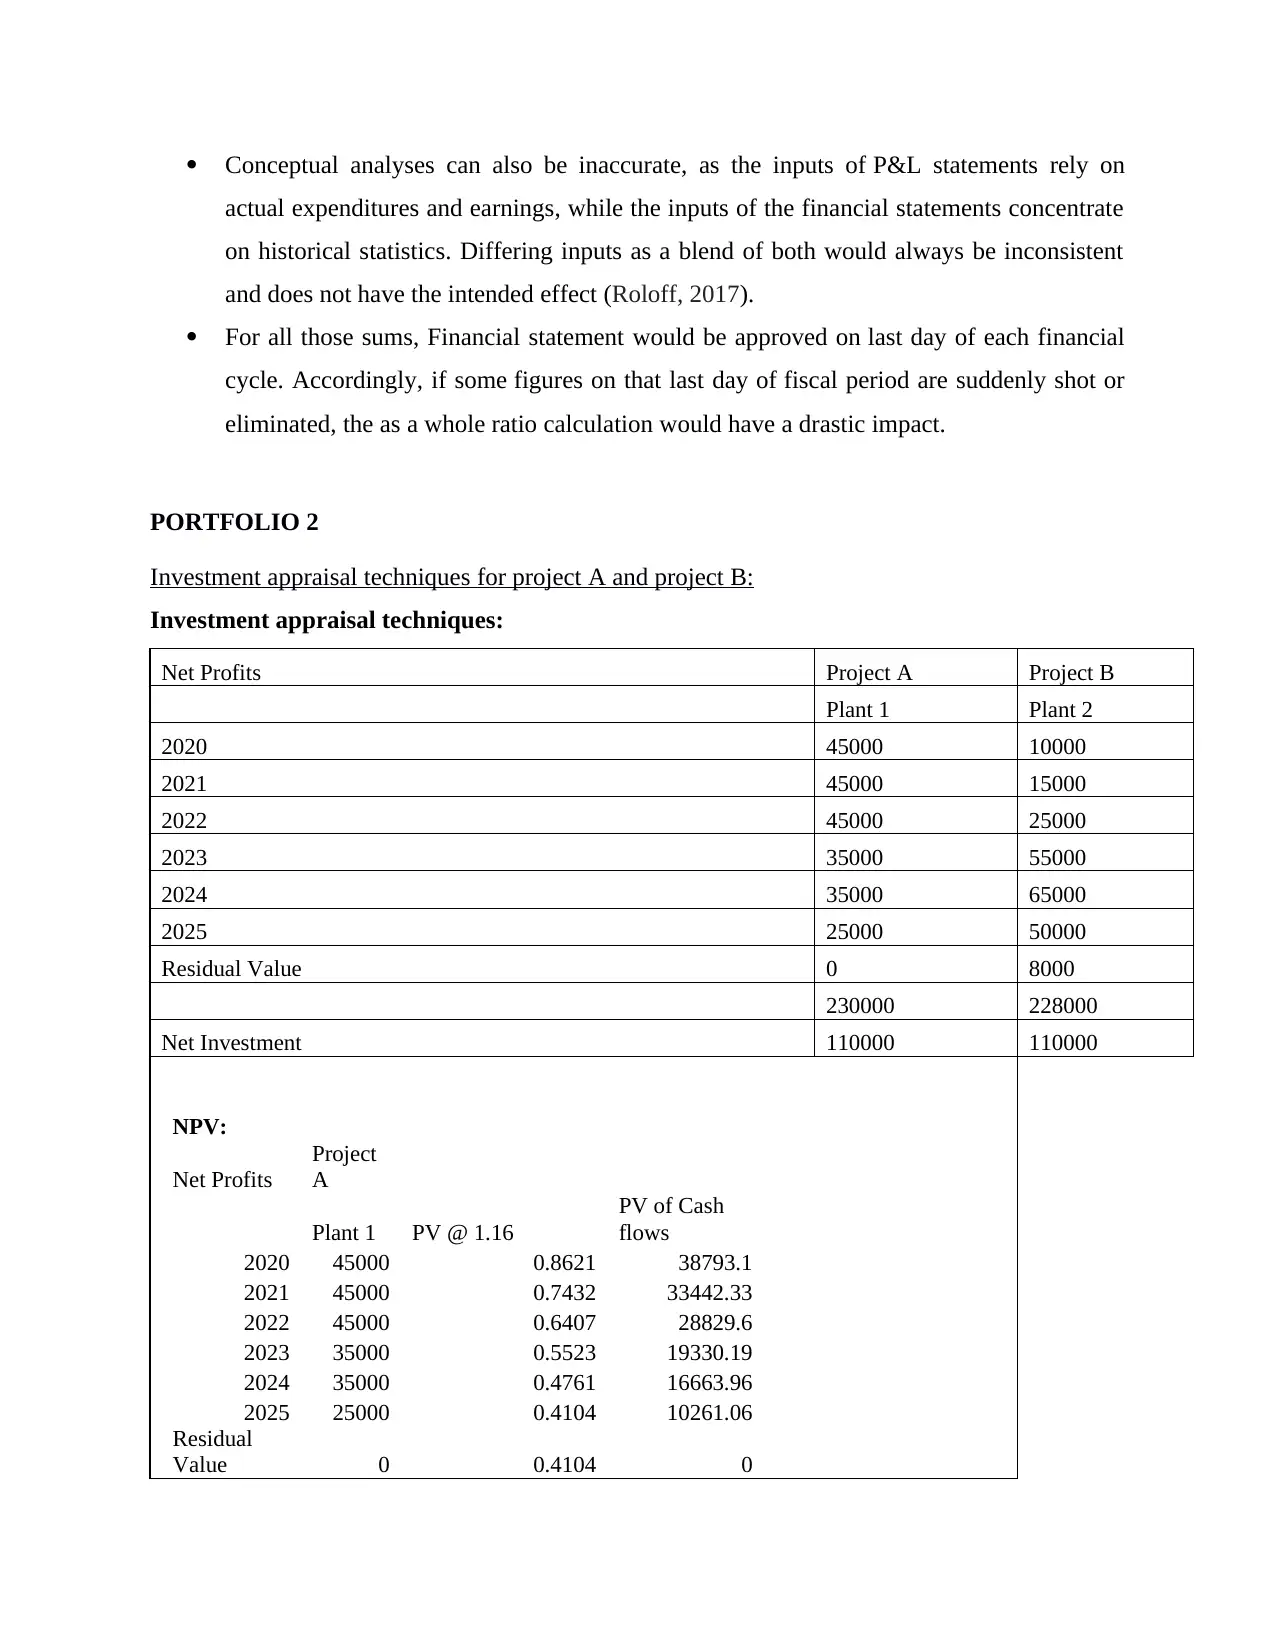
Investment appraisal techniques for project A and project B:
Investment appraisal techniques:
Net Profits Project A Project B
Plant 1 Plant 2
2020 45000 10000
2021 45000 15000
2022 45000 25000
2023 35000 55000
2024 35000 65000
2025 25000 50000
Residual Value 0 8000
230000 228000
Net Investment 110000 110000
NPV:
Net Profits
Project
A
Plant 1 PV @ 1.16
PV of Cash
flows
2020 45000 0.8621 38793.1
2021 45000 0.7432 33442.33
2022 45000 0.6407 28829.6
2023 35000 0.5523 19330.19
2024 35000 0.4761 16663.96
2025 25000 0.4104 10261.06
Residual
Value 0 0.4104 0
actual expenditures and earnings, while the inputs of the financial statements concentrate
on historical statistics. Differing inputs as a blend of both would always be inconsistent
and does not have the intended effect (Roloff, 2017).
For all those sums, Financial statement would be approved on last day of each financial
cycle. Accordingly, if some figures on that last day of fiscal period are suddenly shot or
eliminated, the as a whole ratio calculation would have a drastic impact.
PORTFOLIO 2
Investment appraisal techniques for project A and project B:
Investment appraisal techniques:
Net Profits Project A Project B
Plant 1 Plant 2
2020 45000 10000
2021 45000 15000
2022 45000 25000
2023 35000 55000
2024 35000 65000
2025 25000 50000
Residual Value 0 8000
230000 228000
Net Investment 110000 110000
NPV:
Net Profits
Project
A
Plant 1 PV @ 1.16
PV of Cash
flows
2020 45000 0.8621 38793.1
2021 45000 0.7432 33442.33
2022 45000 0.6407 28829.6
2023 35000 0.5523 19330.19
2024 35000 0.4761 16663.96
2025 25000 0.4104 10261.06
Residual
Value 0 0.4104 0
⊘ This is a preview!⊘
Do you want full access?
Subscribe today to unlock all pages.
Trusted by 1+ million students worldwide
1 out of 18
Related Documents


Your All-in-One AI-Powered Toolkit for Academic Success.
+13062052269
info@desklib.com
Available 24*7 on WhatsApp / Email
![[object Object]](/_next/static/media/star-bottom.7253800d.svg)
Unlock your academic potential
Copyright © 2020–2026 A2Z Services. All Rights Reserved. Developed and managed by ZUCOL.