Comprehensive Portfolio Analysis and Performance Review
VerifiedAdded on 2020/03/16
|9
|1444
|42
Report
AI Summary
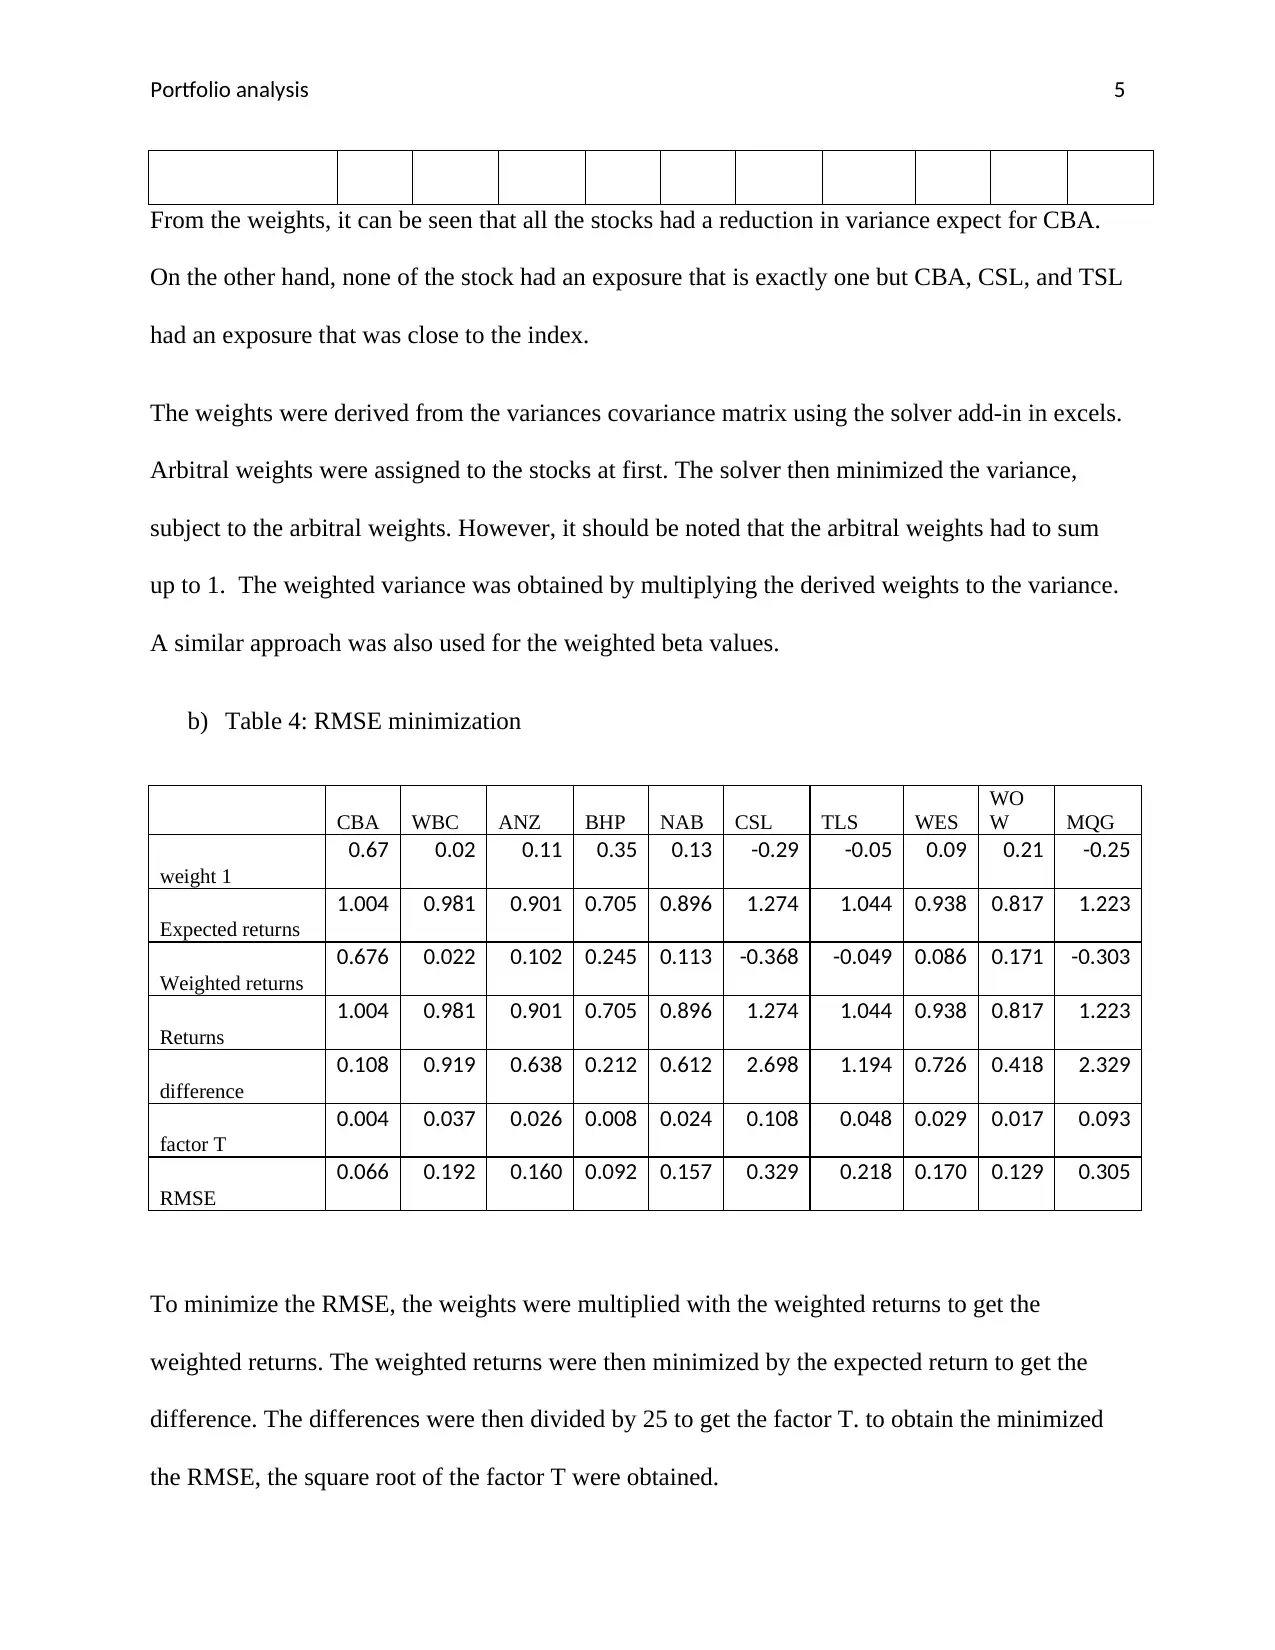
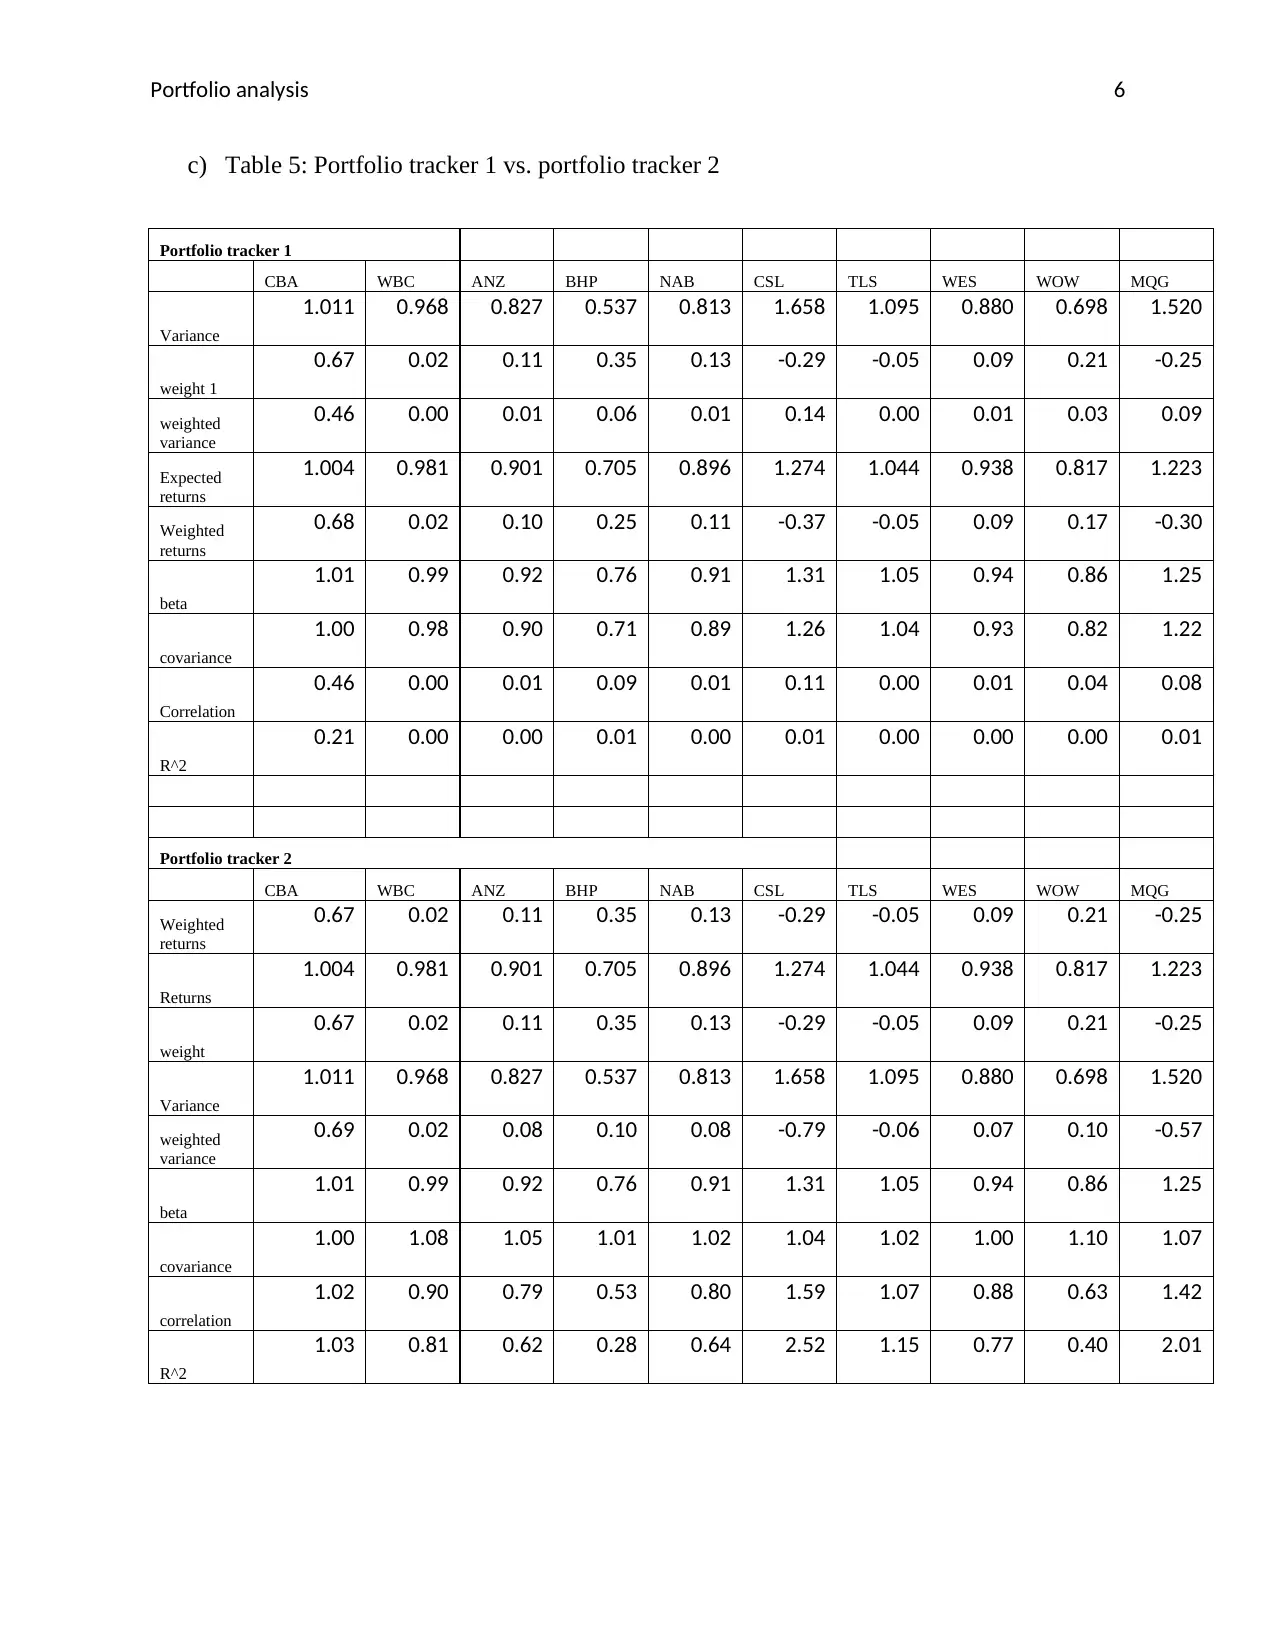
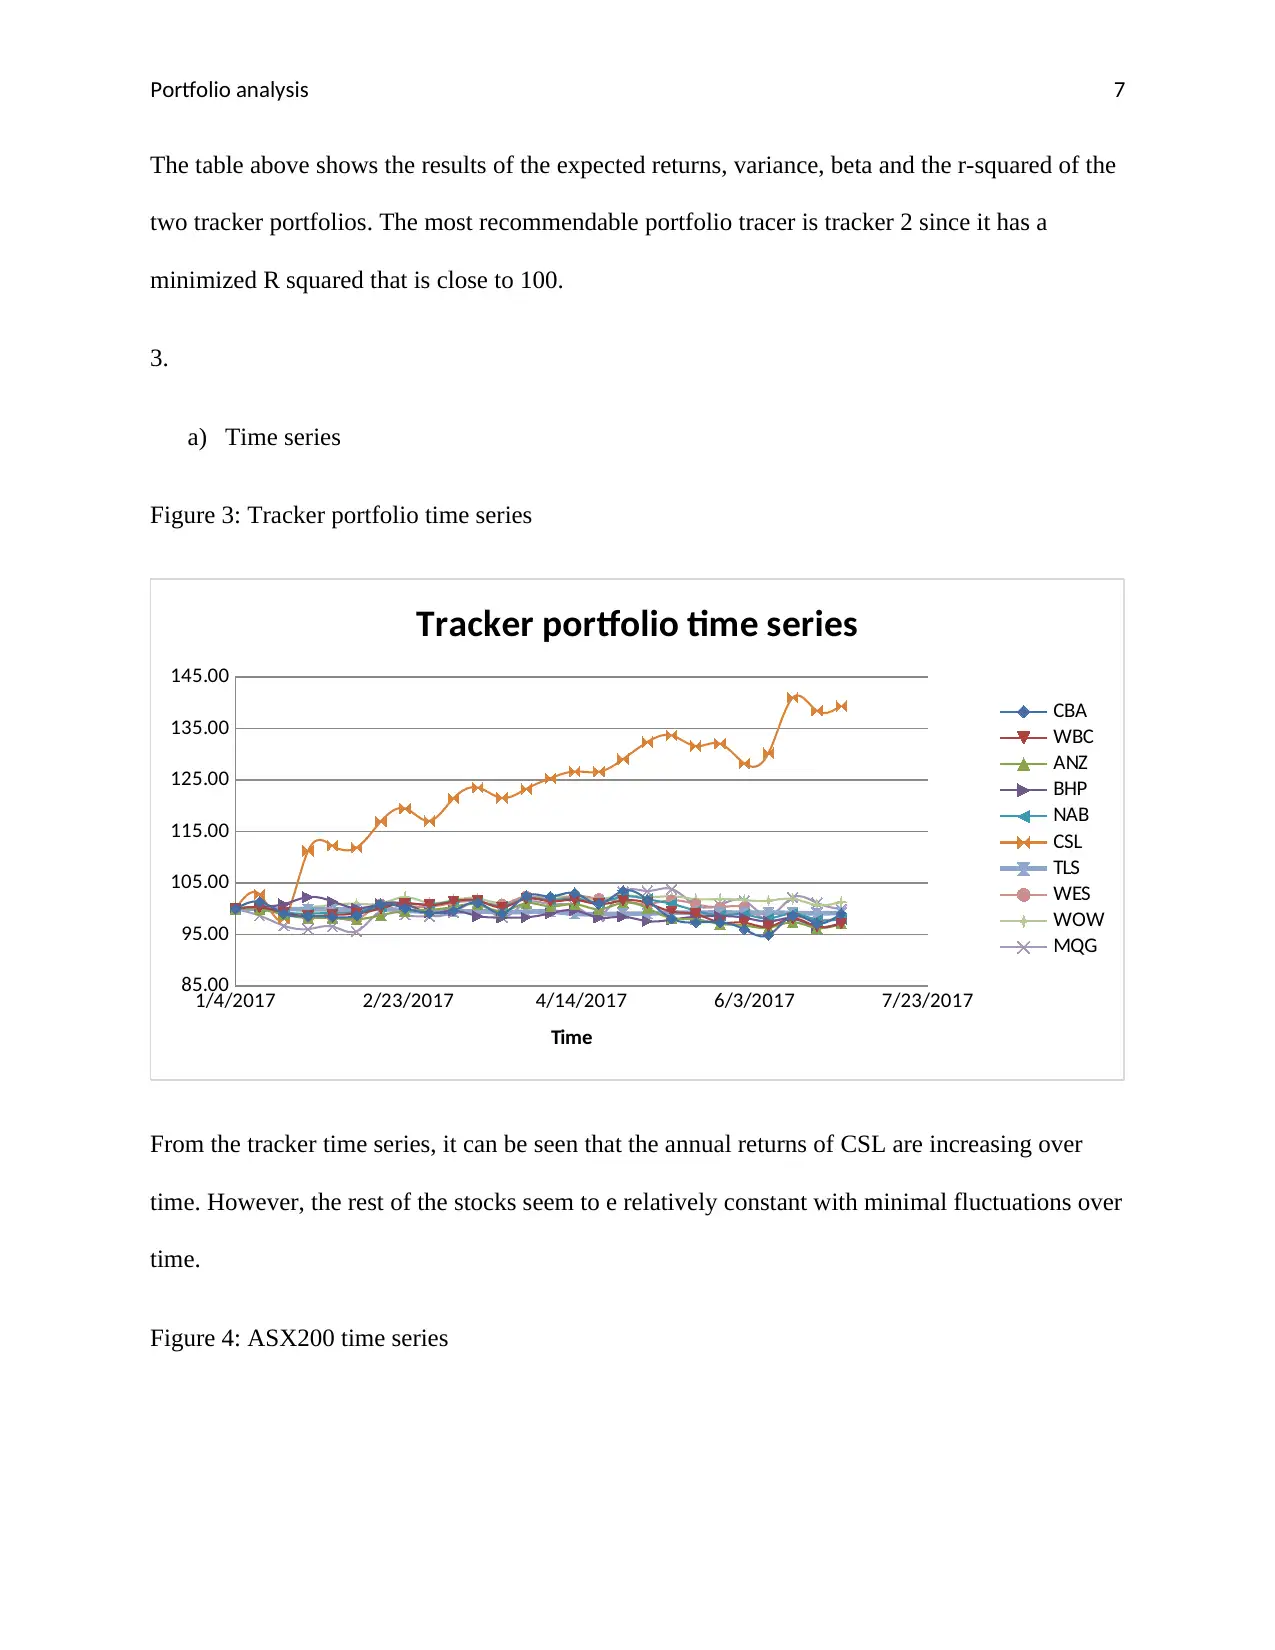
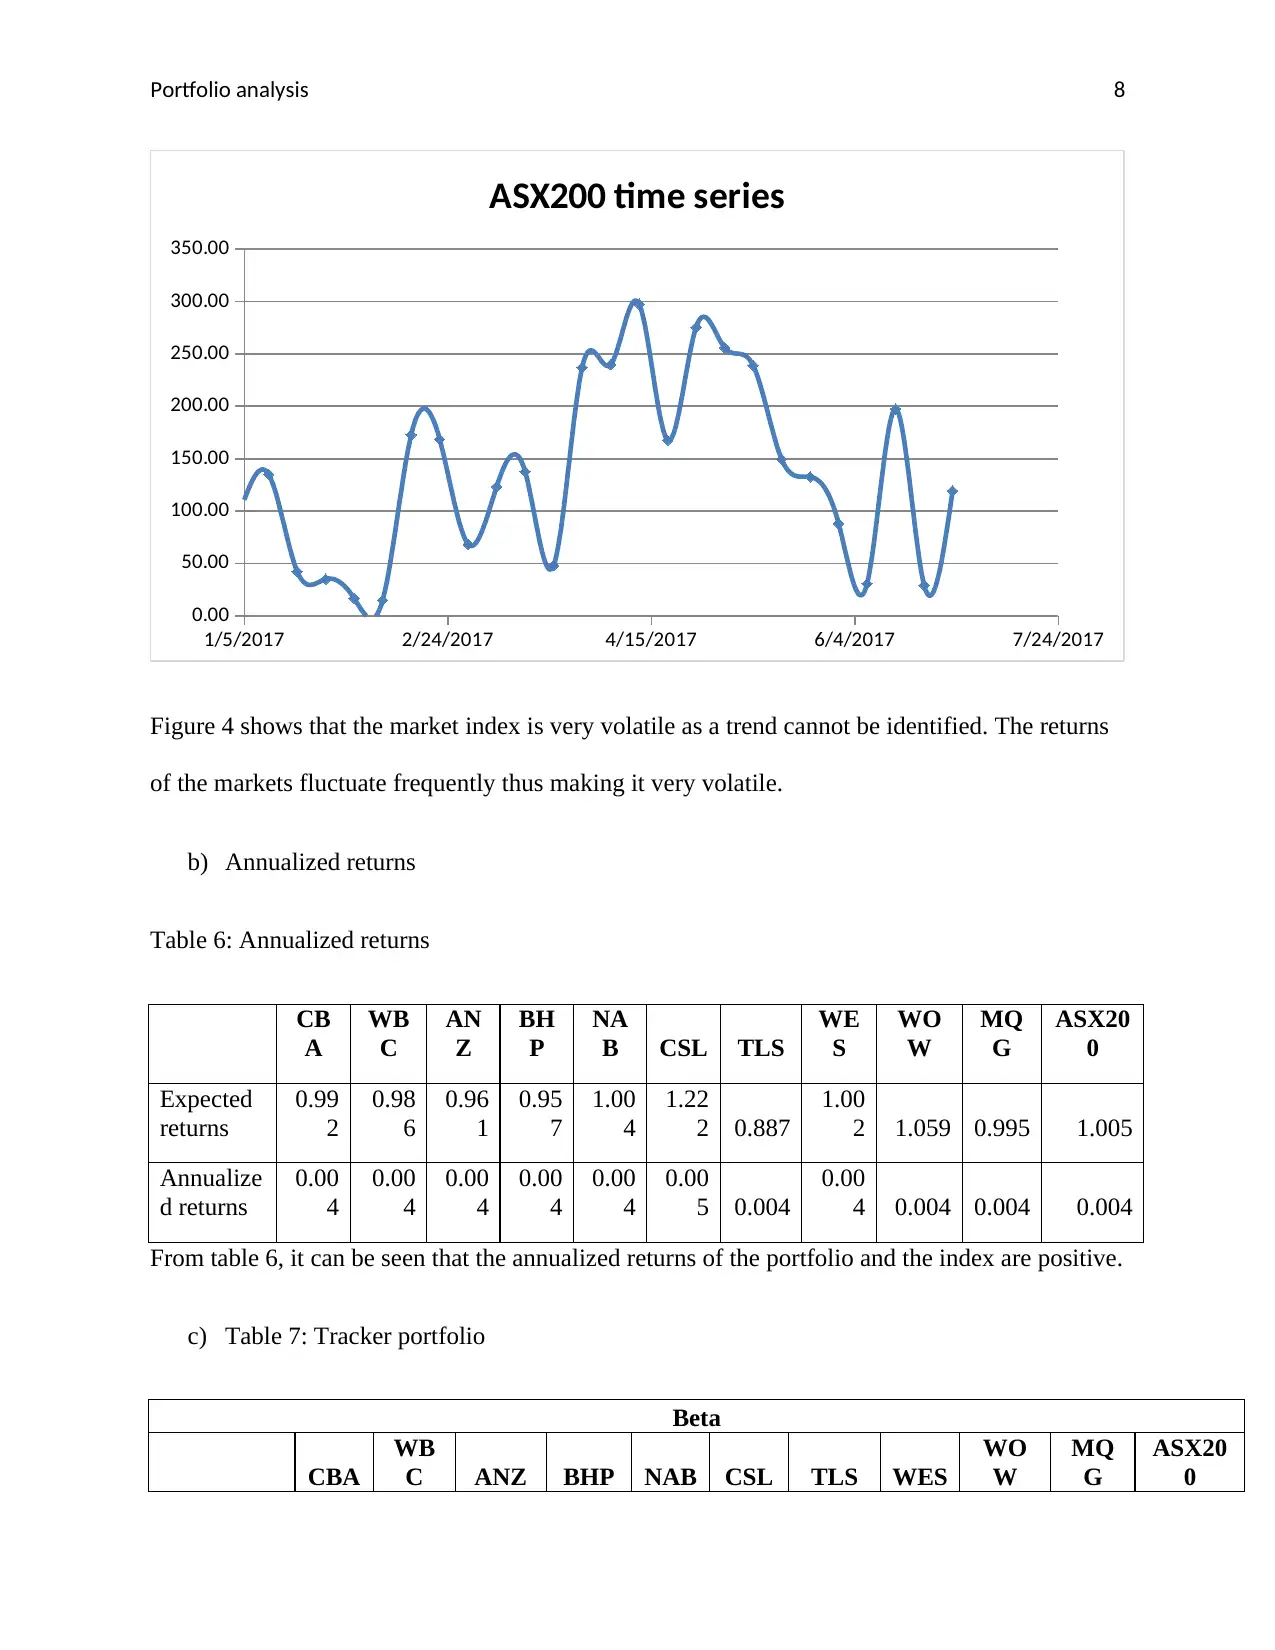
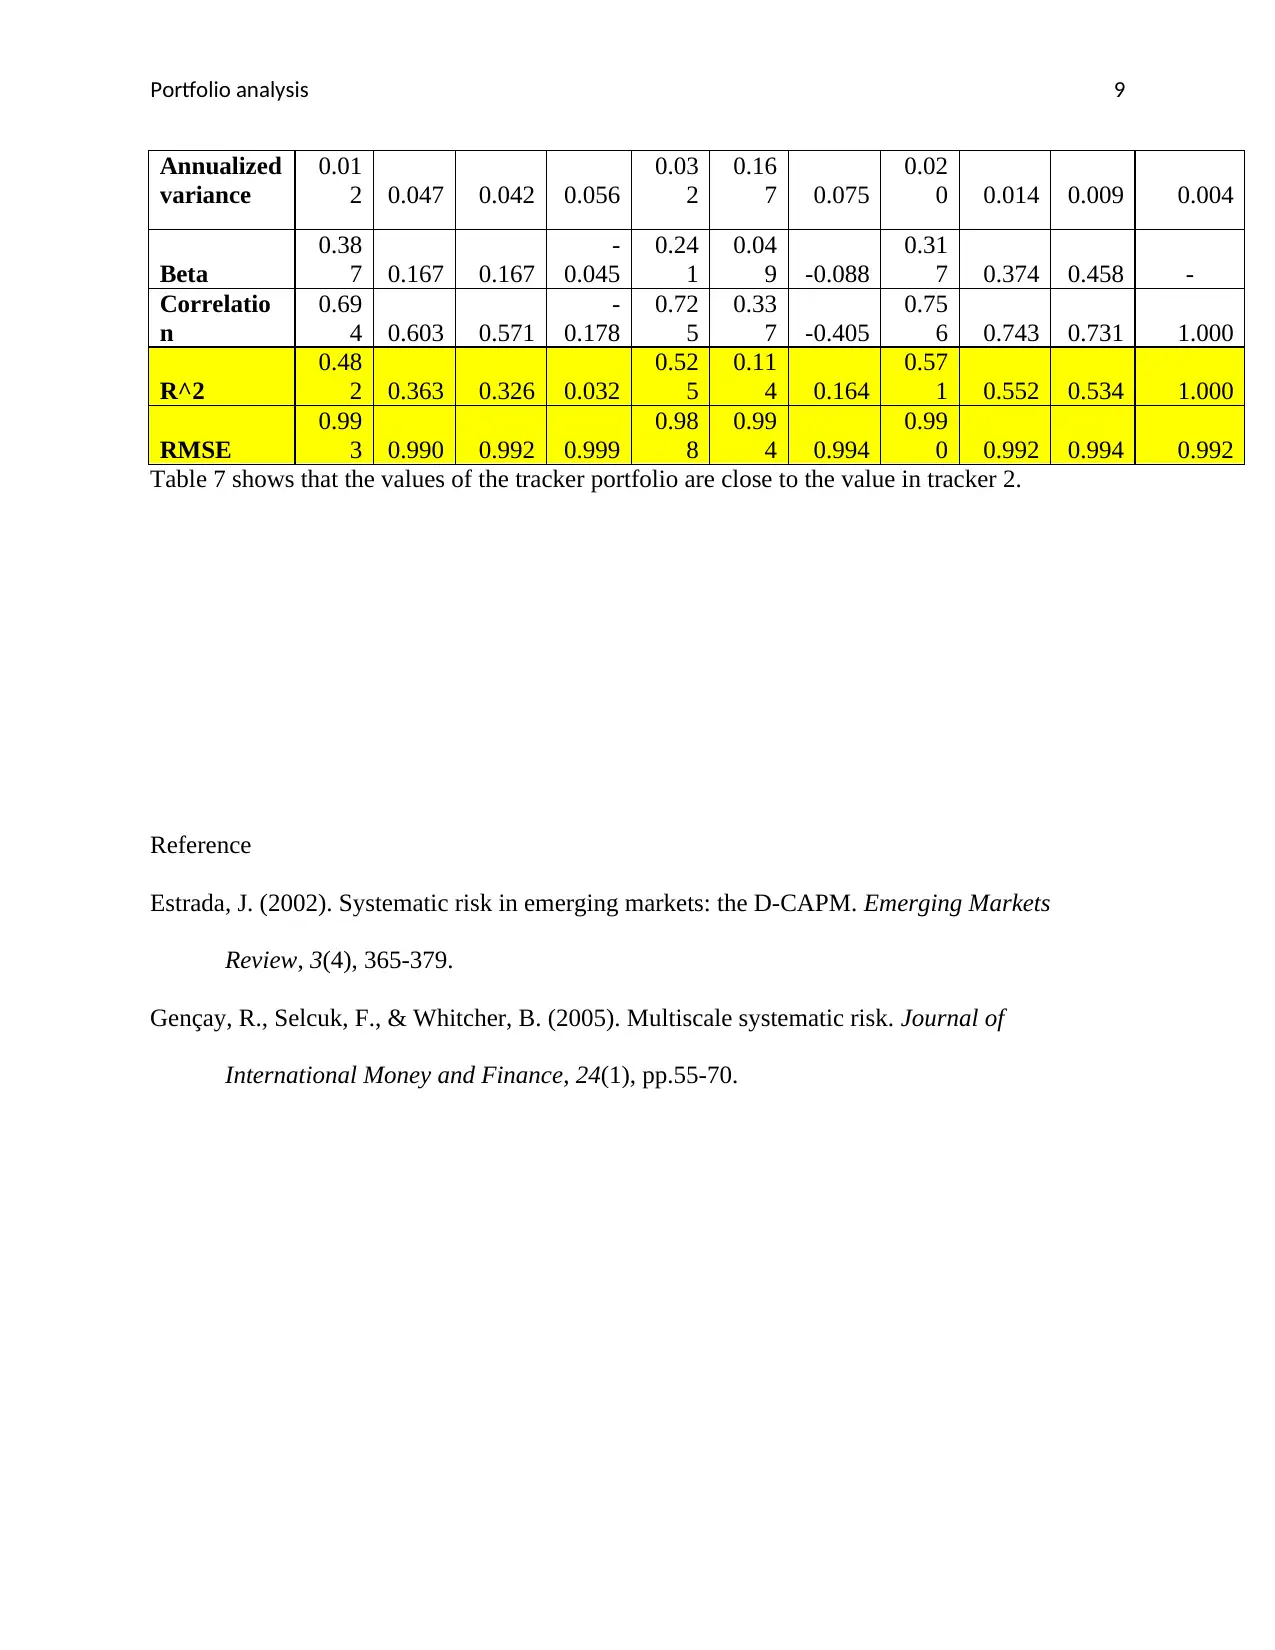
This report presents a comprehensive analysis of a financial portfolio, evaluating the performance of ten stocks and a market index. The analysis includes calculations of annualized returns, variance-covariance matrices, and stock betas to assess volatility and risk. The report decomposes total risk into systematic and unsystematic components and utilizes the Capital Market Line and Security Market Line for valuation. The study further explores portfolio optimization by determining stock weights that minimize variance, along with a comparison of two portfolio trackers. Time series data and annualized returns are examined to provide insights into portfolio trends and market performance. Key findings include the identification of overvalued and undervalued stocks, optimal stock weights, and the performance of different portfolio tracking methods. The report concludes with a discussion of the findings and their implications for portfolio management.
1 out of 9
Related Documents


Your All-in-One AI-Powered Toolkit for Academic Success.
+13062052269
info@desklib.com
Available 24*7 on WhatsApp / Email
![[object Object]](/_next/static/media/star-bottom.7253800d.svg)
Copyright © 2020–2026 A2Z Services. All Rights Reserved. Developed and managed by ZUCOL.