Impact of U.S. Quantitative Easing on Global Finance
VerifiedAdded on 2020/07/23
|12
|3084
|303
AI Summary
Quantitative Easing (QE) is a monetary policy tool used by central banks to stimulate economic activity by increasing the money supply and lowering interest rates. This assignment provides an in-depth analysis of QE’s global impacts on financial markets, particularly focusing on bond and equity funds. By examining historical data and scholarly resources, we assess how QE influences market volatility, investment strategies, and portfolio performance. Key aspects include understanding the correlation between QE policies and shifts in asset prices, evaluating risk measures such as standard deviation and Sharpe ratios, and discussing strategic adjustments for investors. The analysis is supported by financial models that compute expected returns, variances, and covariances to guide investment decisions under different economic conditions shaped by QE initiatives.

PORTFOLIO
MANAGEMENT
MANAGEMENT
Paraphrase This Document
Need a fresh take? Get an instant paraphrase of this document with our AI Paraphraser
TABLE OF CONTENTS
INTRODUCTION...........................................................................................................................1
Expected return and standard deviation of portfolio.......................................................................1
Difference between growth and value fund.....................................................................................1
Advantage and disadvantage of value and growth investing...........................................................2
Characteristics need to be coverd by bond......................................................................................3
Portfolio measurement.....................................................................................................................3
Implications of going for balanced portfolio in 50:50 portion for bond and equity........................4
Quantitative easing program and possibilities to halt it...................................................................4
Future possibilities for QE program and Fed balance sheet............................................................5
CONCLUSION................................................................................................................................6
REFERENCES................................................................................................................................7
APPENDIX......................................................................................................................................8
Calculations.................................................................................................................................8
Table 1Computation of return and standard deviation....................................................................1
Table 2Portoflio risk measurement..................................................................................................4
INTRODUCTION
Portfolio creation is an art because while preparing it one need to consider number of
factors and on that basis same is prepared. In the current report expected return and standard
deviation of portfolio is computed. Apart from this, in the report Sharpe and Trenyor ratios are
also computed. In second part of the research report, detail discussion is carried out on
quantitative easing programs and chances that same can be closed by the firm in the market. atn
end of the report finally, conclusion section is prepared in which in detail after analysi of entire
facts summary is formed in respect to entire work that is done in report.
Expected return and standard deviation of portfolio
Portfolio return is computed and its value is 16.80% as well as standard deviation value is
25.09 which means that if weights are taken in to account for each security alongwith return
percentage then overall portfolio return percentage will be 16.80%. Standard deviation reflect the
deviation that comes in values of the variable from mean value or distance that is between mean
and data points of variable. Higher standard deviation reflect that there is very high gap between
mean value and data points which means that stock is volatile in nature. On other hand, low
standard deviation value reflect that there is low gap between mean value and data points which
means that most of times data points are moving around mean value (Brealey and et.al., 2012). It
can be said that low standard deviation value reflect there is less fluctuation in variable values.
Hence, it can be assumed that low standard deviation is better for the firm then high standard
deviation. From table it can be seen that standard deviation value is 25.09 which means that
portfolio return is moving at very slow rate. Hence, it can be said that portfolio is giving stable
and good amount of return to the investors. Due to this reason further investment can be made on
the mentioned portfolio.
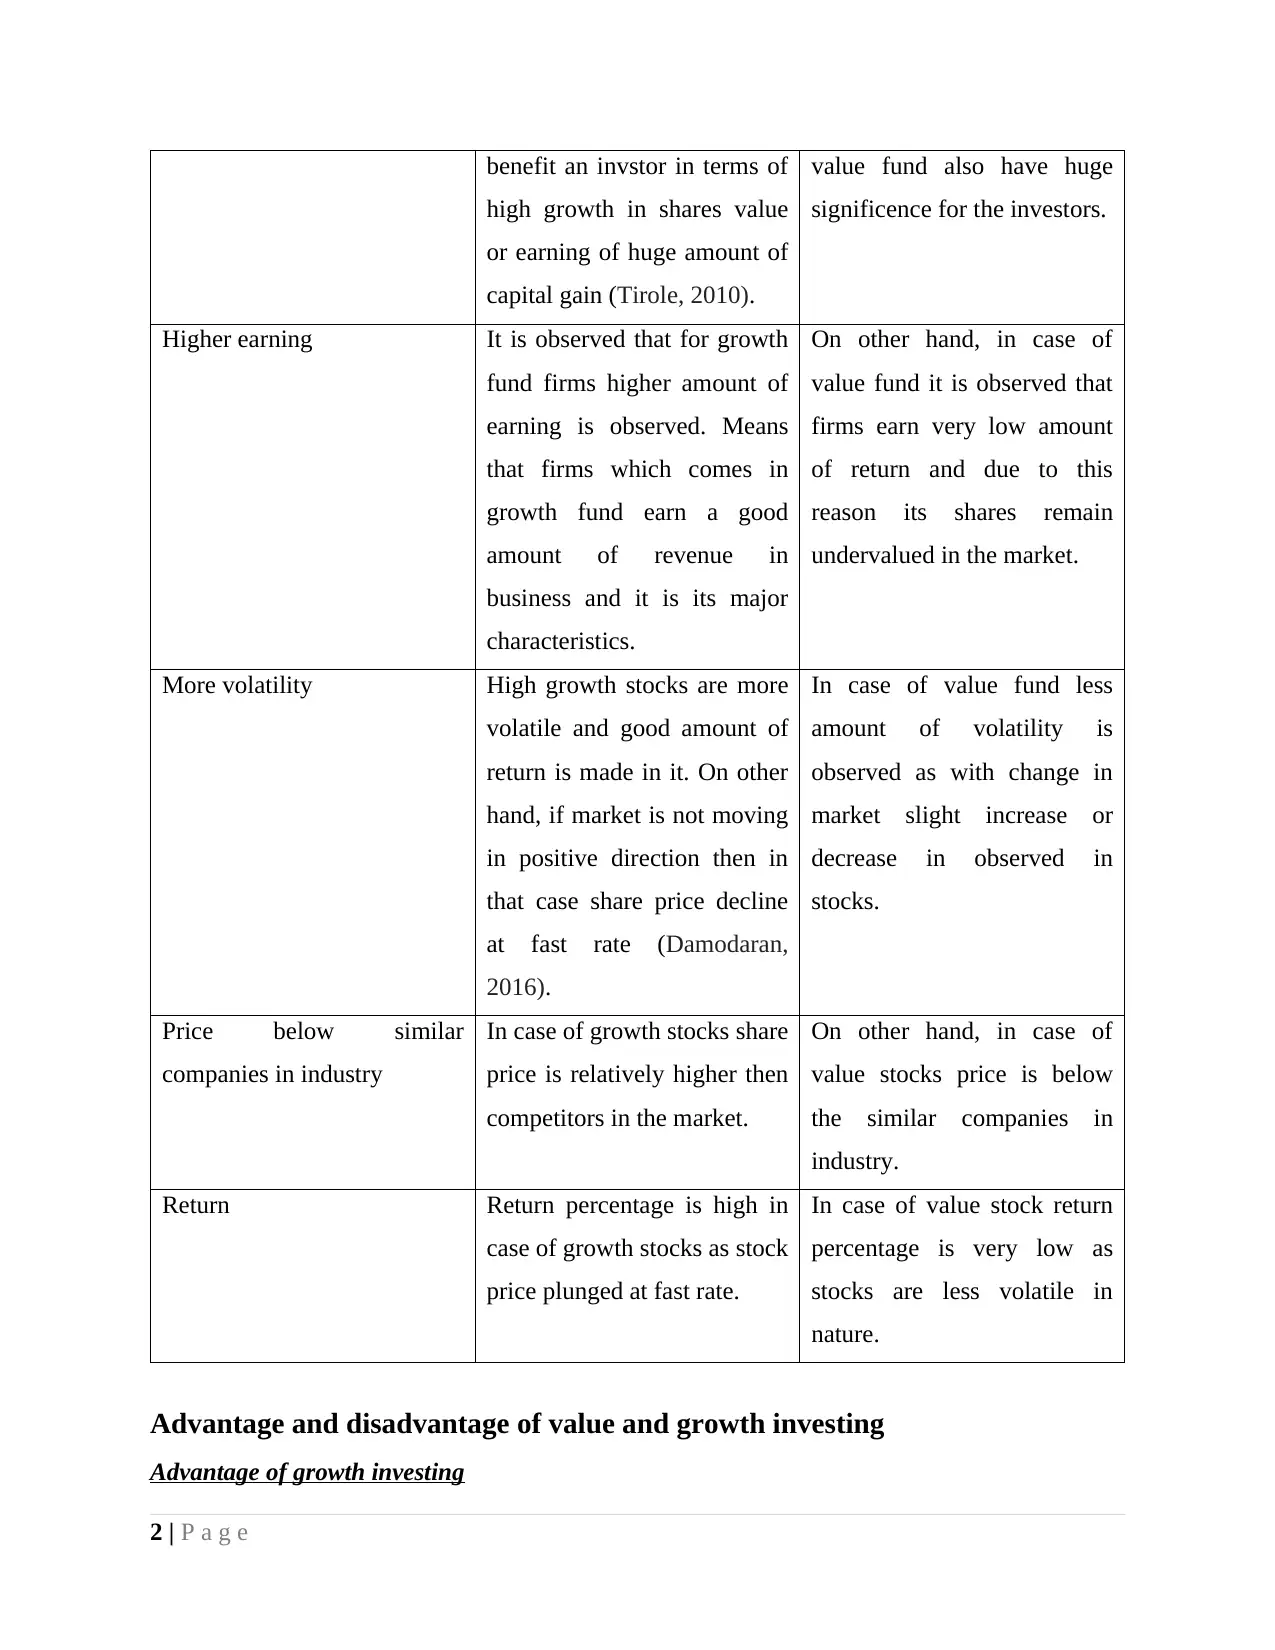
Difference between growth and value fund
Particulars Growth fund Value fund
Higher price In case of growth fund there
is very high price of the
product and investor try to
take advantage of this high
product price. Hence, it can
be said that higher price
In case of value fund thing is
inverse as it can be observed
that in case of value fund
most of stocks are
undervalued but they have
huge growth potential. Hence,
1 | P a g e
Portfolio creation is an art because while preparing it one need to consider number of
factors and on that basis same is prepared. In the current report expected return and standard
deviation of portfolio is computed. Apart from this, in the report Sharpe and Trenyor ratios are
also computed. In second part of the research report, detail discussion is carried out on
quantitative easing programs and chances that same can be closed by the firm in the market. atn
end of the report finally, conclusion section is prepared in which in detail after analysi of entire
facts summary is formed in respect to entire work that is done in report.
Expected return and standard deviation of portfolio
Portfolio return is computed and its value is 16.80% as well as standard deviation value is
25.09 which means that if weights are taken in to account for each security alongwith return
percentage then overall portfolio return percentage will be 16.80%. Standard deviation reflect the
deviation that comes in values of the variable from mean value or distance that is between mean
and data points of variable. Higher standard deviation reflect that there is very high gap between
mean value and data points which means that stock is volatile in nature. On other hand, low
standard deviation value reflect that there is low gap between mean value and data points which
means that most of times data points are moving around mean value (Brealey and et.al., 2012). It
can be said that low standard deviation value reflect there is less fluctuation in variable values.
Hence, it can be assumed that low standard deviation is better for the firm then high standard
deviation. From table it can be seen that standard deviation value is 25.09 which means that
portfolio return is moving at very slow rate. Hence, it can be said that portfolio is giving stable
and good amount of return to the investors. Due to this reason further investment can be made on
the mentioned portfolio.
Difference between growth and value fund
Particulars Growth fund Value fund
Higher price In case of growth fund there
is very high price of the
product and investor try to
take advantage of this high
product price. Hence, it can
be said that higher price
In case of value fund thing is
inverse as it can be observed
that in case of value fund
most of stocks are
undervalued but they have
huge growth potential. Hence,
1 | P a g e
⊘ This is a preview!⊘
Do you want full access?
Subscribe today to unlock all pages.
Trusted by 1+ million students worldwide
benefit an invstor in terms of
high growth in shares value
or earning of huge amount of
capital gain (Tirole, 2010).
value fund also have huge
significence for the investors.
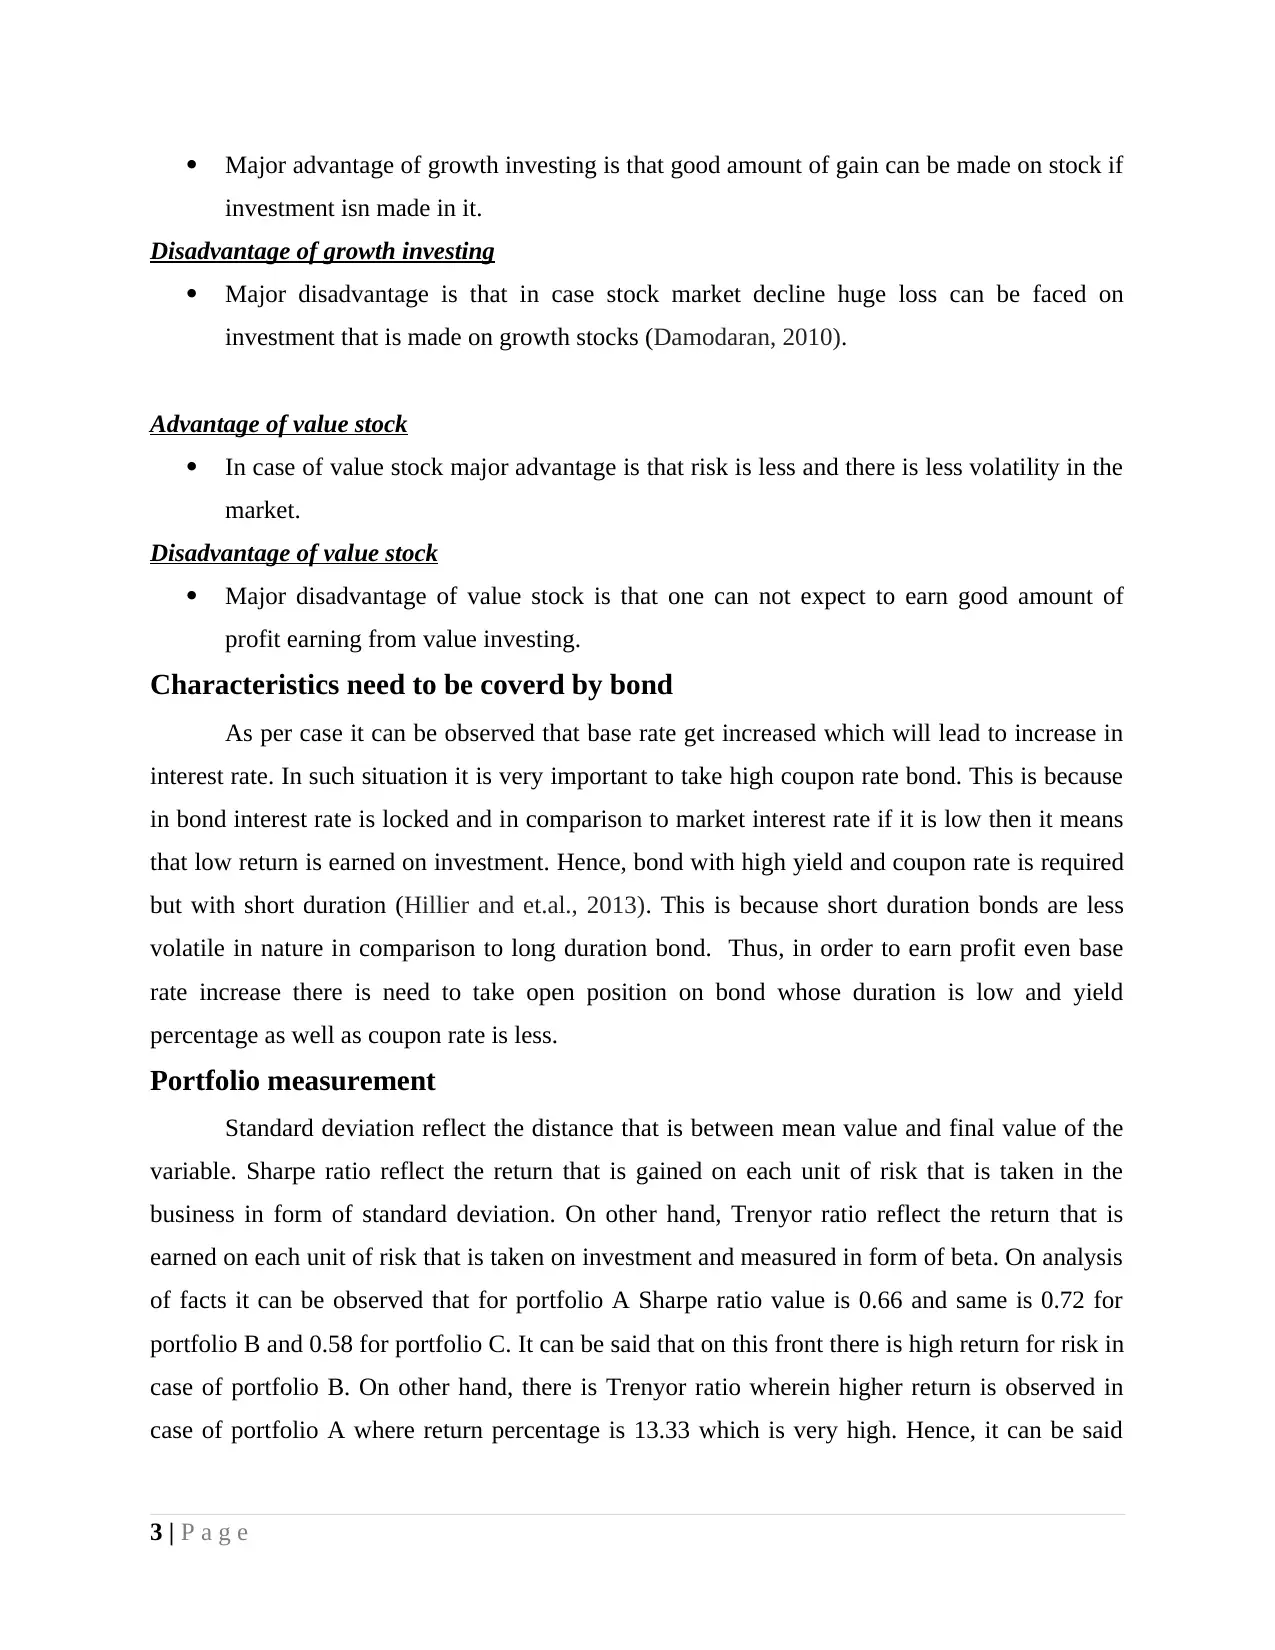
Higher earning It is observed that for growth
fund firms higher amount of
earning is observed. Means
that firms which comes in
growth fund earn a good
amount of revenue in
business and it is its major
characteristics.
On other hand, in case of
value fund it is observed that
firms earn very low amount
of return and due to this
reason its shares remain
undervalued in the market.
More volatility High growth stocks are more
volatile and good amount of
return is made in it. On other
hand, if market is not moving
in positive direction then in
that case share price decline
at fast rate (Damodaran,
2016).
In case of value fund less
amount of volatility is
observed as with change in
market slight increase or
decrease in observed in
stocks.
Price below similar
companies in industry
In case of growth stocks share
price is relatively higher then
competitors in the market.
On other hand, in case of
value stocks price is below
the similar companies in
industry.
Return Return percentage is high in
case of growth stocks as stock
price plunged at fast rate.
In case of value stock return
percentage is very low as
stocks are less volatile in
nature.
Advantage and disadvantage of value and growth investing
Advantage of growth investing
2 | P a g e
high growth in shares value
or earning of huge amount of
capital gain (Tirole, 2010).
value fund also have huge
significence for the investors.
Higher earning It is observed that for growth
fund firms higher amount of
earning is observed. Means
that firms which comes in
growth fund earn a good
amount of revenue in
business and it is its major
characteristics.
On other hand, in case of
value fund it is observed that
firms earn very low amount
of return and due to this
reason its shares remain
undervalued in the market.
More volatility High growth stocks are more
volatile and good amount of
return is made in it. On other
hand, if market is not moving
in positive direction then in
that case share price decline
at fast rate (Damodaran,
2016).
In case of value fund less
amount of volatility is
observed as with change in
market slight increase or
decrease in observed in
stocks.
Price below similar
companies in industry
In case of growth stocks share
price is relatively higher then
competitors in the market.
On other hand, in case of
value stocks price is below
the similar companies in
industry.
Return Return percentage is high in
case of growth stocks as stock
price plunged at fast rate.
In case of value stock return
percentage is very low as
stocks are less volatile in
nature.
Advantage and disadvantage of value and growth investing
Advantage of growth investing
2 | P a g e
Paraphrase This Document
Need a fresh take? Get an instant paraphrase of this document with our AI Paraphraser
Major advantage of growth investing is that good amount of gain can be made on stock if
investment isn made in it.
Disadvantage of growth investing
Major disadvantage is that in case stock market decline huge loss can be faced on
investment that is made on growth stocks (Damodaran, 2010).
Advantage of value stock
In case of value stock major advantage is that risk is less and there is less volatility in the
market.
Disadvantage of value stock
Major disadvantage of value stock is that one can not expect to earn good amount of
profit earning from value investing.
Characteristics need to be coverd by bond
As per case it can be observed that base rate get increased which will lead to increase in
interest rate. In such situation it is very important to take high coupon rate bond. This is because
in bond interest rate is locked and in comparison to market interest rate if it is low then it means
that low return is earned on investment. Hence, bond with high yield and coupon rate is required
but with short duration (Hillier and et.al., 2013). This is because short duration bonds are less
volatile in nature in comparison to long duration bond. Thus, in order to earn profit even base
rate increase there is need to take open position on bond whose duration is low and yield
percentage as well as coupon rate is less.
Portfolio measurement
Standard deviation reflect the distance that is between mean value and final value of the
variable. Sharpe ratio reflect the return that is gained on each unit of risk that is taken in the
business in form of standard deviation. On other hand, Trenyor ratio reflect the return that is
earned on each unit of risk that is taken on investment and measured in form of beta. On analysis
of facts it can be observed that for portfolio A Sharpe ratio value is 0.66 and same is 0.72 for
portfolio B and 0.58 for portfolio C. It can be said that on this front there is high return for risk in
case of portfolio B. On other hand, there is Trenyor ratio wherein higher return is observed in
case of portfolio A where return percentage is 13.33 which is very high. Hence, it can be said
3 | P a g e
that is the reason due to which in case of Sharpe ratio portfolio B have high return and in case of
Trenyor ratio portfolio A have high return.
Implications of going for balanced portfolio in 50:50 portion for bond and
equity
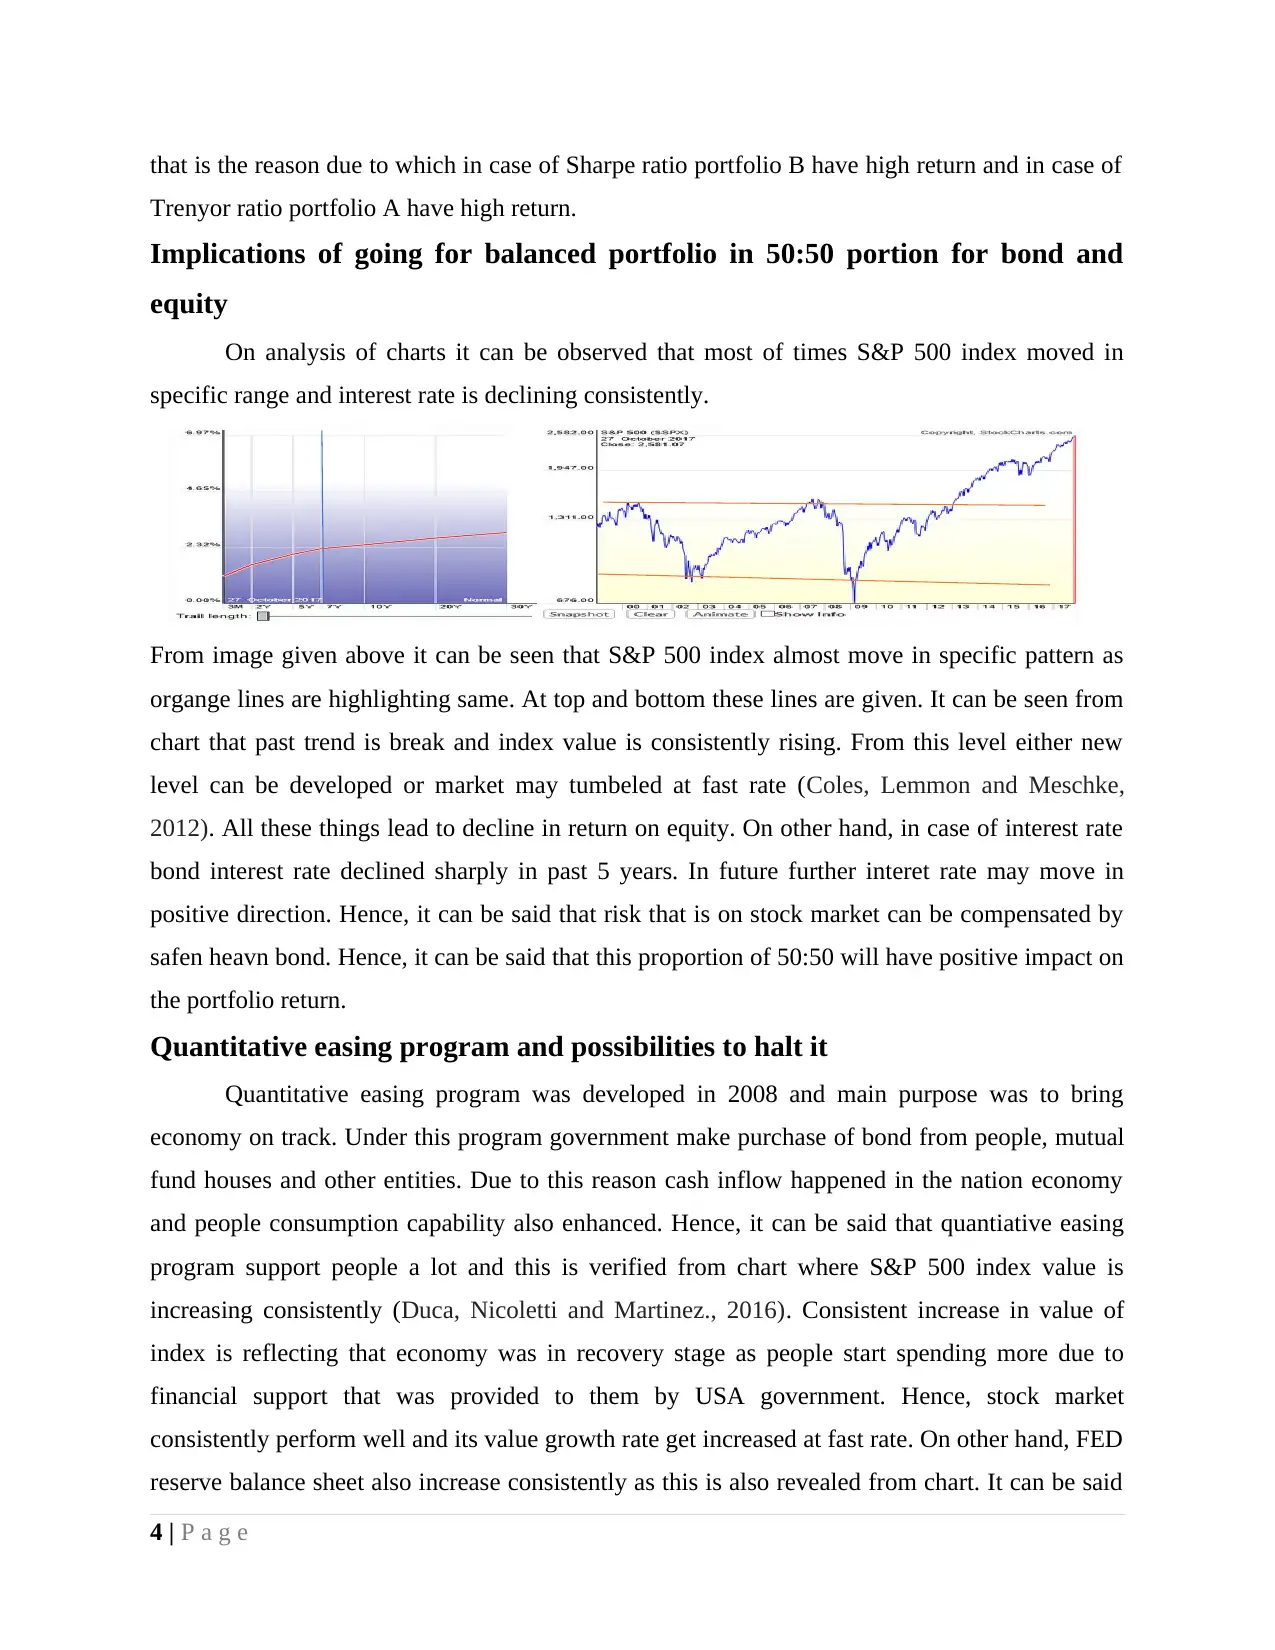
On analysis of charts it can be observed that most of times S&P 500 index moved in
specific range and interest rate is declining consistently.
From image given above it can be seen that S&P 500 index almost move in specific pattern as
organge lines are highlighting same. At top and bottom these lines are given. It can be seen from
chart that past trend is break and index value is consistently rising. From this level either new
level can be developed or market may tumbeled at fast rate (Coles, Lemmon and Meschke,
2012). All these things lead to decline in return on equity. On other hand, in case of interest rate
bond interest rate declined sharply in past 5 years. In future further interet rate may move in
positive direction. Hence, it can be said that risk that is on stock market can be compensated by
safen heavn bond. Hence, it can be said that this proportion of 50:50 will have positive impact on
the portfolio return.
Quantitative easing program and possibilities to halt it
Quantitative easing program was developed in 2008 and main purpose was to bring
economy on track. Under this program government make purchase of bond from people, mutual
fund houses and other entities. Due to this reason cash inflow happened in the nation economy
and people consumption capability also enhanced. Hence, it can be said that quantiative easing
program support people a lot and this is verified from chart where S&P 500 index value is
increasing consistently (Duca, Nicoletti and Martinez., 2016). Consistent increase in value of
index is reflecting that economy was in recovery stage as people start spending more due to
financial support that was provided to them by USA government. Hence, stock market
consistently perform well and its value growth rate get increased at fast rate. On other hand, FED
reserve balance sheet also increase consistently as this is also revealed from chart. It can be said
4 | P a g e
Trenyor ratio portfolio A have high return.
Implications of going for balanced portfolio in 50:50 portion for bond and
equity
On analysis of charts it can be observed that most of times S&P 500 index moved in
specific range and interest rate is declining consistently.
From image given above it can be seen that S&P 500 index almost move in specific pattern as
organge lines are highlighting same. At top and bottom these lines are given. It can be seen from
chart that past trend is break and index value is consistently rising. From this level either new
level can be developed or market may tumbeled at fast rate (Coles, Lemmon and Meschke,
2012). All these things lead to decline in return on equity. On other hand, in case of interest rate
bond interest rate declined sharply in past 5 years. In future further interet rate may move in
positive direction. Hence, it can be said that risk that is on stock market can be compensated by
safen heavn bond. Hence, it can be said that this proportion of 50:50 will have positive impact on
the portfolio return.
Quantitative easing program and possibilities to halt it
Quantitative easing program was developed in 2008 and main purpose was to bring
economy on track. Under this program government make purchase of bond from people, mutual
fund houses and other entities. Due to this reason cash inflow happened in the nation economy
and people consumption capability also enhanced. Hence, it can be said that quantiative easing
program support people a lot and this is verified from chart where S&P 500 index value is
increasing consistently (Duca, Nicoletti and Martinez., 2016). Consistent increase in value of
index is reflecting that economy was in recovery stage as people start spending more due to
financial support that was provided to them by USA government. Hence, stock market
consistently perform well and its value growth rate get increased at fast rate. On other hand, FED
reserve balance sheet also increase consistently as this is also revealed from chart. It can be said
4 | P a g e
⊘ This is a preview!⊘
Do you want full access?
Subscribe today to unlock all pages.
Trusted by 1+ million students worldwide
that launch of quantitative easing program lead to increase in spending capacity of people but at
same time due to this reason balance sheet also increased at rapid rate. It is the full support to the
general public due to which to some extent recovery start in an economy and index value
increased at very fast rate from 2008 to 2015.
Goal: On basis of entire discussion that is done above it can be said that major goal
behind quantitative easing program was to increase expenditure from side of people so
that economy can be bring back on growth track.
Consequences: Major consequence of quantitative easing program was that balance sheet
of FED reserve increase at fast rate as some of economist had view that as expected
results are not obtained from QE program (Jarrow and Li, 2014).
Outcome: Economy of USA gradually comes on track and as government give support to
people to meet their educational and health expenses. Thus, outcome was positive for
nation economy.
Future possibilities for QE program and Fed balance sheet
There is future possibility that in future time period quantitative easing program will be
stopped by the USA FED reserve. This is because now USA economy is on growth track and
labour market condition get improved to great extent. Hence, it can be said that things are going
well to some extent in the nation economy and due to this reason quantitative easing program can
be stopped by the USA central bank. USA central bank state that substantive improvement
comes in the nation economy in terms of outlook that is towards labour market of the nation. In
other words it can be said that since starting of quantitative easing program whatever was
condition of nation now get improveed to large extent (Barroso, da Silva and Sales, 2016).
Economy become more broader then before and there is high potential in its growth. Hence, in
future time period economy itself will be able to handle itself in complex condition and soon it
will come on track. It can be said that this is the right time for the USA government to close its
quantitative easing program. All these things will have huge impact on the assets and liability. It
must be noted that when FED program was launched it was operated in specific manner under
which assets were purchased in terms of bond from the market and in this way cash inflow
happened in the nation economy. It can be said that due to consistent purchase of bond FED
balance sheet increased regularly (Cobham and Kang, 2012). Hence, it can be said that in future
time period there is possibility that quantitative easing program can be halted and due to this
5 | P a g e
Paraphrase This Document
Need a fresh take? Get an instant paraphrase of this document with our AI Paraphraser
reason both assets and liabilities will be reduced in the central bank balance sheet. It can be said
that with consistent recovery in the economy in future time period quantitative easing program
soon can be closed by the central bank of the nation. However, in case any downturn is observed
in the USA economy due to any reason then in that case this program can be extended to the
some extent by the central bank of USA. However, till the time chances are developed that
quantitative easing program can be shut down as global economy is also observing recovery.
USA government or FED decision to stop quantitative easing program will depend on number of
factors like growth rate of world major economies like China, India, Japan and some of
European nations. If economic condition of these nations will not be good then in that case
global economy can derail from growth track (Cho and Rhee, 2014). Hence, it solely depend on
internation level economic conditions whether central bank close its policy. In current time
period many new reforms are launched in multiple nations of the world and due to this reason
there are chances that economic growth of nations will accelerate and this will bring stability in
international market. If all these happened then in that case there are full chances that central
bank may close its qunaitative easing program. All these things will lead to decline in assets and
liability of central bank which will made it stronger. Currently, also many countries governments
are working together to handle the situation through common platform like BRICS and EU etc.
Collective efforts of the varied nations government will ensure that now global economy
consistently grow (Monaghan., 2014). It is regional cooperation that help nations to come on
recovery track. Thus, it can be said that all these things if gone well then in that case in future
time period government of USA and central bank will stop implementation of quantitative
easing program in the nation and this will lead to decline in assets and liability in balance sheet
of central bank as well as it become more balanced then before. Market will continue to perform
well as it is expected that in future time period USA economy will be more stronger then current
time period.
CONCLUSION
On the basis of above discussion and analysis it is concluded that there is significent
importance of methods like Sharpe ratio and Trenyor ratio for the firms. This is because by using
these approaches in systematic manner return that is earned on unit of risk is identified. It is also
concluded that central bank of USA can close its quantitative easing program soon. Bonds that
6 | P a g e

have short durtation are less risky and coupon percentage is also high on them. Hence, according
to changes that are made in the base rate specific bond need to be pick for the portfolio.
7 | P a g e
to changes that are made in the base rate specific bond need to be pick for the portfolio.
7 | P a g e
⊘ This is a preview!⊘
Do you want full access?
Subscribe today to unlock all pages.
Trusted by 1+ million students worldwide
REFERENCES
Books and Journals
Barroso, J.B.R., da Silva, L.A.P. and Sales, A.S., 2016. Quantitative Easing and Related Capital
Flows into Brazil: measuring its effects and transmission channels through a rigorous
counterfactual evaluation. Journal of International Money and Finance. 67. pp.102-122.
Brealey, R.A., Myers, S.C., Allen, F. and Mohanty, P., 2012. Principles of corporate finance.
Tata McGraw-Hill Education.
Cho, D. and Rhee, C., 2014. Effects of quantitative easing on asia: capital flows and financial
markets. The Singapore Economic Review. 59(03). p.1450018.
Cobham, D. and Kang, Y., 2012. Financial crisis and quantitative easing: can broad money tell
us anything?. The Manchester School. 80(s1). pp.54-76.
Coles, J.L., Lemmon, M.L. and Meschke, J.F., 2012. Structural models and endogeneity in
corporate finance: The link between managerial ownership and corporate
performance. Journal of Financial Economics. 103(1). pp.149-168.
Damodaran, A., 2010. Applied corporate finance. John Wiley & Sons.
Damodaran, A., 2016. Damodaran on valuation: security analysis for investment and corporate
finance. John Wiley & Sons.
Duca, M.L., Nicoletti, G. and Martinez, A.V., 2016. Global corporate bond issuance: what role
for US quantitative easing?. Journal of International Money and Finance. 60. pp.114-150.
Hillier, D. and et.al., 2013. Corporate finance. McGraw Hill.
Jarrow, R. and Li, H., 2014. The impact of quantitative easing on the US term structure of
interest rates. Review of Derivatives Research. 17(3). pp.287-321.
Tirole, J., 2010. The theory of corporate finance. Princeton University Press.
Online
Monaghan., A., 2014. [Online]. US Federal reserve to end quantitative easing program.
Available through:<https://www.theguardian.com/business/2014/oct/29/us-federal-reserve-
end-quantitative-easing-programme>.
8 | P a g e
Paraphrase This Document
Need a fresh take? Get an instant paraphrase of this document with our AI Paraphraser
APPENDIX
Calculations
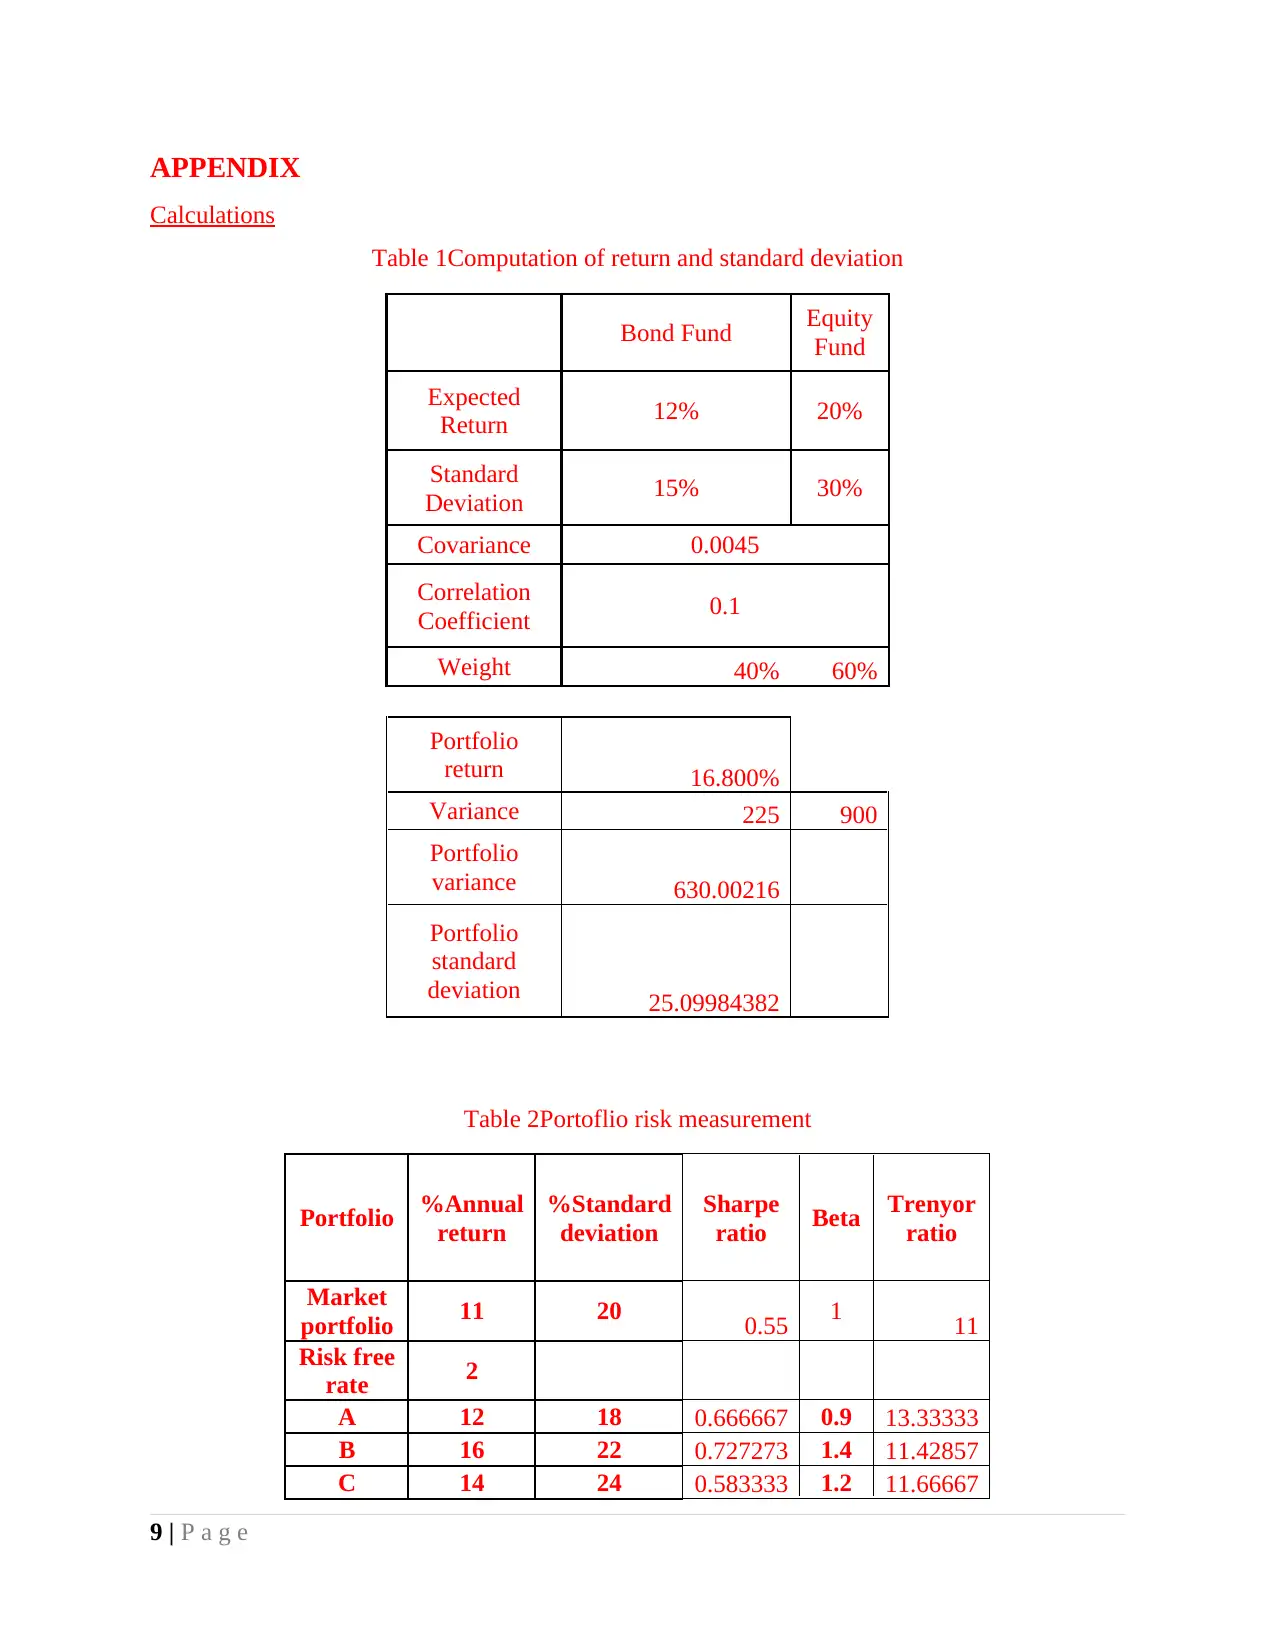
Table 1Computation of return and standard deviation
Bond Fund Equity
Fund
Expected
Return 12% 20%
Standard
Deviation 15% 30%
Covariance 0.0045
Correlation
Coefficient 0.1
Weight 40% 60%
Portfolio
return 16.800%
Variance 225 900
Portfolio
variance 630.00216
Portfolio
standard
deviation 25.09984382
Table 2Portoflio risk measurement
Portfolio %Annual
return
%Standard
deviation
Sharpe
ratio Beta Trenyor
ratio
Market
portfolio 11 20 0.55 1 11
Risk free
rate 2
A 12 18 0.666667 0.9 13.33333
B 16 22 0.727273 1.4 11.42857
C 14 24 0.583333 1.2 11.66667
9 | P a g e
Calculations
Table 1Computation of return and standard deviation
Bond Fund Equity
Fund
Expected
Return 12% 20%
Standard
Deviation 15% 30%
Covariance 0.0045
Correlation
Coefficient 0.1
Weight 40% 60%
Portfolio
return 16.800%
Variance 225 900
Portfolio
variance 630.00216
Portfolio
standard
deviation 25.09984382
Table 2Portoflio risk measurement
Portfolio %Annual
return
%Standard
deviation
Sharpe
ratio Beta Trenyor
ratio
Market
portfolio 11 20 0.55 1 11
Risk free
rate 2
A 12 18 0.666667 0.9 13.33333
B 16 22 0.727273 1.4 11.42857
C 14 24 0.583333 1.2 11.66667
9 | P a g e

10 | P a g e
⊘ This is a preview!⊘
Do you want full access?
Subscribe today to unlock all pages.
Trusted by 1+ million students worldwide
1 out of 12
Related Documents


Your All-in-One AI-Powered Toolkit for Academic Success.
+13062052269
info@desklib.com
Available 24*7 on WhatsApp / Email
![[object Object]](/_next/static/media/star-bottom.7253800d.svg)
Unlock your academic potential
Copyright © 2020–2026 A2Z Services. All Rights Reserved. Developed and managed by ZUCOL.