Report on Data Visualization and Interpretation of Email Usage Survey
VerifiedAdded on 2023/01/13
|17
|4508
|73
Report
AI Summary
This report focuses on the data visualization and interpretation of an email usage survey conducted with a sample size of 1010 participants, exploring various aspects of email usage. The research utilizes 75 questions, encompassing both descriptive and multiple-choice formats, to gather comprehensive data. The analysis employs statistical techniques such as descriptive analysis, correlation, and regression to identify key trends and relationships within the data. The report includes the presentation and interpretation of different types of graphs, including pie charts, histograms, and bar charts, generated from SPSS tests. The research questions address the benefits and drawbacks of email usage, the volume of emails sent and received, and the perceived time-wasting aspects of email. The findings are presented to effectively communicate information and identify key insights related to the email usage survey.
DATA VISUALISATION
AND
INTERPRETATION
AND
INTERPRETATION
Paraphrase This Document
Need a fresh take? Get an instant paraphrase of this document with our AI Paraphraser
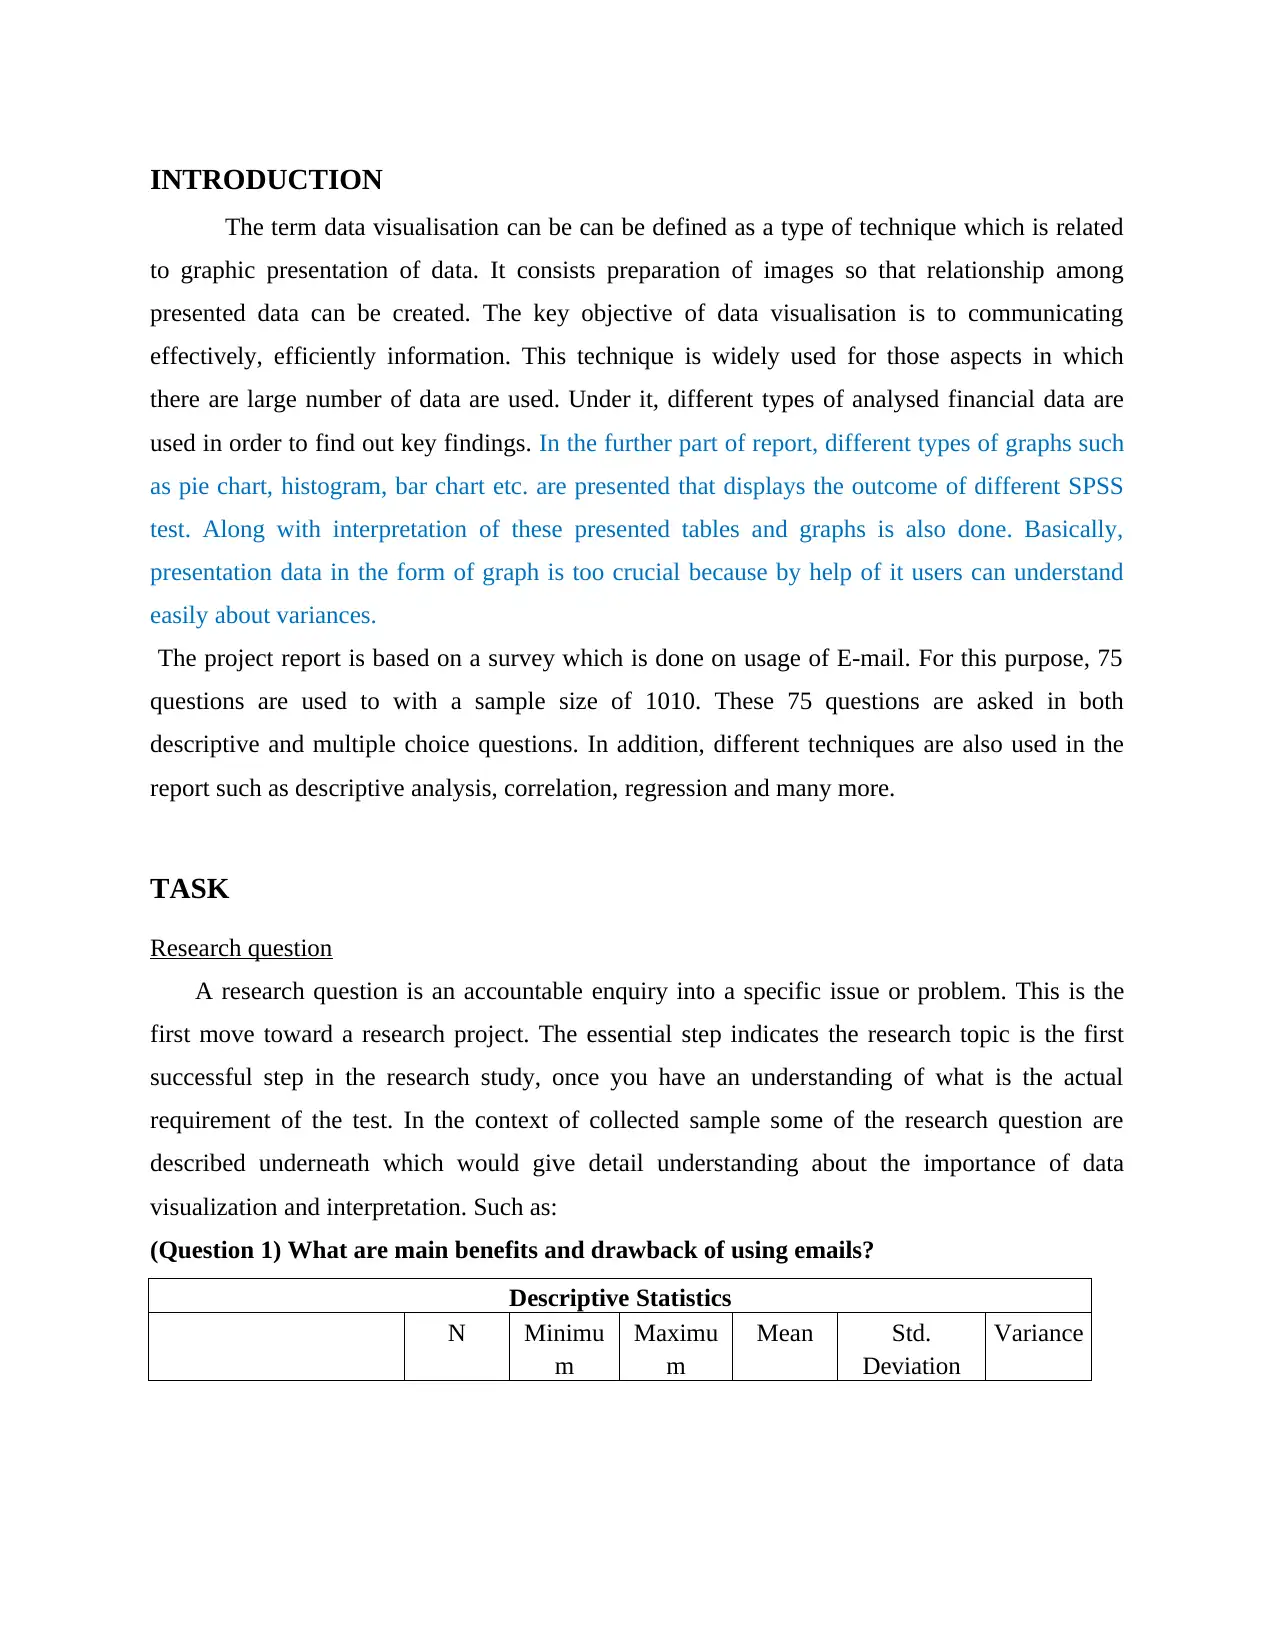
INTRODUCTION
The term data visualisation can be can be defined as a type of technique which is related
to graphic presentation of data. It consists preparation of images so that relationship among
presented data can be created. The key objective of data visualisation is to communicating
effectively, efficiently information. This technique is widely used for those aspects in which
there are large number of data are used. Under it, different types of analysed financial data are
used in order to find out key findings. In the further part of report, different types of graphs such
as pie chart, histogram, bar chart etc. are presented that displays the outcome of different SPSS
test. Along with interpretation of these presented tables and graphs is also done. Basically,
presentation data in the form of graph is too crucial because by help of it users can understand
easily about variances.
The project report is based on a survey which is done on usage of E-mail. For this purpose, 75
questions are used to with a sample size of 1010. These 75 questions are asked in both
descriptive and multiple choice questions. In addition, different techniques are also used in the
report such as descriptive analysis, correlation, regression and many more.
TASK
Research question
A research question is an accountable enquiry into a specific issue or problem. This is the
first move toward a research project. The essential step indicates the research topic is the first
successful step in the research study, once you have an understanding of what is the actual
requirement of the test. In the context of collected sample some of the research question are
described underneath which would give detail understanding about the importance of data
visualization and interpretation. Such as:
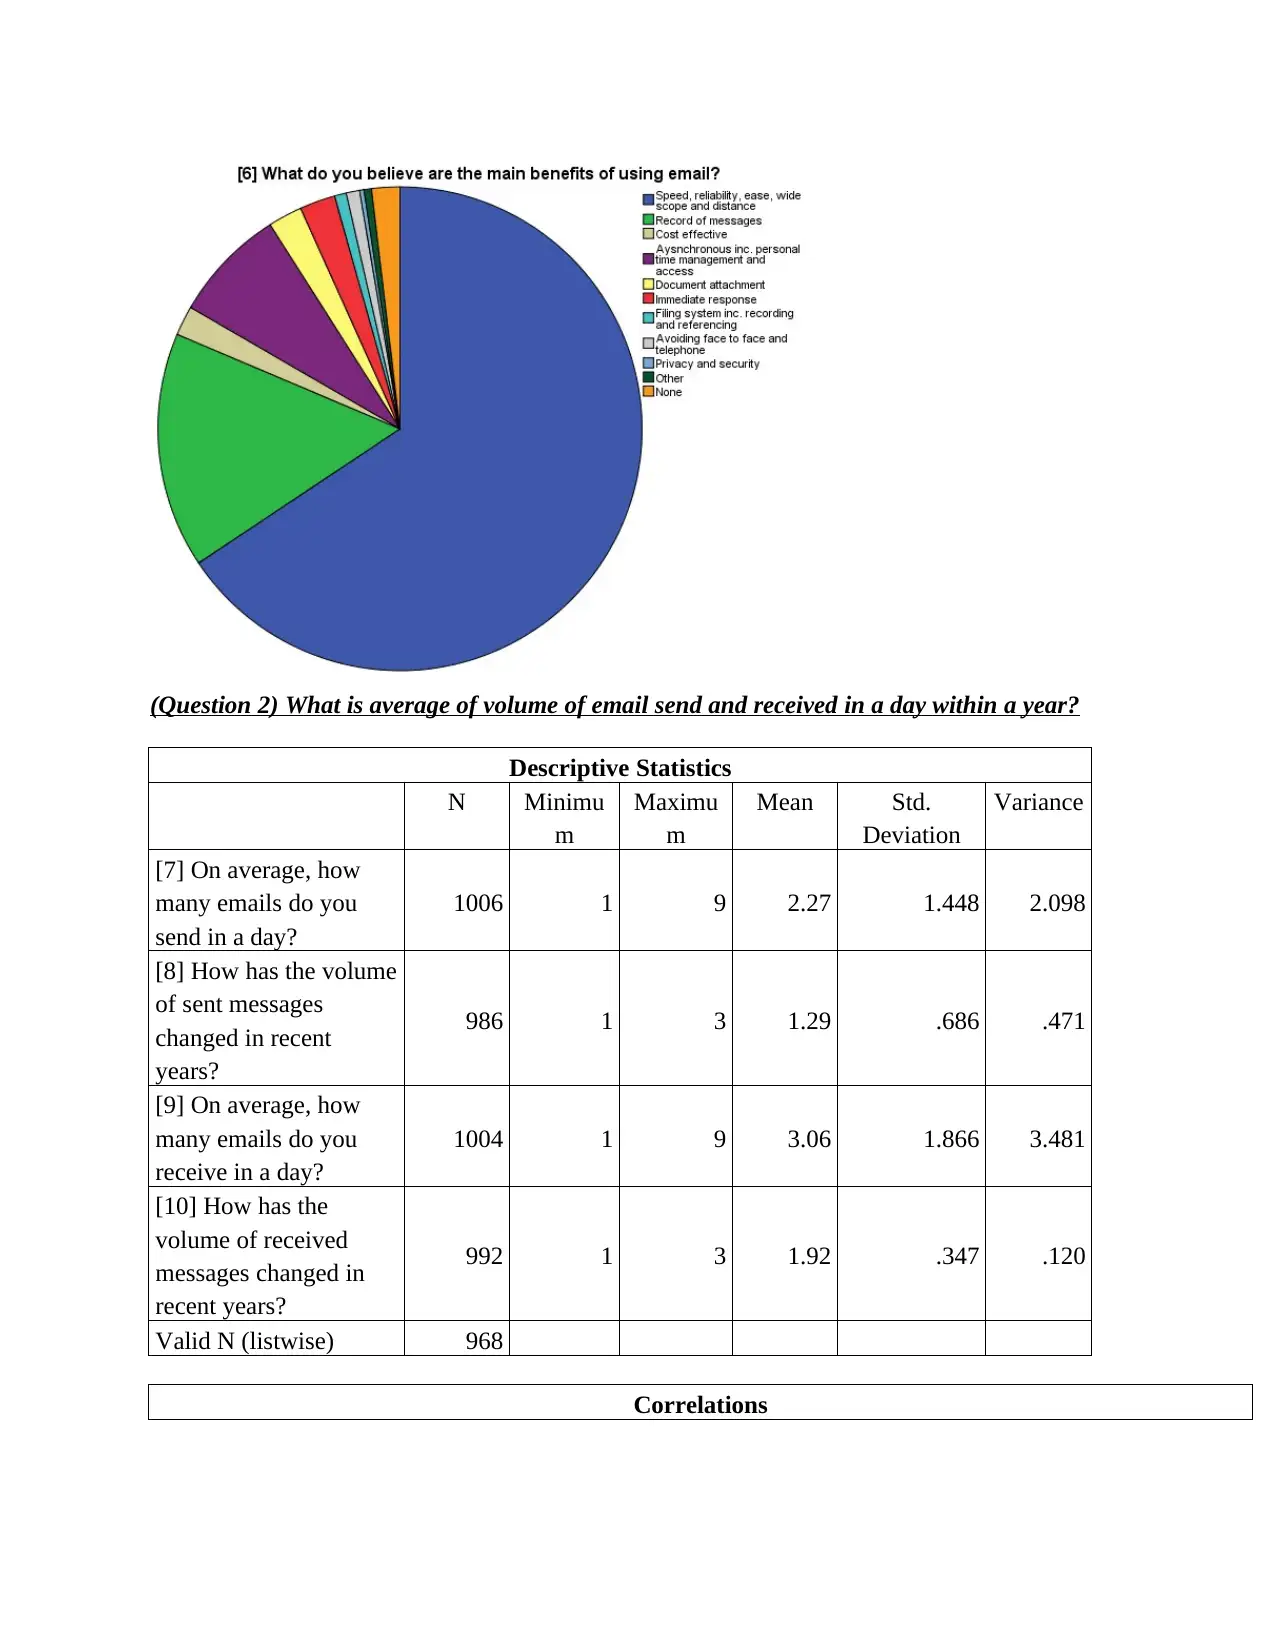
(Question 1) What are main benefits and drawback of using emails?
Descriptive Statistics
N Minimu
m
Maximu
m
Mean Std.
Deviation
Variance
The term data visualisation can be can be defined as a type of technique which is related
to graphic presentation of data. It consists preparation of images so that relationship among
presented data can be created. The key objective of data visualisation is to communicating
effectively, efficiently information. This technique is widely used for those aspects in which
there are large number of data are used. Under it, different types of analysed financial data are
used in order to find out key findings. In the further part of report, different types of graphs such
as pie chart, histogram, bar chart etc. are presented that displays the outcome of different SPSS
test. Along with interpretation of these presented tables and graphs is also done. Basically,
presentation data in the form of graph is too crucial because by help of it users can understand
easily about variances.
The project report is based on a survey which is done on usage of E-mail. For this purpose, 75
questions are used to with a sample size of 1010. These 75 questions are asked in both
descriptive and multiple choice questions. In addition, different techniques are also used in the
report such as descriptive analysis, correlation, regression and many more.
TASK
Research question
A research question is an accountable enquiry into a specific issue or problem. This is the
first move toward a research project. The essential step indicates the research topic is the first
successful step in the research study, once you have an understanding of what is the actual
requirement of the test. In the context of collected sample some of the research question are
described underneath which would give detail understanding about the importance of data
visualization and interpretation. Such as:
(Question 1) What are main benefits and drawback of using emails?
Descriptive Statistics
N Minimu
m
Maximu
m
Mean Std.
Deviation
Variance
[5] What do you
believe are the main
drawbacks to using
email?
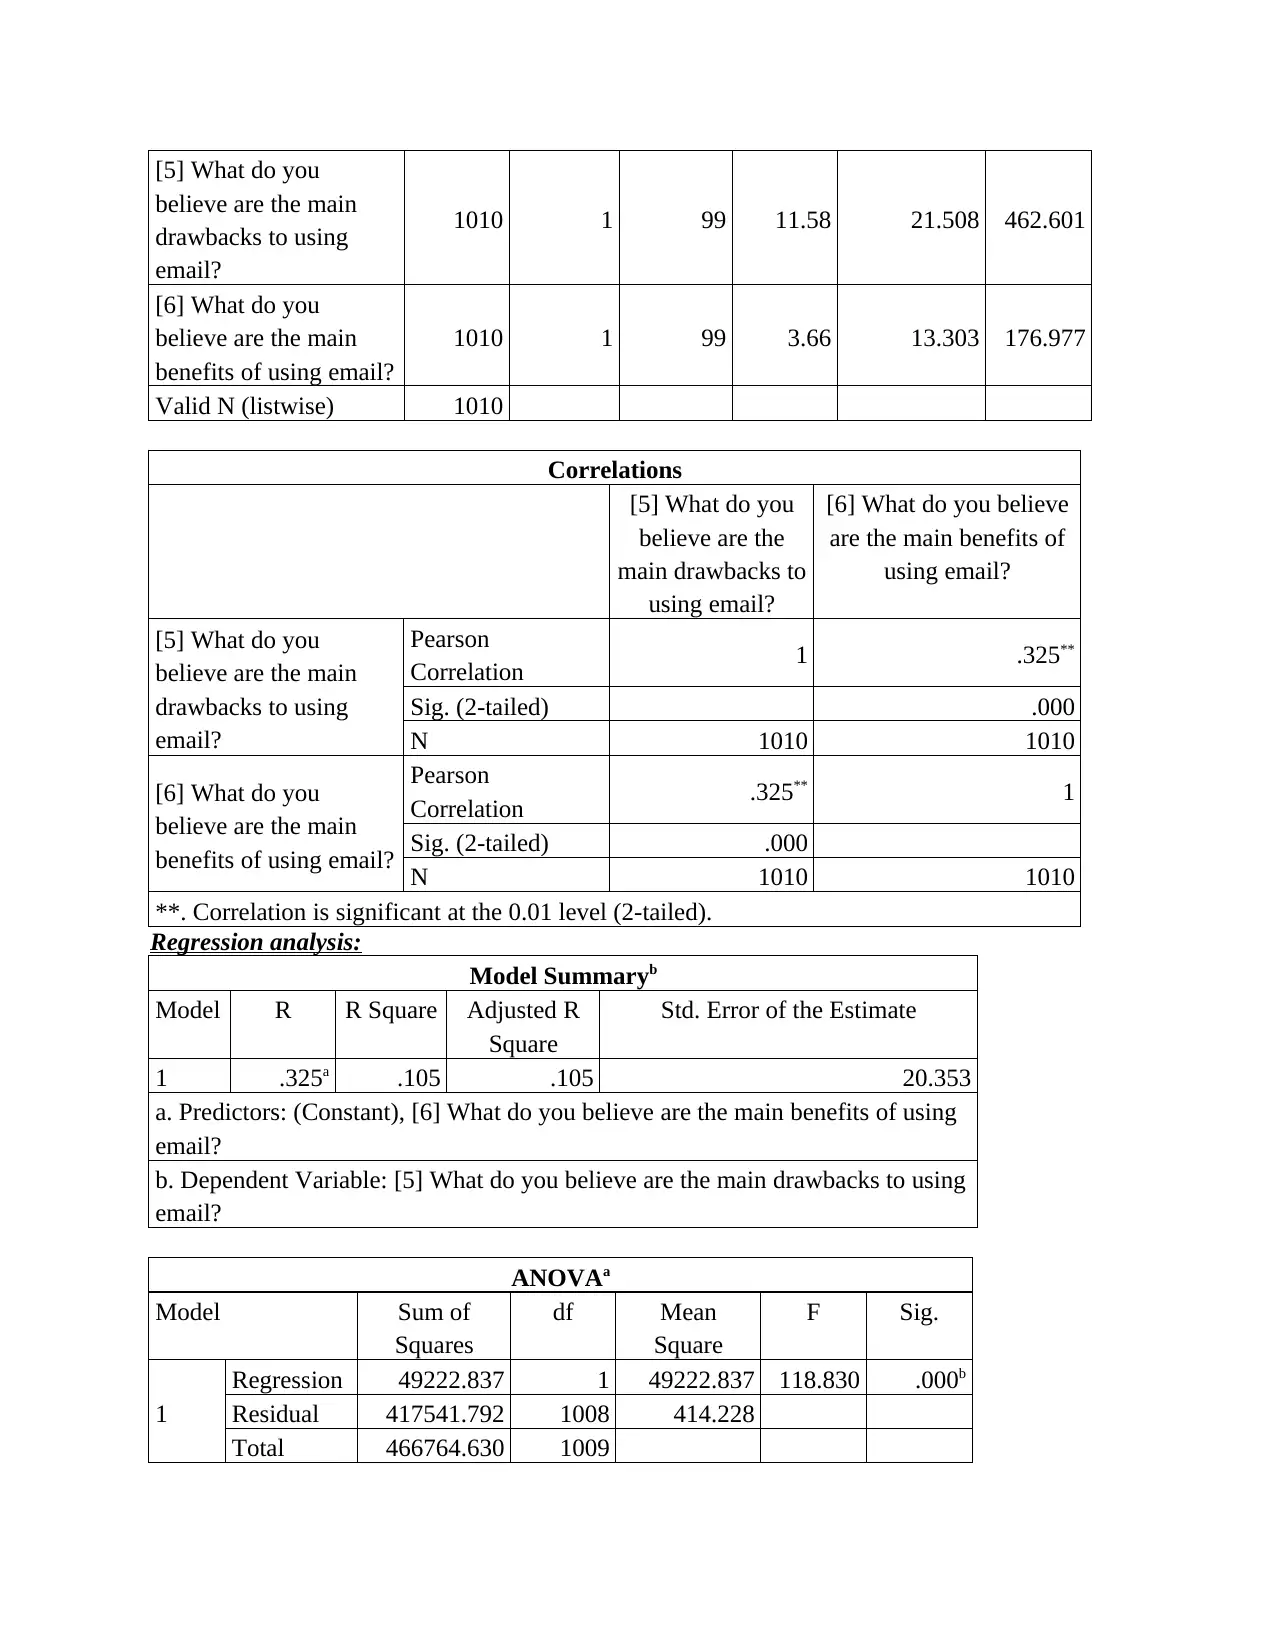
1010 1 99 11.58 21.508 462.601
[6] What do you
believe are the main
benefits of using email?
1010 1 99 3.66 13.303 176.977
Valid N (listwise) 1010
Correlations
[5] What do you
believe are the
main drawbacks to
using email?
[6] What do you believe
are the main benefits of
using email?
[5] What do you
believe are the main
drawbacks to using
email?
Pearson
Correlation 1 .325**
Sig. (2-tailed) .000
N 1010 1010
[6] What do you
believe are the main
benefits of using email?
Pearson
Correlation .325** 1
Sig. (2-tailed) .000
N 1010 1010
**. Correlation is significant at the 0.01 level (2-tailed).
Regression analysis:
Model Summaryb
Model R R Square Adjusted R
Square
Std. Error of the Estimate
1 .325a .105 .105 20.353
a. Predictors: (Constant), [6] What do you believe are the main benefits of using
email?
b. Dependent Variable: [5] What do you believe are the main drawbacks to using
email?
ANOVAa
Model Sum of
Squares
df Mean
Square
F Sig.
1
Regression 49222.837 1 49222.837 118.830 .000b
Residual 417541.792 1008 414.228
Total 466764.630 1009
believe are the main
drawbacks to using
email?
1010 1 99 11.58 21.508 462.601
[6] What do you
believe are the main
benefits of using email?
1010 1 99 3.66 13.303 176.977
Valid N (listwise) 1010
Correlations
[5] What do you
believe are the
main drawbacks to
using email?
[6] What do you believe
are the main benefits of
using email?
[5] What do you
believe are the main
drawbacks to using
email?
Pearson
Correlation 1 .325**
Sig. (2-tailed) .000
N 1010 1010
[6] What do you
believe are the main
benefits of using email?
Pearson
Correlation .325** 1
Sig. (2-tailed) .000
N 1010 1010
**. Correlation is significant at the 0.01 level (2-tailed).
Regression analysis:
Model Summaryb
Model R R Square Adjusted R
Square
Std. Error of the Estimate
1 .325a .105 .105 20.353
a. Predictors: (Constant), [6] What do you believe are the main benefits of using
email?
b. Dependent Variable: [5] What do you believe are the main drawbacks to using
email?
ANOVAa
Model Sum of
Squares
df Mean
Square
F Sig.
1
Regression 49222.837 1 49222.837 118.830 .000b
Residual 417541.792 1008 414.228
Total 466764.630 1009
⊘ This is a preview!⊘
Do you want full access?
Subscribe today to unlock all pages.
Trusted by 1+ million students worldwide
a. Dependent Variable: [5] What do you believe are the main drawbacks to using
email?
b. Predictors: (Constant), [6] What do you believe are the main benefits of using
email?
Coefficientsa
Model Unstandardized
Coefficients
Standardized
Coefficients
t Sig.
B Std. Error Beta
1
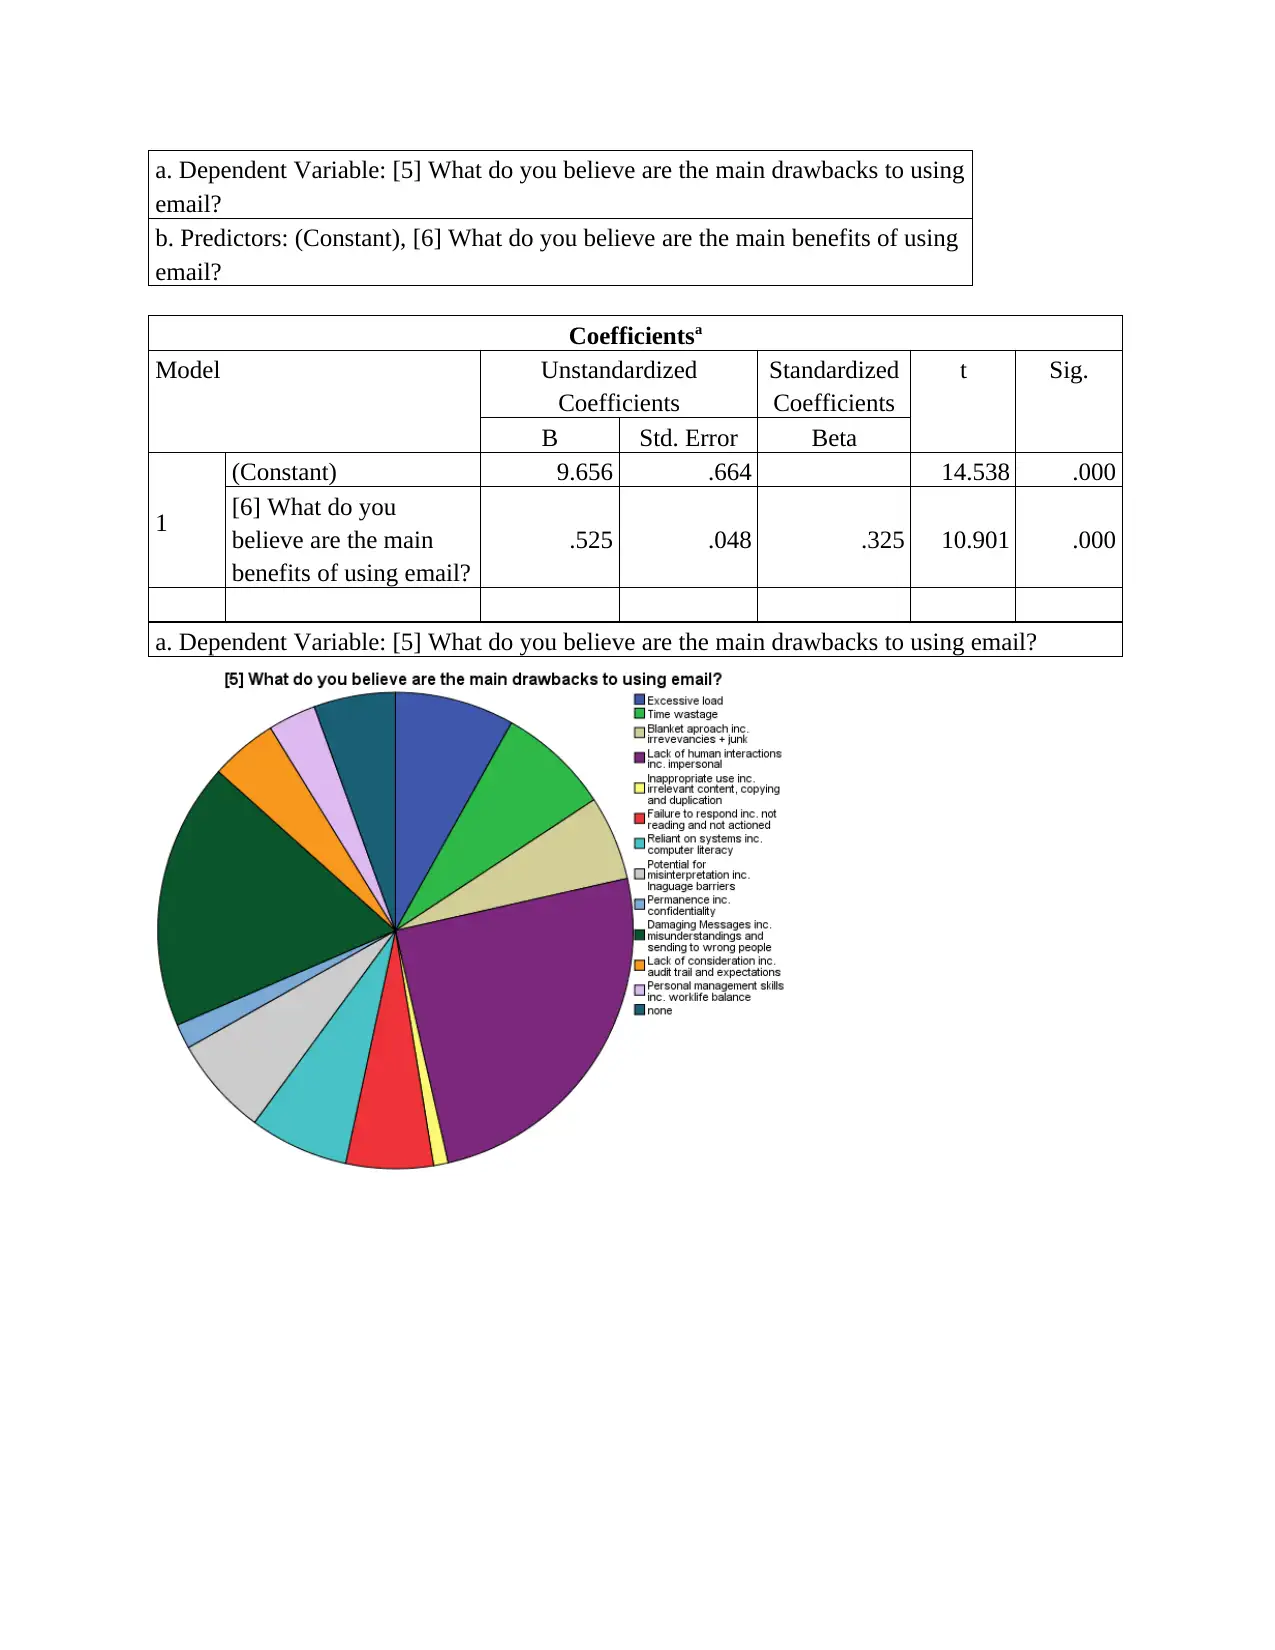
(Constant) 9.656 .664 14.538 .000
[6] What do you
believe are the main
benefits of using email?
.525 .048 .325 10.901 .000
a. Dependent Variable: [5] What do you believe are the main drawbacks to using email?
email?
b. Predictors: (Constant), [6] What do you believe are the main benefits of using
email?
Coefficientsa
Model Unstandardized
Coefficients
Standardized
Coefficients
t Sig.
B Std. Error Beta
1
(Constant) 9.656 .664 14.538 .000
[6] What do you
believe are the main
benefits of using email?
.525 .048 .325 10.901 .000
a. Dependent Variable: [5] What do you believe are the main drawbacks to using email?
Paraphrase This Document
Need a fresh take? Get an instant paraphrase of this document with our AI Paraphraser
(Question 2) What is average of volume of email send and received in a day within a year?
Descriptive Statistics
N Minimu
m
Maximu
m
Mean Std.
Deviation
Variance
[7] On average, how
many emails do you
send in a day?
1006 1 9 2.27 1.448 2.098
[8] How has the volume
of sent messages
changed in recent
years?
986 1 3 1.29 .686 .471
[9] On average, how
many emails do you
receive in a day?
1004 1 9 3.06 1.866 3.481
[10] How has the
volume of received
messages changed in
recent years?
992 1 3 1.92 .347 .120
Valid N (listwise) 968
Correlations
[7] On
average, how
many emails
do you send
in a day?
[8] How has
the volume of
sent messages
changed in
recent years?
[9] On
average, how
many emails
do you
receive in a
day?
[10] How has
the volume of
received
messages
changed in
recent years?
[7] On average, how
many emails do you
send in a day?
Pearson
Correlation 1 -.149** .735** .042
Sig. (2-tailed) .000 .000 .192
N 1006 986 1001 989
[8] How has the volume
of sent messages
changed in recent years?
Pearson
Correlation -.149** 1 -.126** -.429**
Sig. (2-tailed) .000 .000 .000
N 986 986 982 972
[9] On average, how
many emails do you
receive in a day?
Pearson
Correlation .735** -.126** 1 .089**
Sig. (2-tailed) .000 .000 .005
N 1001 982 1004 987
[10] How has the
volume of received
messages changed in
recent years?
Pearson
Correlation .042 -.429** .089** 1
Sig. (2-tailed) .192 .000 .005
N 989 972 987 992
**. Correlation is significant at the 0.01 level (2-tailed).
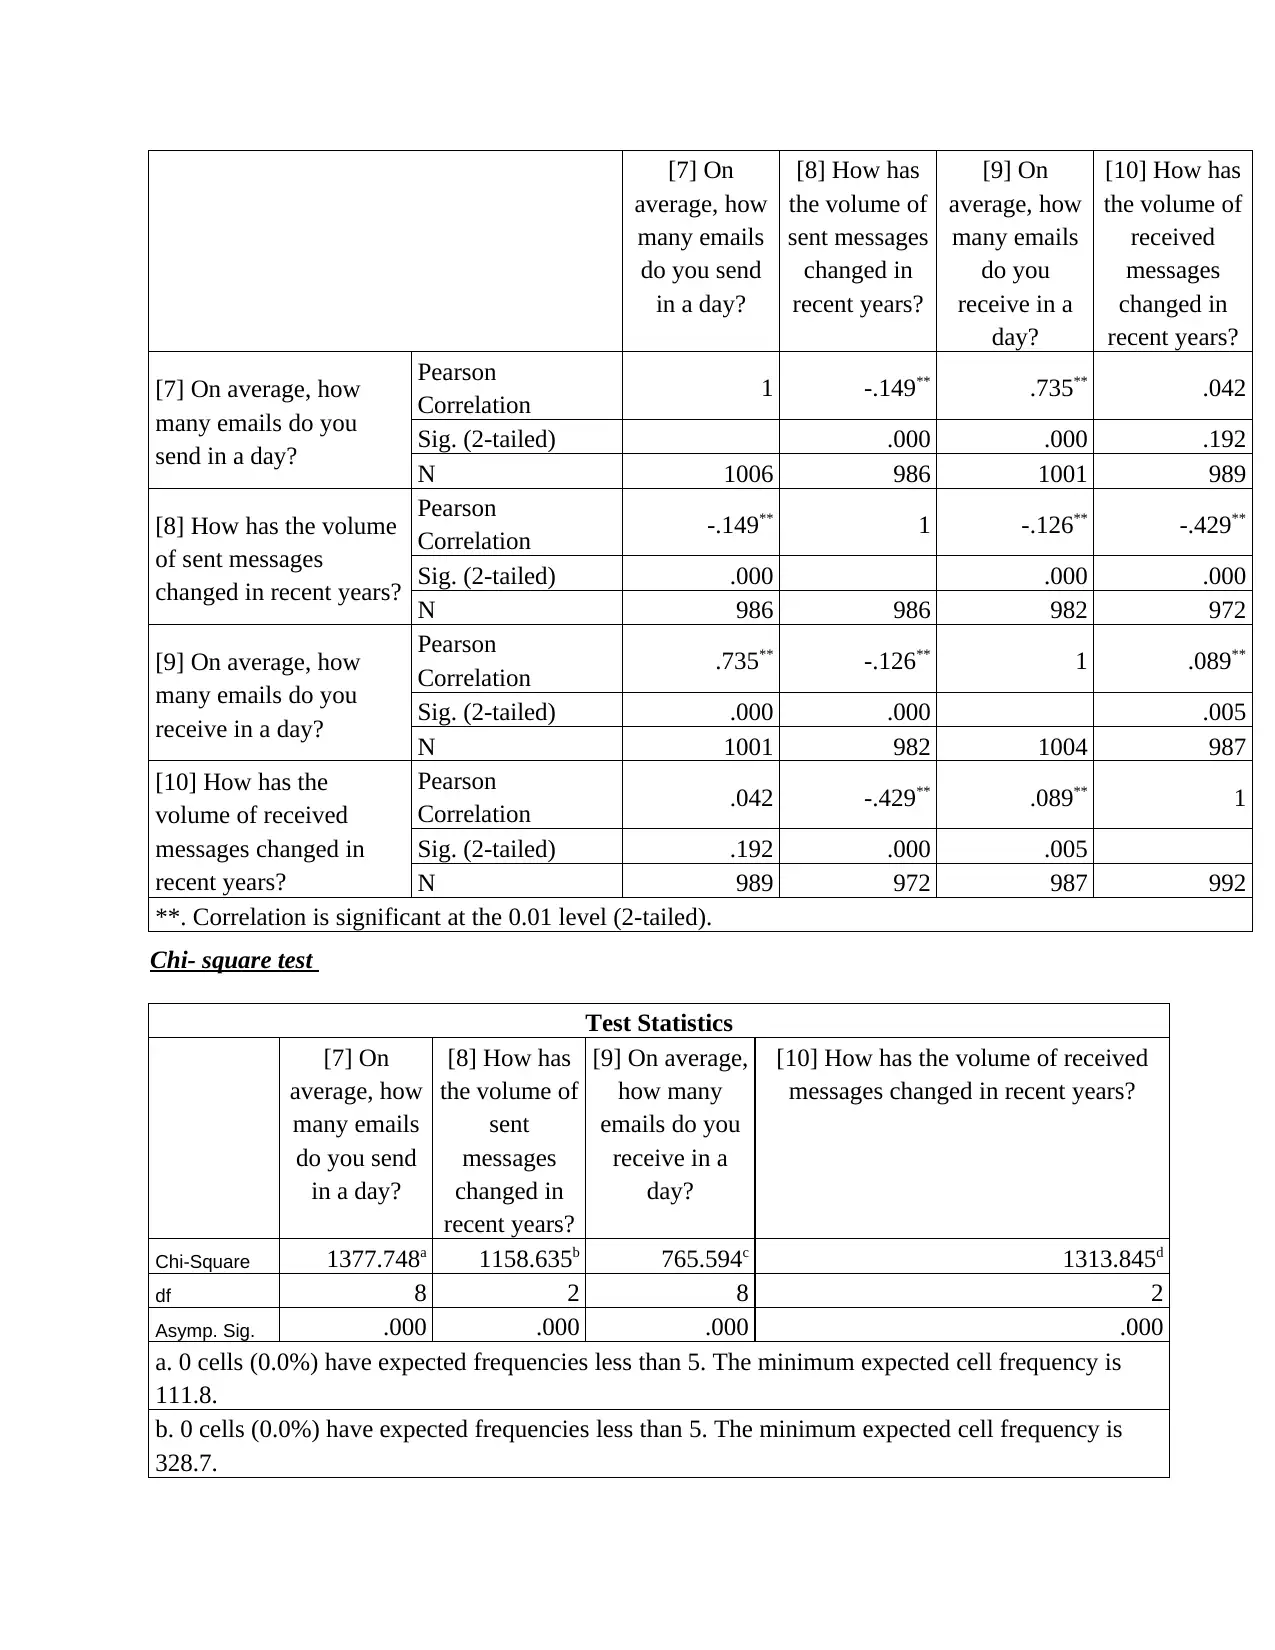
Chi- square test
Test Statistics
[7] On
average, how
many emails
do you send
in a day?
[8] How has
the volume of
sent
messages
changed in
recent years?
[9] On average,
how many
emails do you
receive in a
day?
[10] How has the volume of received
messages changed in recent years?
Chi-Square 1377.748a 1158.635b 765.594c 1313.845d
df 8 2 8 2
Asymp. Sig. .000 .000 .000 .000
a. 0 cells (0.0%) have expected frequencies less than 5. The minimum expected cell frequency is
111.8.
b. 0 cells (0.0%) have expected frequencies less than 5. The minimum expected cell frequency is
328.7.
average, how
many emails
do you send
in a day?
[8] How has
the volume of
sent messages
changed in
recent years?
[9] On
average, how
many emails
do you
receive in a
day?
[10] How has
the volume of
received
messages
changed in
recent years?
[7] On average, how
many emails do you
send in a day?
Pearson
Correlation 1 -.149** .735** .042
Sig. (2-tailed) .000 .000 .192
N 1006 986 1001 989
[8] How has the volume
of sent messages
changed in recent years?
Pearson
Correlation -.149** 1 -.126** -.429**
Sig. (2-tailed) .000 .000 .000
N 986 986 982 972
[9] On average, how
many emails do you
receive in a day?
Pearson
Correlation .735** -.126** 1 .089**
Sig. (2-tailed) .000 .000 .005
N 1001 982 1004 987
[10] How has the
volume of received
messages changed in
recent years?
Pearson
Correlation .042 -.429** .089** 1
Sig. (2-tailed) .192 .000 .005
N 989 972 987 992
**. Correlation is significant at the 0.01 level (2-tailed).
Chi- square test
Test Statistics
[7] On
average, how
many emails
do you send
in a day?
[8] How has
the volume of
sent
messages
changed in
recent years?
[9] On average,
how many
emails do you
receive in a
day?
[10] How has the volume of received
messages changed in recent years?
Chi-Square 1377.748a 1158.635b 765.594c 1313.845d
df 8 2 8 2
Asymp. Sig. .000 .000 .000 .000
a. 0 cells (0.0%) have expected frequencies less than 5. The minimum expected cell frequency is
111.8.
b. 0 cells (0.0%) have expected frequencies less than 5. The minimum expected cell frequency is
328.7.
⊘ This is a preview!⊘
Do you want full access?
Subscribe today to unlock all pages.
Trusted by 1+ million students worldwide
c. 0 cells (0.0%) have expected frequencies less than 5. The minimum expected cell frequency is
111.6.
d. 0 cells (0.0%) have expected frequencies less than 5. The minimum expected cell frequency is
330.7.
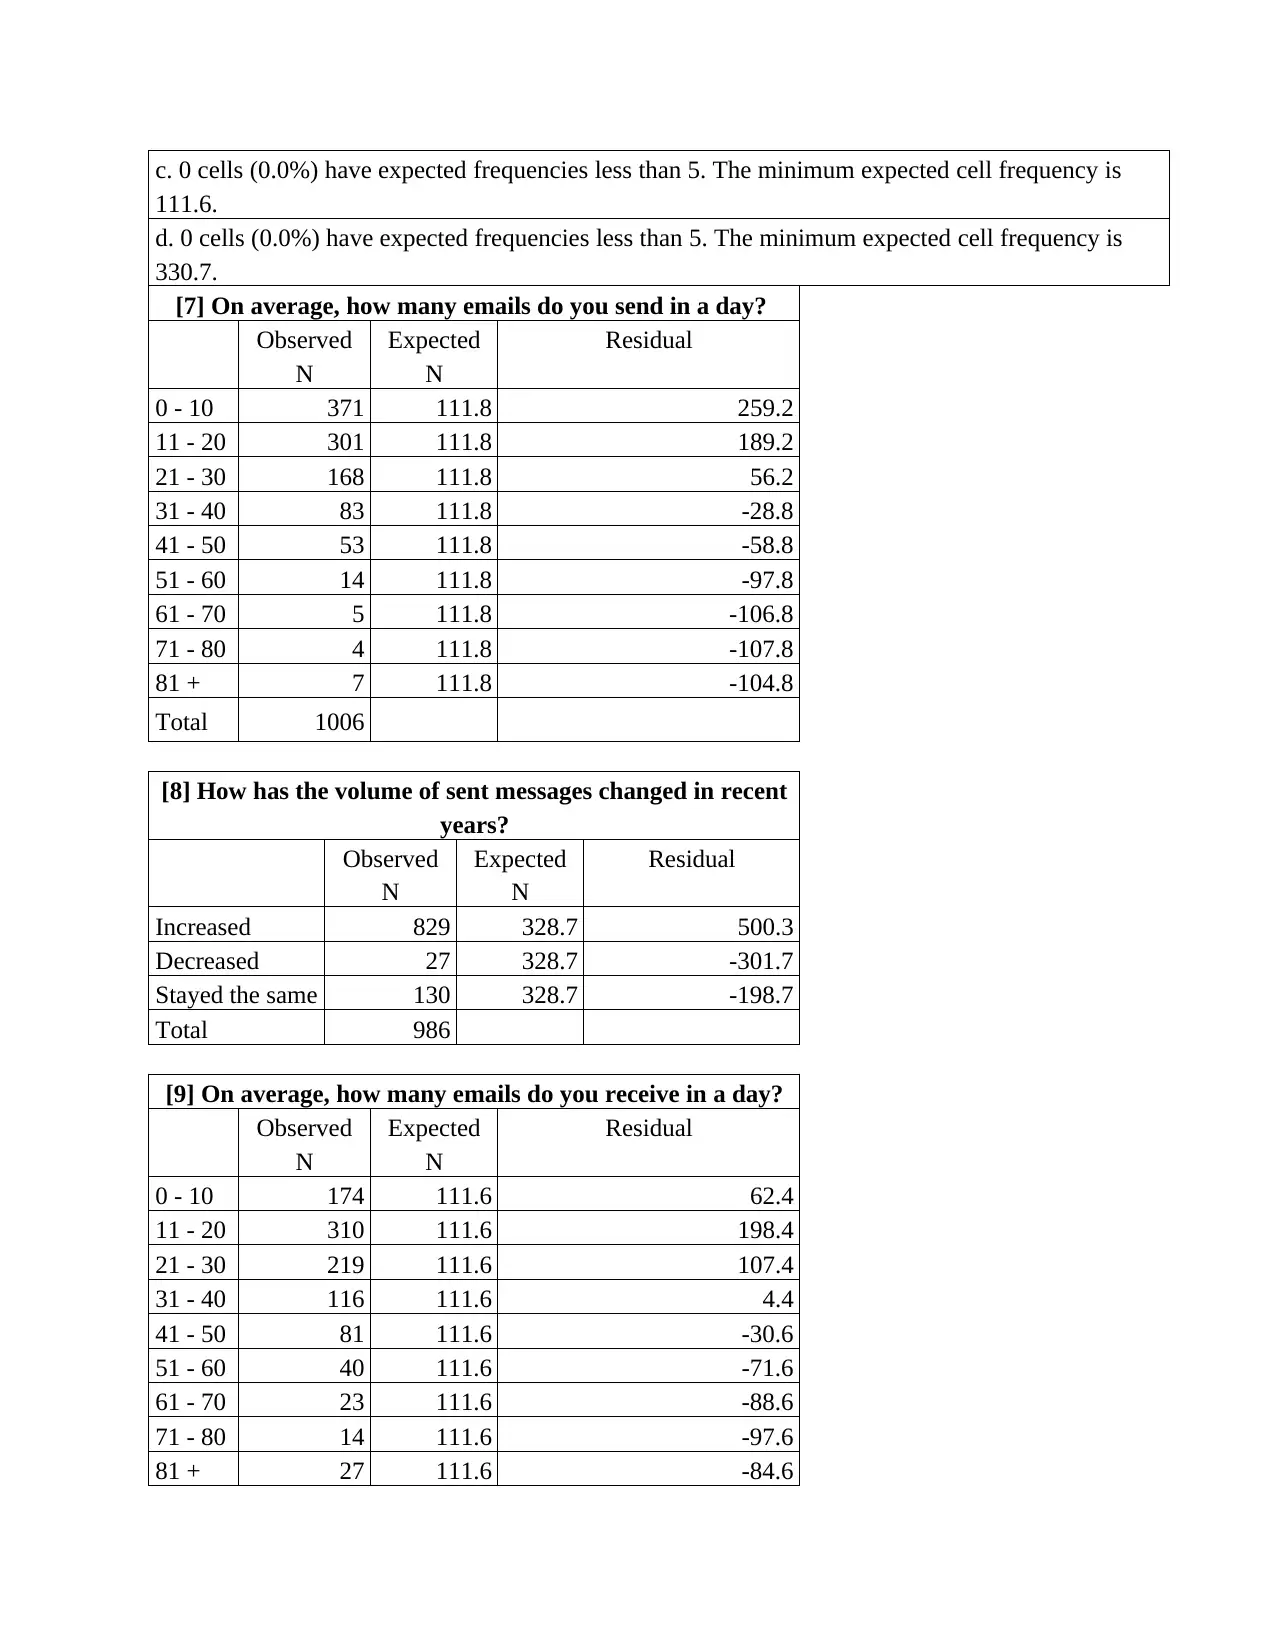
[7] On average, how many emails do you send in a day?
Observed
N
Expected
N
Residual
0 - 10 371 111.8 259.2
11 - 20 301 111.8 189.2
21 - 30 168 111.8 56.2
31 - 40 83 111.8 -28.8
41 - 50 53 111.8 -58.8
51 - 60 14 111.8 -97.8
61 - 70 5 111.8 -106.8
71 - 80 4 111.8 -107.8
81 + 7 111.8 -104.8
Total 1006
[8] How has the volume of sent messages changed in recent
years?
Observed
N
Expected
N
Residual
Increased 829 328.7 500.3
Decreased 27 328.7 -301.7
Stayed the same 130 328.7 -198.7
Total 986
[9] On average, how many emails do you receive in a day?
Observed
N
Expected
N
Residual
0 - 10 174 111.6 62.4
11 - 20 310 111.6 198.4
21 - 30 219 111.6 107.4
31 - 40 116 111.6 4.4
41 - 50 81 111.6 -30.6
51 - 60 40 111.6 -71.6
61 - 70 23 111.6 -88.6
71 - 80 14 111.6 -97.6
81 + 27 111.6 -84.6
111.6.
d. 0 cells (0.0%) have expected frequencies less than 5. The minimum expected cell frequency is
330.7.
[7] On average, how many emails do you send in a day?
Observed
N
Expected
N
Residual
0 - 10 371 111.8 259.2
11 - 20 301 111.8 189.2
21 - 30 168 111.8 56.2
31 - 40 83 111.8 -28.8
41 - 50 53 111.8 -58.8
51 - 60 14 111.8 -97.8
61 - 70 5 111.8 -106.8
71 - 80 4 111.8 -107.8
81 + 7 111.8 -104.8
Total 1006
[8] How has the volume of sent messages changed in recent
years?
Observed
N
Expected
N
Residual
Increased 829 328.7 500.3
Decreased 27 328.7 -301.7
Stayed the same 130 328.7 -198.7
Total 986
[9] On average, how many emails do you receive in a day?
Observed
N
Expected
N
Residual
0 - 10 174 111.6 62.4
11 - 20 310 111.6 198.4
21 - 30 219 111.6 107.4
31 - 40 116 111.6 4.4
41 - 50 81 111.6 -30.6
51 - 60 40 111.6 -71.6
61 - 70 23 111.6 -88.6
71 - 80 14 111.6 -97.6
81 + 27 111.6 -84.6
Paraphrase This Document
Need a fresh take? Get an instant paraphrase of this document with our AI Paraphraser
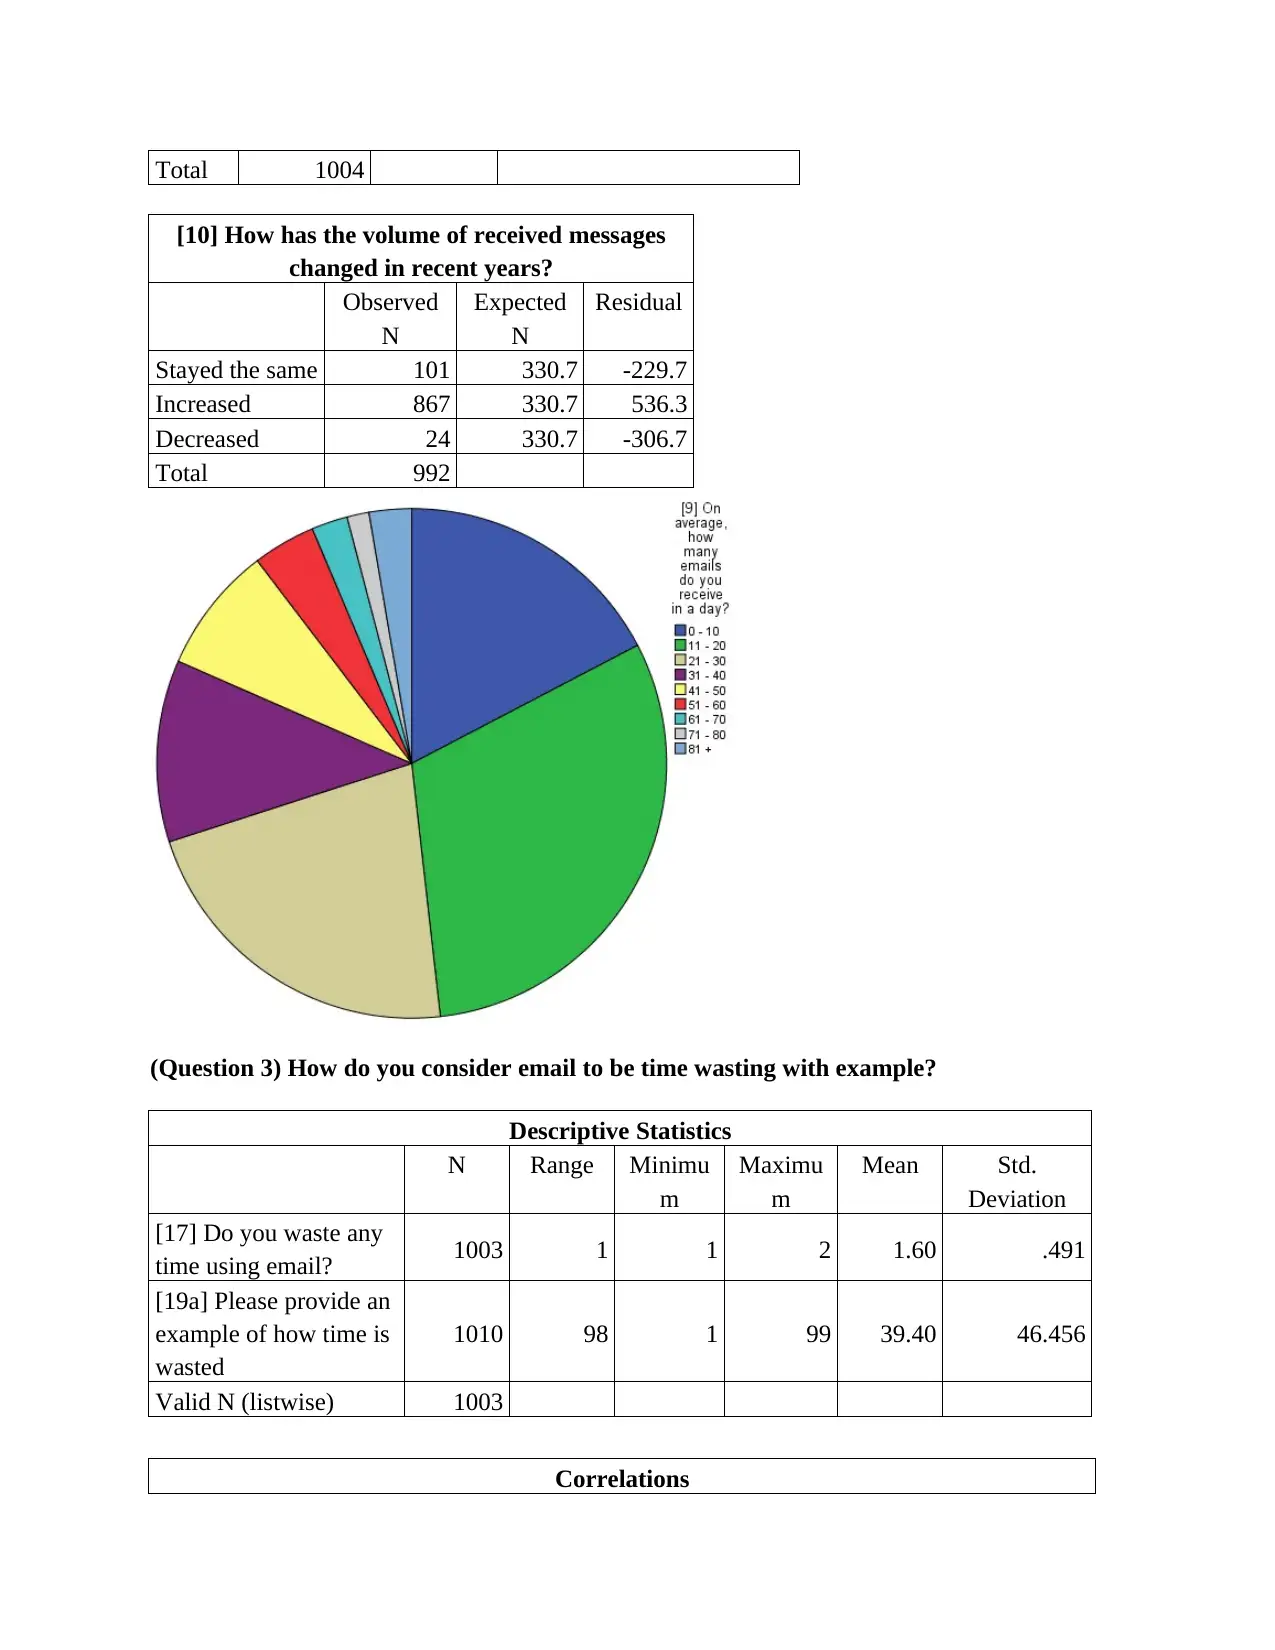
Total 1004
[10] How has the volume of received messages
changed in recent years?
Observed
N
Expected
N
Residual
Stayed the same 101 330.7 -229.7
Increased 867 330.7 536.3
Decreased 24 330.7 -306.7
Total 992
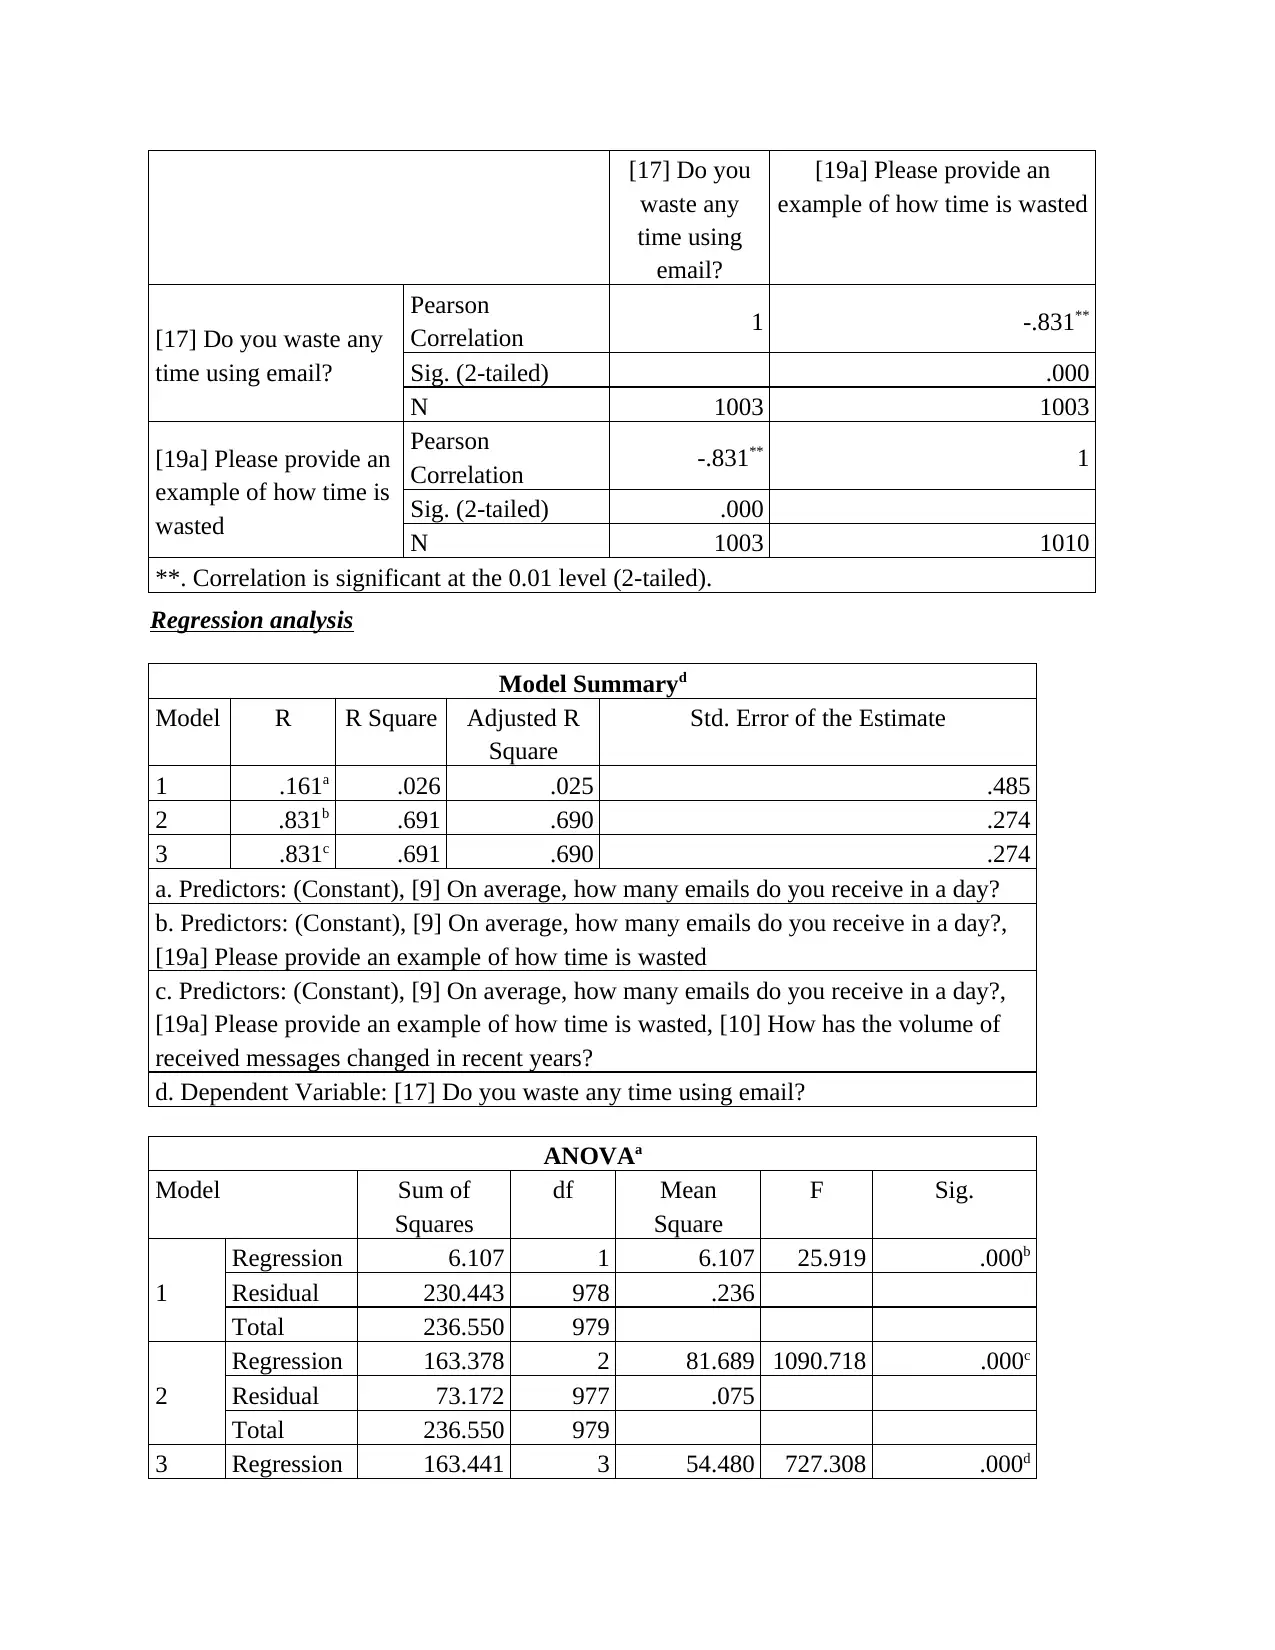
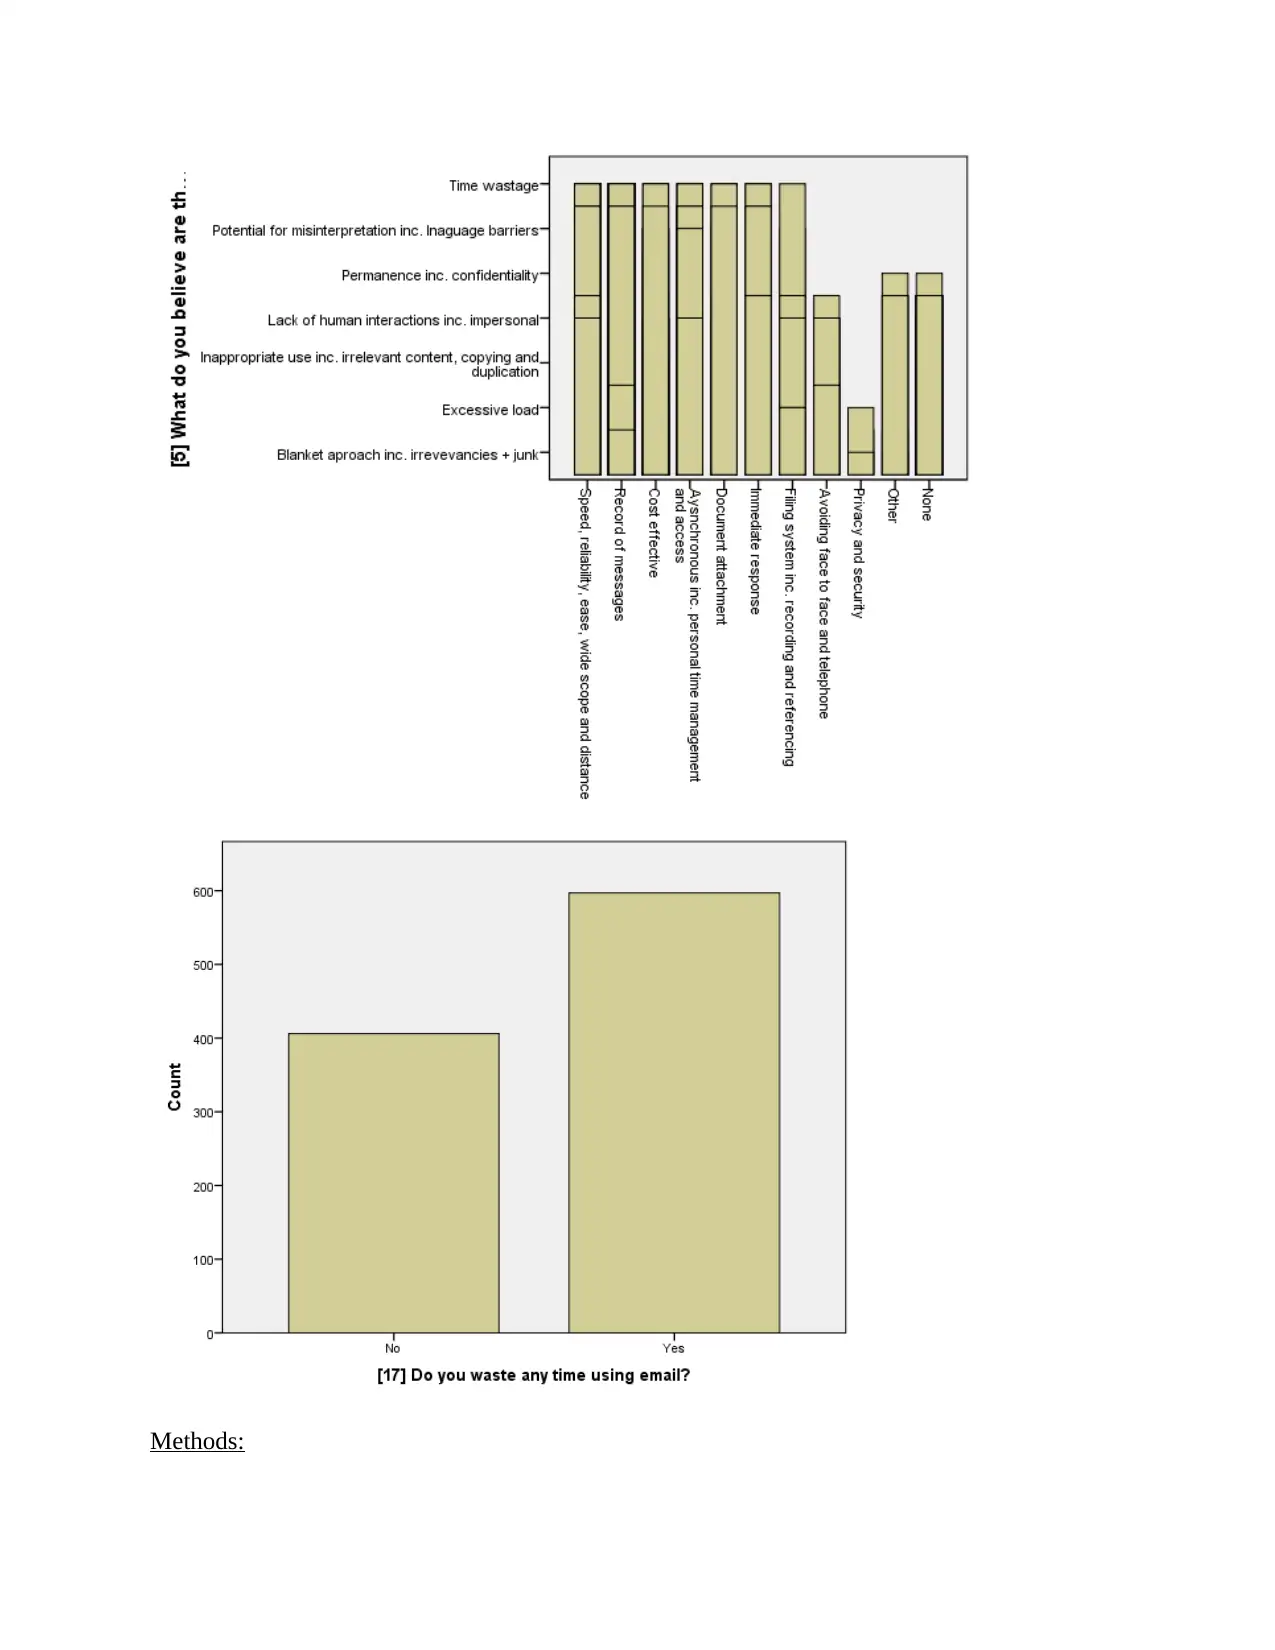
(Question 3) How do you consider email to be time wasting with example?
Descriptive Statistics
N Range Minimu
m
Maximu
m
Mean Std.
Deviation
[17] Do you waste any
time using email? 1003 1 1 2 1.60 .491
[19a] Please provide an
example of how time is
wasted
1010 98 1 99 39.40 46.456
Valid N (listwise) 1003
Correlations
[10] How has the volume of received messages
changed in recent years?
Observed
N
Expected
N
Residual
Stayed the same 101 330.7 -229.7
Increased 867 330.7 536.3
Decreased 24 330.7 -306.7
Total 992
(Question 3) How do you consider email to be time wasting with example?
Descriptive Statistics
N Range Minimu
m
Maximu
m
Mean Std.
Deviation
[17] Do you waste any
time using email? 1003 1 1 2 1.60 .491
[19a] Please provide an
example of how time is
wasted
1010 98 1 99 39.40 46.456
Valid N (listwise) 1003
Correlations
[17] Do you
waste any
time using
email?
[19a] Please provide an
example of how time is wasted
[17] Do you waste any
time using email?
Pearson
Correlation 1 -.831**
Sig. (2-tailed) .000
N 1003 1003
[19a] Please provide an
example of how time is
wasted
Pearson
Correlation -.831** 1
Sig. (2-tailed) .000
N 1003 1010
**. Correlation is significant at the 0.01 level (2-tailed).
Regression analysis
Model Summaryd
Model R R Square Adjusted R
Square
Std. Error of the Estimate
1 .161a .026 .025 .485
2 .831b .691 .690 .274
3 .831c .691 .690 .274
a. Predictors: (Constant), [9] On average, how many emails do you receive in a day?
b. Predictors: (Constant), [9] On average, how many emails do you receive in a day?,
[19a] Please provide an example of how time is wasted
c. Predictors: (Constant), [9] On average, how many emails do you receive in a day?,
[19a] Please provide an example of how time is wasted, [10] How has the volume of
received messages changed in recent years?
d. Dependent Variable: [17] Do you waste any time using email?
ANOVAa
Model Sum of
Squares
df Mean
Square
F Sig.
1
Regression 6.107 1 6.107 25.919 .000b
Residual 230.443 978 .236
Total 236.550 979
2
Regression 163.378 2 81.689 1090.718 .000c
Residual 73.172 977 .075
Total 236.550 979
3 Regression 163.441 3 54.480 727.308 .000d
⊘ This is a preview!⊘
Do you want full access?
Subscribe today to unlock all pages.
Trusted by 1+ million students worldwide
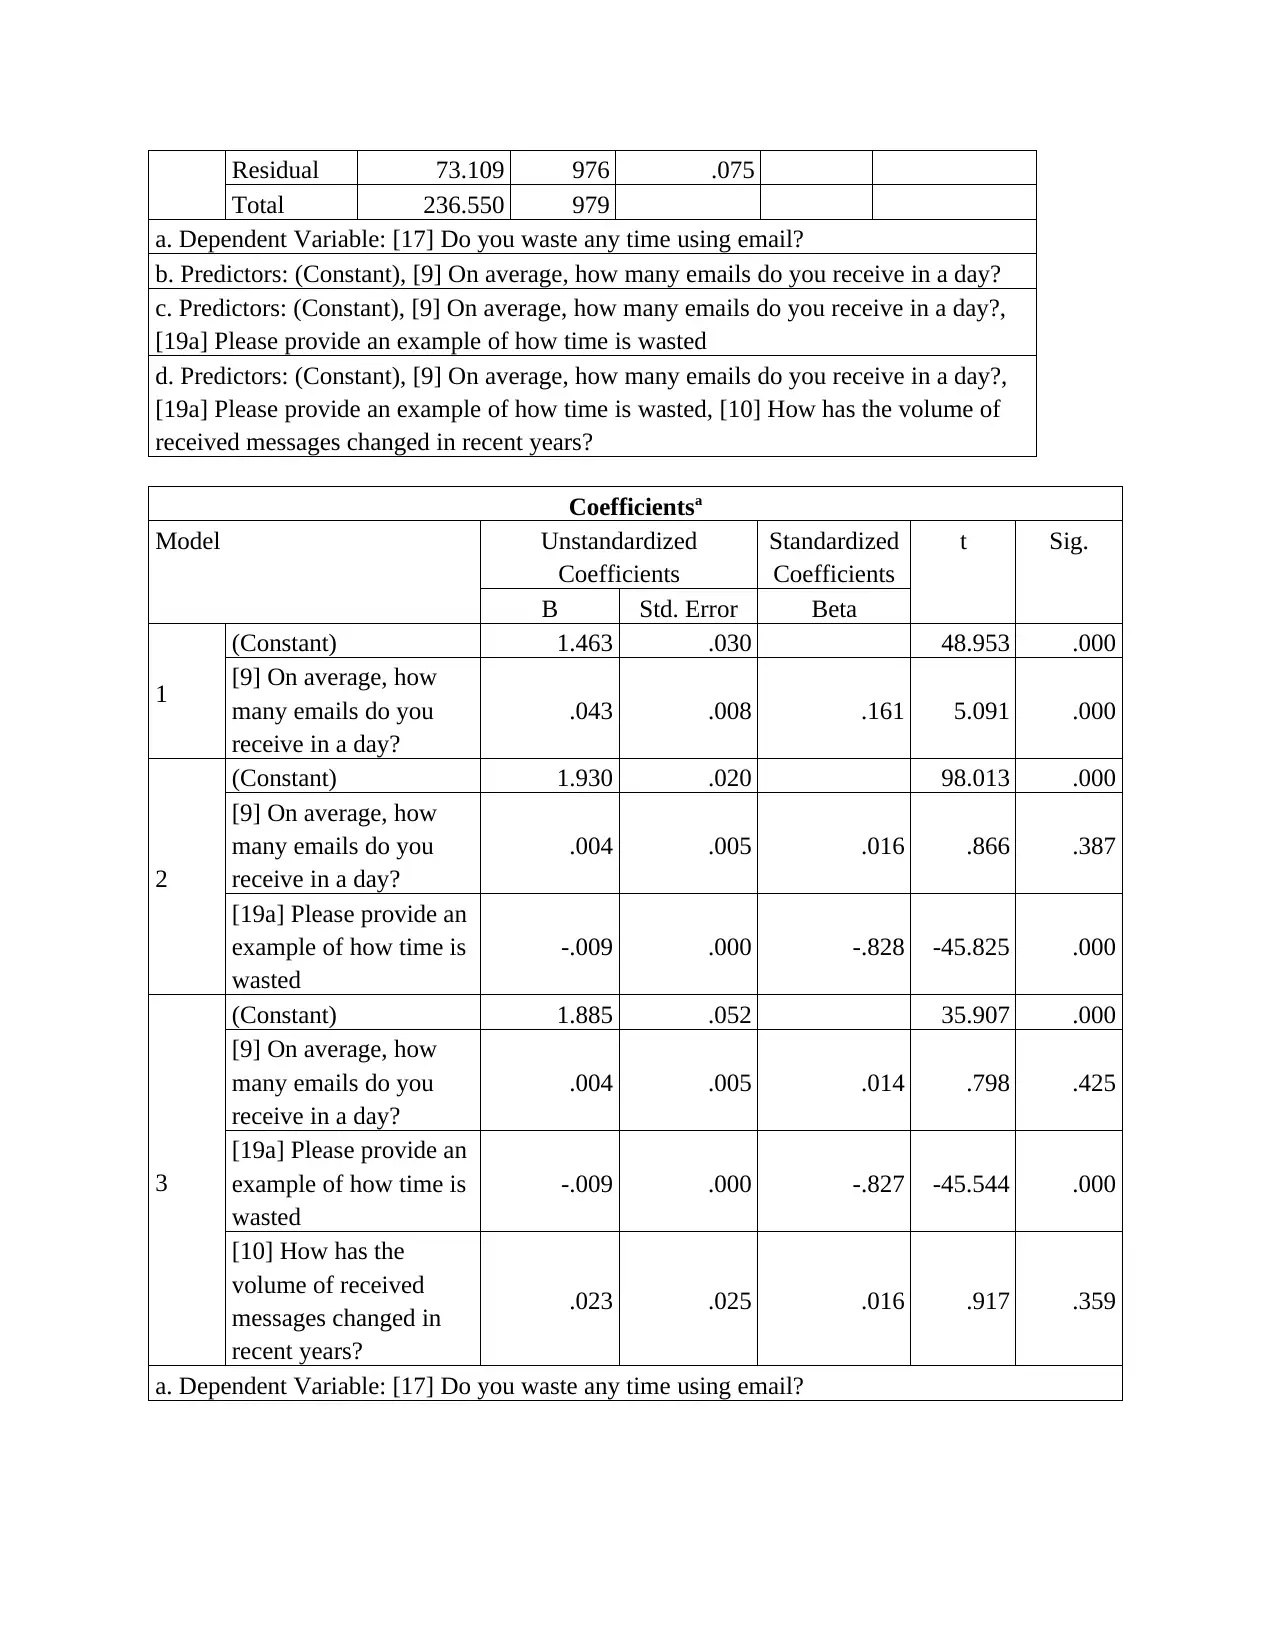
Residual 73.109 976 .075
Total 236.550 979
a. Dependent Variable: [17] Do you waste any time using email?
b. Predictors: (Constant), [9] On average, how many emails do you receive in a day?
c. Predictors: (Constant), [9] On average, how many emails do you receive in a day?,
[19a] Please provide an example of how time is wasted
d. Predictors: (Constant), [9] On average, how many emails do you receive in a day?,
[19a] Please provide an example of how time is wasted, [10] How has the volume of
received messages changed in recent years?
Coefficientsa
Model Unstandardized
Coefficients
Standardized
Coefficients
t Sig.
B Std. Error Beta
1
(Constant) 1.463 .030 48.953 .000
[9] On average, how
many emails do you
receive in a day?
.043 .008 .161 5.091 .000
2
(Constant) 1.930 .020 98.013 .000
[9] On average, how
many emails do you
receive in a day?
.004 .005 .016 .866 .387
[19a] Please provide an
example of how time is
wasted
-.009 .000 -.828 -45.825 .000
3
(Constant) 1.885 .052 35.907 .000
[9] On average, how
many emails do you
receive in a day?
.004 .005 .014 .798 .425
[19a] Please provide an
example of how time is
wasted
-.009 .000 -.827 -45.544 .000
[10] How has the
volume of received
messages changed in
recent years?
.023 .025 .016 .917 .359
a. Dependent Variable: [17] Do you waste any time using email?
Paraphrase This Document
Need a fresh take? Get an instant paraphrase of this document with our AI Paraphraser
Methods:
Data visualisation- As above stated that, this technique plays a key role in the context of
understanding data in most effective manner. It contributes effectively in order to making better
decisions. Herein, underneath key objectives of this method are mentioned in such manner:
Determination of frequency- This is one of the key benefit of data visualisation which is
related to determination of level of frequency so that complexity of data can be reduced.
As well as in the case when time factor is included in the data set then by help data
visualisation technique, measurement of frequency becomes easier.
Determination of relationships (Correlations) – In the context of huge number of data set
this becomes difficult to measure relationship between two variables. But by help of
above mentioned method, this becomes easier to find out relationship between two
different range of data set.
Examining of a network- In addition, data visualisation technique is helpful for
examining network. This is very useful for market research because marketing
professionals want to know about targeted audience so that they can analyse whole
market. It this aspect, the above mentioned technique is too useful because by help of it
marketing teams can do better analysis of their target market and customers.
Analysing value and risk- Another benefit of data visualisation technique is that it
contributes in assessing value and risk involved in a particular segment of data. For
example, determination of complex metrics need different types of variables and due to
which it becomes impossible to see accuracy with a plain spreadsheet.
In order to visualise given data of 1010 respondents, a computer software has been used in the
report that is Statistical Package for the Social Sciences. This is a type of software package
which is used effective and interactive statistical analysis. Under this application, relationship
between two variables is calculated. In the aspect of given data set, different types of tests are
performed under Statistical Package for the Social Sciences. These tests are done in order to find
out relation between two variables, to calculate mean, mode, median etc. Herein, underneath
name of these tests is mentioned in such manner:
Descriptive statistics- This can be defined as a type of technique which is related to
summarising a given data range that can be either a presentation of complete or sample of
population. This statistic can be break down into measures of central tendency and
⊘ This is a preview!⊘
Do you want full access?
Subscribe today to unlock all pages.
Trusted by 1+ million students worldwide
1 out of 17
Related Documents


Your All-in-One AI-Powered Toolkit for Academic Success.
+13062052269
info@desklib.com
Available 24*7 on WhatsApp / Email
![[object Object]](/_next/static/media/star-bottom.7253800d.svg)
Unlock your academic potential
Copyright © 2020–2026 A2Z Services. All Rights Reserved. Developed and managed by ZUCOL.