UK Alcohol Consumption: Trends, Consequences, and Public Health Report
VerifiedAdded on 2023/01/17
|1
|461
|219
Report
AI Summary
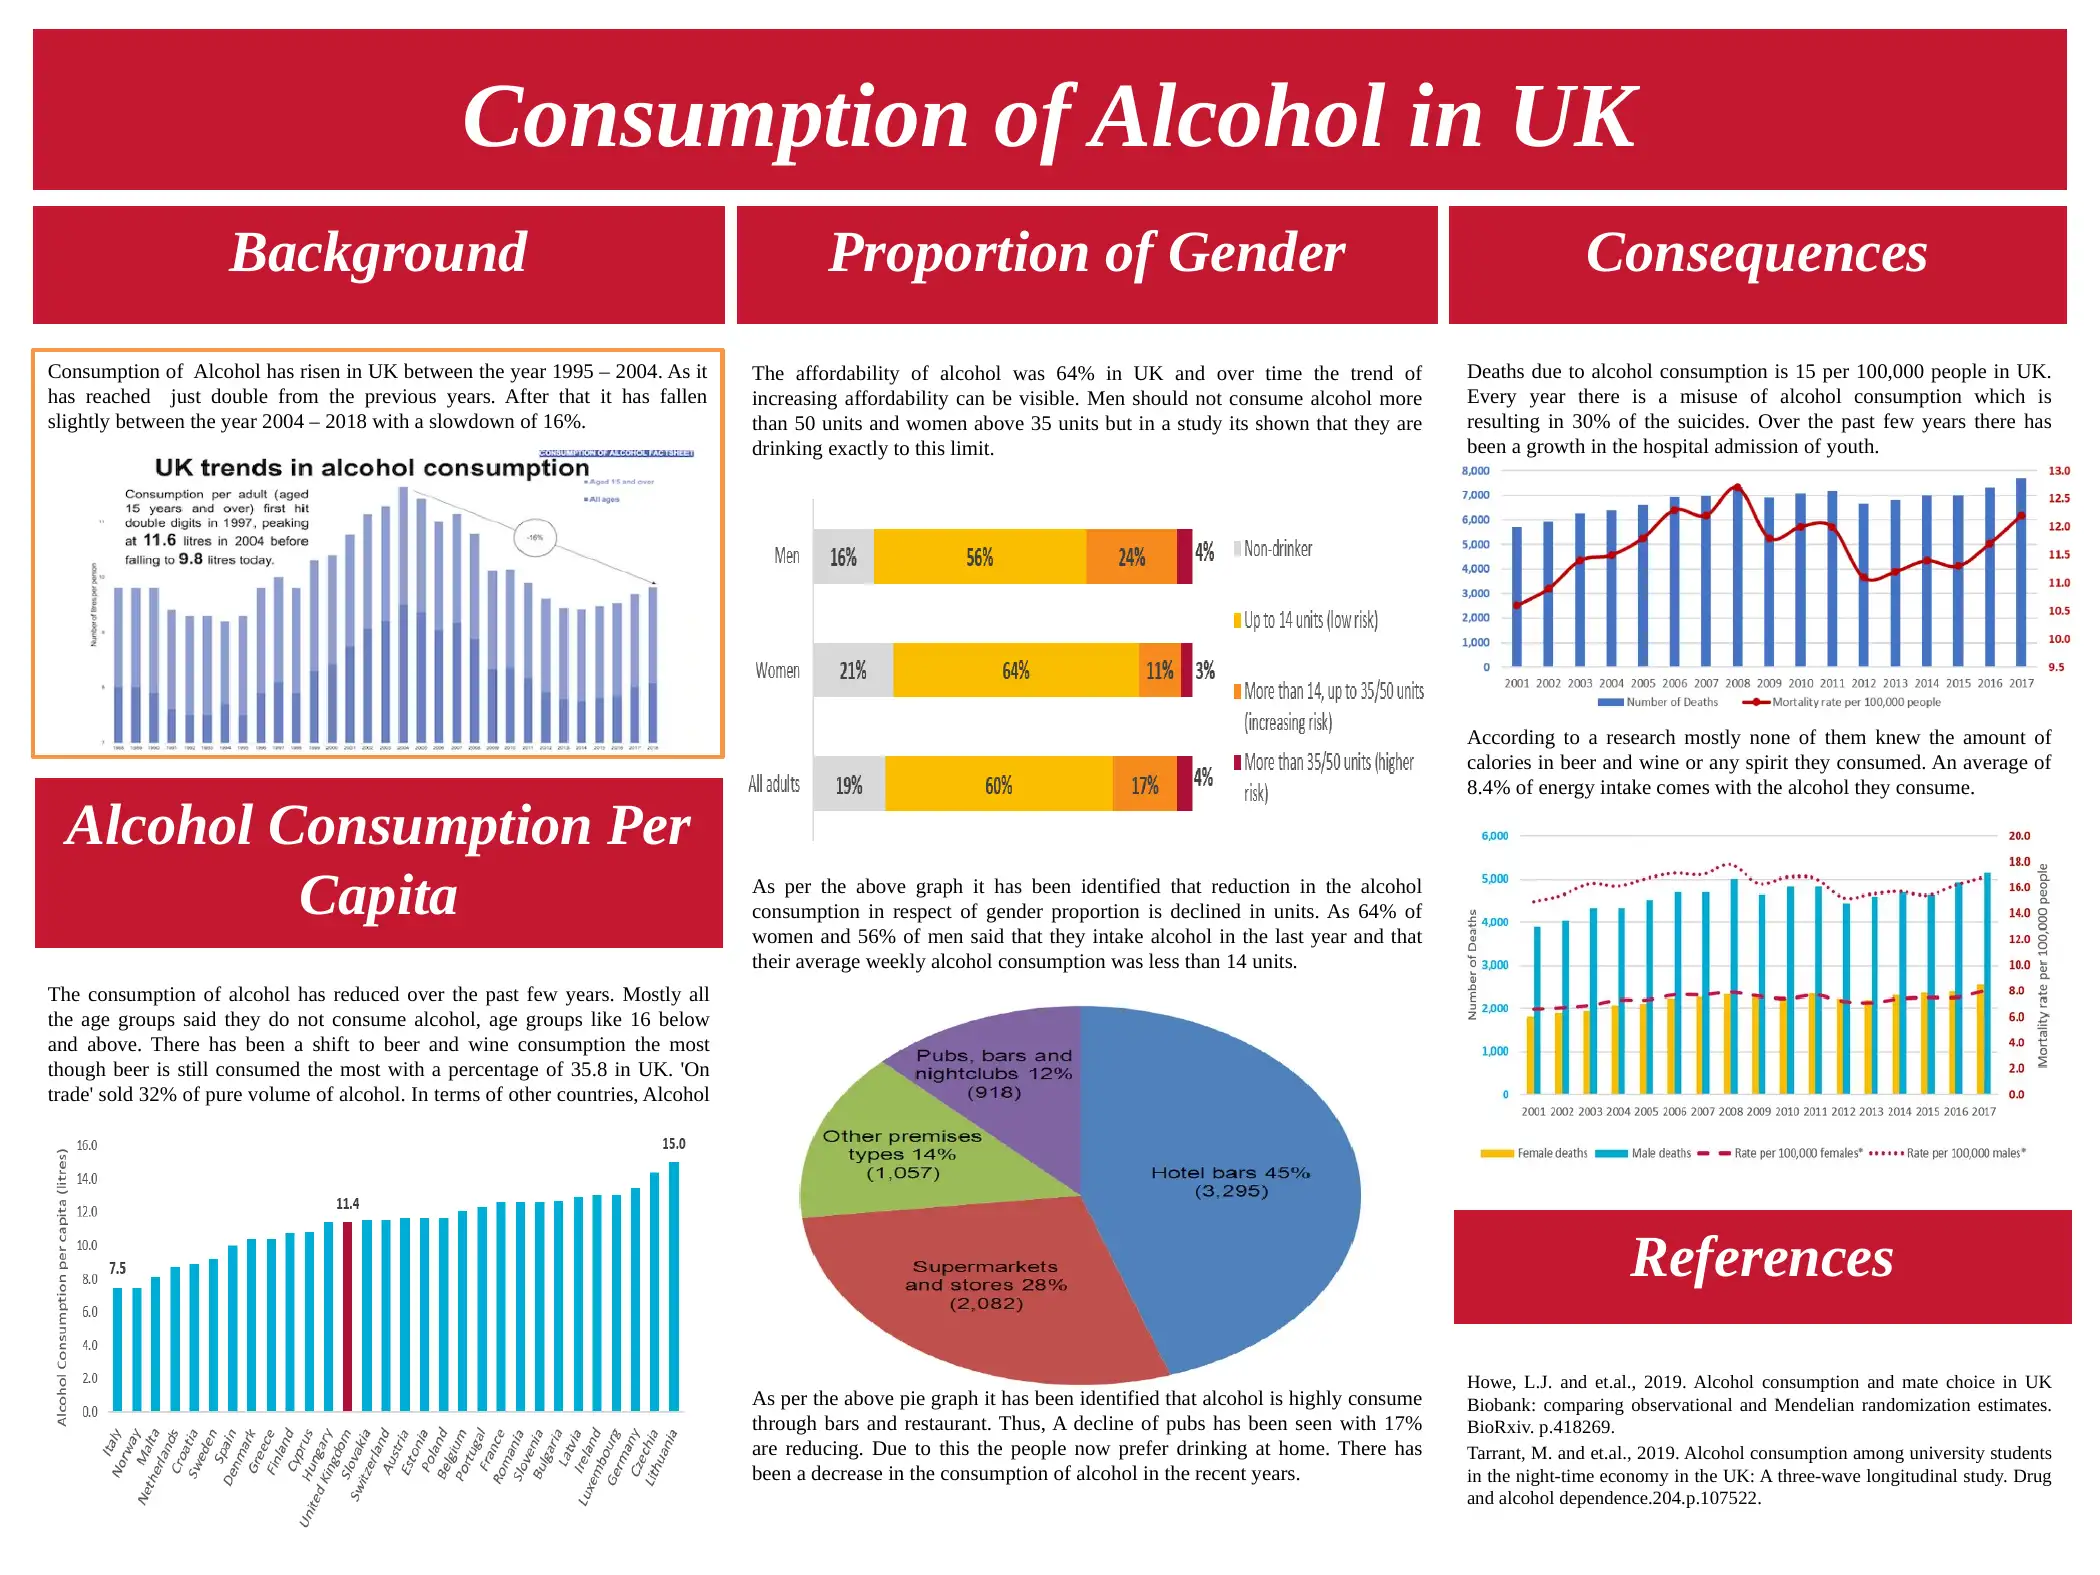
This report provides an overview of alcohol consumption trends in the UK, analyzing data from 1995 to 2018. It highlights the initial increase in consumption followed by a decline, and discusses the affordability of alcohol. The report presents statistics on alcohol unit consumption by gender, the impact on mortality rates, and the rise in alcohol-related hospital admissions among youth. It also examines the shift in alcohol preferences, with beer and wine consumption increasing, and the decline of pubs leading to more home consumption. The analysis includes per capita alcohol consumption data and references related research. This data is available on Desklib where students can find other assignments and study tools.
Related Documents


Your All-in-One AI-Powered Toolkit for Academic Success.
+13062052269
info@desklib.com
Available 24*7 on WhatsApp / Email
![[object Object]](/_next/static/media/star-bottom.7253800d.svg)
Copyright © 2020–2026 A2Z Services. All Rights Reserved. Developed and managed by ZUCOL.