Potential Measures for Reducing Ship Emissions and Pollution
VerifiedAdded on 2020/06/05
|50
|16565
|450
Report
AI Summary
This report provides a comprehensive analysis of the environmental impact of ship emissions and explores potential measures to reduce pollution from shipping operations. It begins by examining the general impacts of emissions on the environment and human health, including the growth of maritime transportation and the geographical distribution of ship traffic. The report then delves into solutions implemented by the IMO and EU to reduce emissions, including regulations and governance, and lessons learned. Furthermore, it investigates solutions specific to West Africa, focusing on discharge control areas and methods for SOx reduction, such as low sulfur fuel oil and exhaust gas cleaning systems. The report includes illustrations and data to support its findings, offering a detailed overview of the challenges and potential solutions in mitigating the environmental impact of ship emissions, and is available on Desklib for students.
POTENTIAL MEASURE
TO REDUCE EMISSION
FROM SHIPS
TO REDUCE EMISSION
FROM SHIPS
Paraphrase This Document
Need a fresh take? Get an instant paraphrase of this document with our AI Paraphraser
TABLE OF CONTENTS
CHAPTER 3: GENERAL IMPACTS OF EMISSION FROM SHIPPING OPERATIONS ON
THE ENVIRONMENT AND HUMAN HEALTH.........................................................................1
3.1 INTRODUCTION............................................................................................................1
3.2. Air emissions from shipping ..........................................................................................2
3.3. The effects of high sulphur content of fuel oil on ship operations..................................6
3.4. Ship emission impact in selected sea areas.....................................................................7
3.5. Conclusion.....................................................................................................................14
CHAPTER 4: SOLUTION AT IMO + EU TO REDUCE EMISSION LESSON TO LEARN
FROM THE EU.............................................................................................................................15
4.1 INTRODUCTION..........................................................................................................15
4.2 Environmental and public impacts from shipping are increasing..................................15
4.3 Shipping Emissions and Associated Impacts ................................................................16
4.4 IMO Regulations ...........................................................................................................18
4.5 GHG governance............................................................................................................25
4.5 Others.............................................................................................................................32
CHAPTER 5: SOLUTIONS IN WEST AFRICA AND DISCHARGE CONTROL FIELD IF
THIS POSSIBLE FOR WEST AFRICA.......................................................................................33
5.1 Overview of Annex VI of MARPOL.............................................................................33
5.2 Discharge control area....................................................................................................33
5.2.1 Overview of discharge control area.............................................................................33
5.2.2 Emission Control Area (ECA) Criteria.......................................................................34
5.3 Methods for SOx reduction............................................................................................42
5.3.1 Low Sulphur Fuel Oil ( LSFO)...................................................................................42
5.3.2 Exhaust gas cleaning systems......................................................................................43
5.3.2.1 Sea water scrubber....................................................................................................43
5.3.2.2 Fresh Water Scrubber...............................................................................................44
Conclusion.....................................................................................................................................45
REFERENCES..............................................................................................................................47
Illustration Index
Illustration 1: The ship traffic density in June 2009 based on AMVER.........................................3
Illustration 2: Approximation of ship distribution based on ICOADS............................................4
Illustration 3: Comparing Fuel Consumption, CO2 and Other Emissions from International
Shipping and Aircraft for the Year 2000.........................................................................................6
Illustration 4: Map of Mediterranean Sea......................................................................................10
Illustration 5: Straits of Malacca Map. Source: Fajar Nugraha 2009............................................13
Illustration 6: Global Co2 emissions from shipping......................................................................17
Illustration 7: Global Non GHG emissions....................................................................................18
Illustration 8: CO2 reductions from EEDI balance........................................................................19
Illustration 9: Existing and Future ECAs in the World..................................................................20
Illustration 10: MARPOL Annex VI SOx Content Limit..............................................................21
Illustration 11: Shipping governance.............................................................................................25
Illustration 12: Carbon performance of the biggest shipping firms...............................................26
Illustration 13: Reduction discharge governance survey...............................................................30
Illustration 14: Sox scrubber..........................................................................................................31
Illustration 15: The SECA delineation of the Baltic and the North Sea........................................36
Illustration 16: The estimation of SOx emissions within the Baltic and the North Sea SECA ...38
Illustration 17: The ECA delineation of EEZ US and Canada ....................................................39
Illustration 18: ECA nd global sulphur cap redction progress from 2006 - 2020..........................43
Illustration 19: Principle diagram of sea water scrubbing (SWS) process....................................44
Illustration 20: Principle diagram of freshwater scrubbing (FWS) process..................................45
⊘ This is a preview!⊘
Do you want full access?
Subscribe today to unlock all pages.
Trusted by 1+ million students worldwide
CHAPTER 3: GENERAL IMPACTS OF EMISSION FROM SHIPPING
OPERATIONS ON THE ENVIRONMENT AND HUMAN HEALTH.
3.1 INTRODUCTION
This particular section of dissertation includes information on study done regarding the
impacts of various emissions from the shipping operations along with their impacts on
surrounding environment and human life. It includes the discussion on growth of the maritime
transportation along the geographical distribution of shipping traffic areas. However, the focus is
done on various types of emission that are emitted in air and in water which pose harm to the
marine ecosystem, surrounding environment and human health.
3.1.1. The growth of maritime transportation
Global trading driven maritime transport organisation is related to the expansion of wide
ship emission inventories. There is a significant impact of Merchant ships on the worldwide
cargo transportation with the exchange volume of 80% of the trade in world. According to the
information aggregates good loaded was exceeded up to 8 million tons in 2007 and it was also
found that majority of the good that was loaded was dry cargo (United Nations Conference on
Trade and Development (UNCTAD, 2008). The fleet number in whole world were influenced by
the request of worldwide seaborne exchange invariably up to a reasonable capacity to carry out
the supply of goods. The world fleet having more than 100 GT of impelled maritime vessels
includes 97,504 vessels of 774.5 million GT having the average age of 22 years (IMO, 2008)
which includes the general cargo ships, container vessels, passenger's vessels, bulk carrier and oil
tankers. In case when whatever that was said is completed than in return, the quantity of all dry
and liquid transporting cargo vessels which contains coal, phosphate, grain, oil, ore,
bauxite/alumina, press metal and many other cargo's were expanded step by step in upcoming
more than 3 decades. In a survey that was conducted for loaded cargo statistics of maritime
transport reveals the high volume carriage having low value good such as grain and phosphate
and regardless to this there has been a significant expand in high estimation products that are
conveyed by these containers.
On the basis of Fearnley's review it was found that over the year around 32,932 billion
ton-miles international seaborne transport was recorded in 2007 against the 31,447 billion ton-
miles in 2006 (UNCTAD, 2008). However, it was found that estimated figure were highly
effected due to economic crises and the demands for transportation through cargo along the sea,
1
Paraphrase This Document
Need a fresh take? Get an instant paraphrase of this document with our AI Paraphraser
which was attuned from the transport freight rate. Also, there were different ways for each type
of commodity to represent their transport fright rate which includes: the Baltic Exchange Dirty
Tanker Index (BDTI) for crude oil, the Hamburg Index (HIX) for container and Baltic Exchange
Dry Index (BDI) for dry bulk. The BDI was dramatically depreciated more than 11-fold from
11,793 in May 2008 to 891 in November 2008 (UNCTAD, 2008) followed by BDTI from
around 2100 in May 2008 to below 600 in February 2009 (UNCTAD, 2009, p.14) and HIX as
(Dynamar, 2009) writes “HIX decreased by 24% and 75% in February 2008 and February 2009
respectively” (UNCTAD, 2009, p.11).
As the result of sharp decline in demand of transport services because of the financial
crises, downsize in indexes were observed that further resulted in reduction of international
trade. Because of low demand for the maritime transport only small amount of ships were in use
while other merchant ships have not been used for a period. According to an example, Lloyd’s
List 2009 reveals that about 17.3 million dead weight ton of bulk carrier fleet or 9% of the
global fleet is not in use (UNCTAD, 2009, p.10) and according to Containerization International
2009 reports about 11% of the world's container fleet has been set down (UNCTAD, 2009, p.12).
And it was assumed that it may take from few months to several years in order to overcome from
the ongoing problem in shipping business. Similarly, the rate of BDI in February 2009, have
fluctuated from 600 to 2000 (UNCTAD, 2009, p.11). Although, it does not depict the recovery as
there are many other indexes that are still unaffected. However, the economic crises is still on the
way and in order to keep merchant vessels the pre-eminent mode of transport the company is
providing high volume cargo carriages at lower shipping costs. Thus, it can be inferred that the
development of maritime transport tends to increase the emission inventories, however the crises
is still going on.
3.2. Air emissions from shipping
3.2.1. The Geographical distribution of ship traffic areas.
Ships is the large watercraft that connects loading port to the unloading port in whole
world. These loading and unloading ports are connected through many trade routes of maritime
between Europe and America, Asia and America, and Europe and Asia. Also, the major loading
ports were mainly found in Asian region. For example, the ports of Singapore and China belongs
to twenty container terminal. On the basis of the above mentioned route the shipping traffic
density is concentrated in areas which fall in between 10o latitude north and 60o latitude north
2
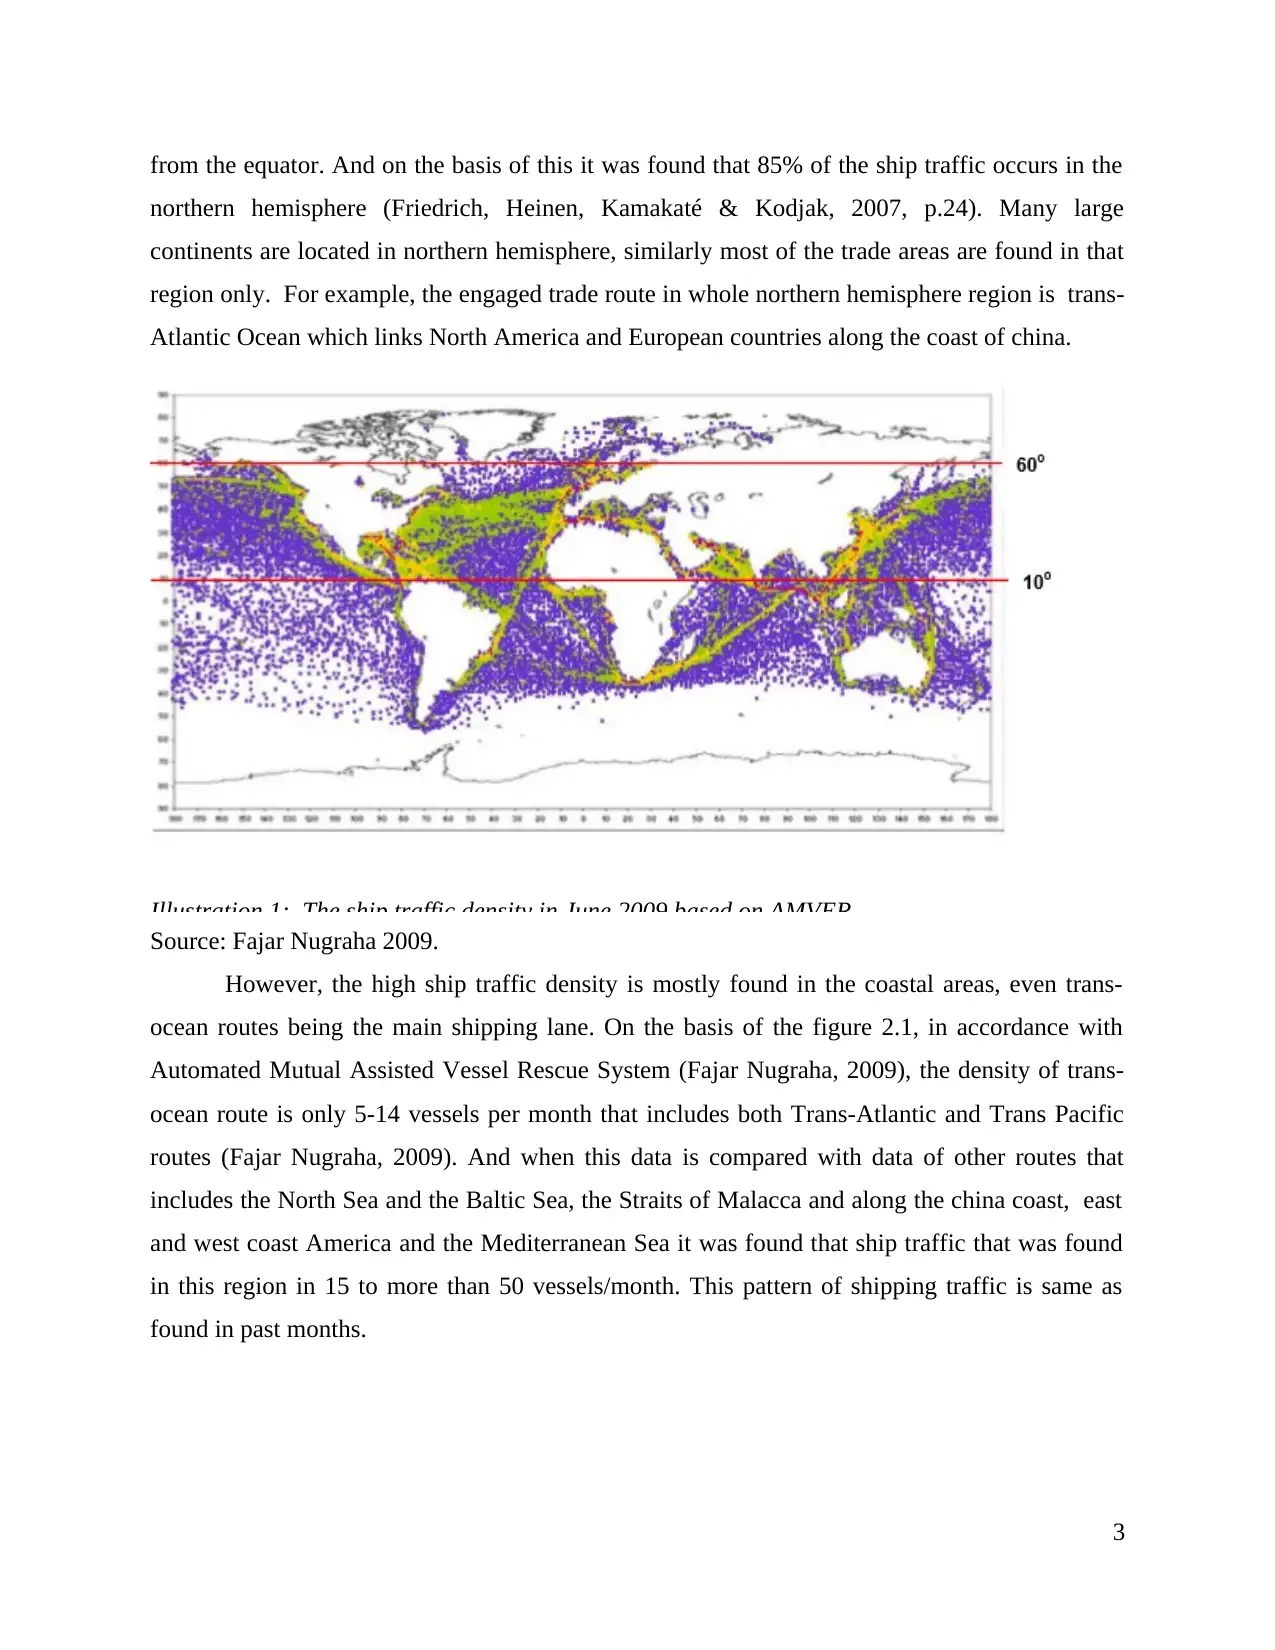
from the equator. And on the basis of this it was found that 85% of the ship traffic occurs in the
northern hemisphere (Friedrich, Heinen, Kamakaté & Kodjak, 2007, p.24). Many large
continents are located in northern hemisphere, similarly most of the trade areas are found in that
region only. For example, the engaged trade route in whole northern hemisphere region is trans-
Atlantic Ocean which links North America and European countries along the coast of china.
Illustration 1: The ship traffic density in June 2009 based on AMVER
Source: Fajar Nugraha 2009.
However, the high ship traffic density is mostly found in the coastal areas, even trans-
ocean routes being the main shipping lane. On the basis of the figure 2.1, in accordance with
Automated Mutual Assisted Vessel Rescue System (Fajar Nugraha, 2009), the density of trans-
ocean route is only 5-14 vessels per month that includes both Trans-Atlantic and Trans Pacific
routes (Fajar Nugraha, 2009). And when this data is compared with data of other routes that
includes the North Sea and the Baltic Sea, the Straits of Malacca and along the china coast, east
and west coast America and the Mediterranean Sea it was found that ship traffic that was found
in this region in 15 to more than 50 vessels/month. This pattern of shipping traffic is same as
found in past months.
3
⊘ This is a preview!⊘
Do you want full access?
Subscribe today to unlock all pages.
Trusted by 1+ million students worldwide
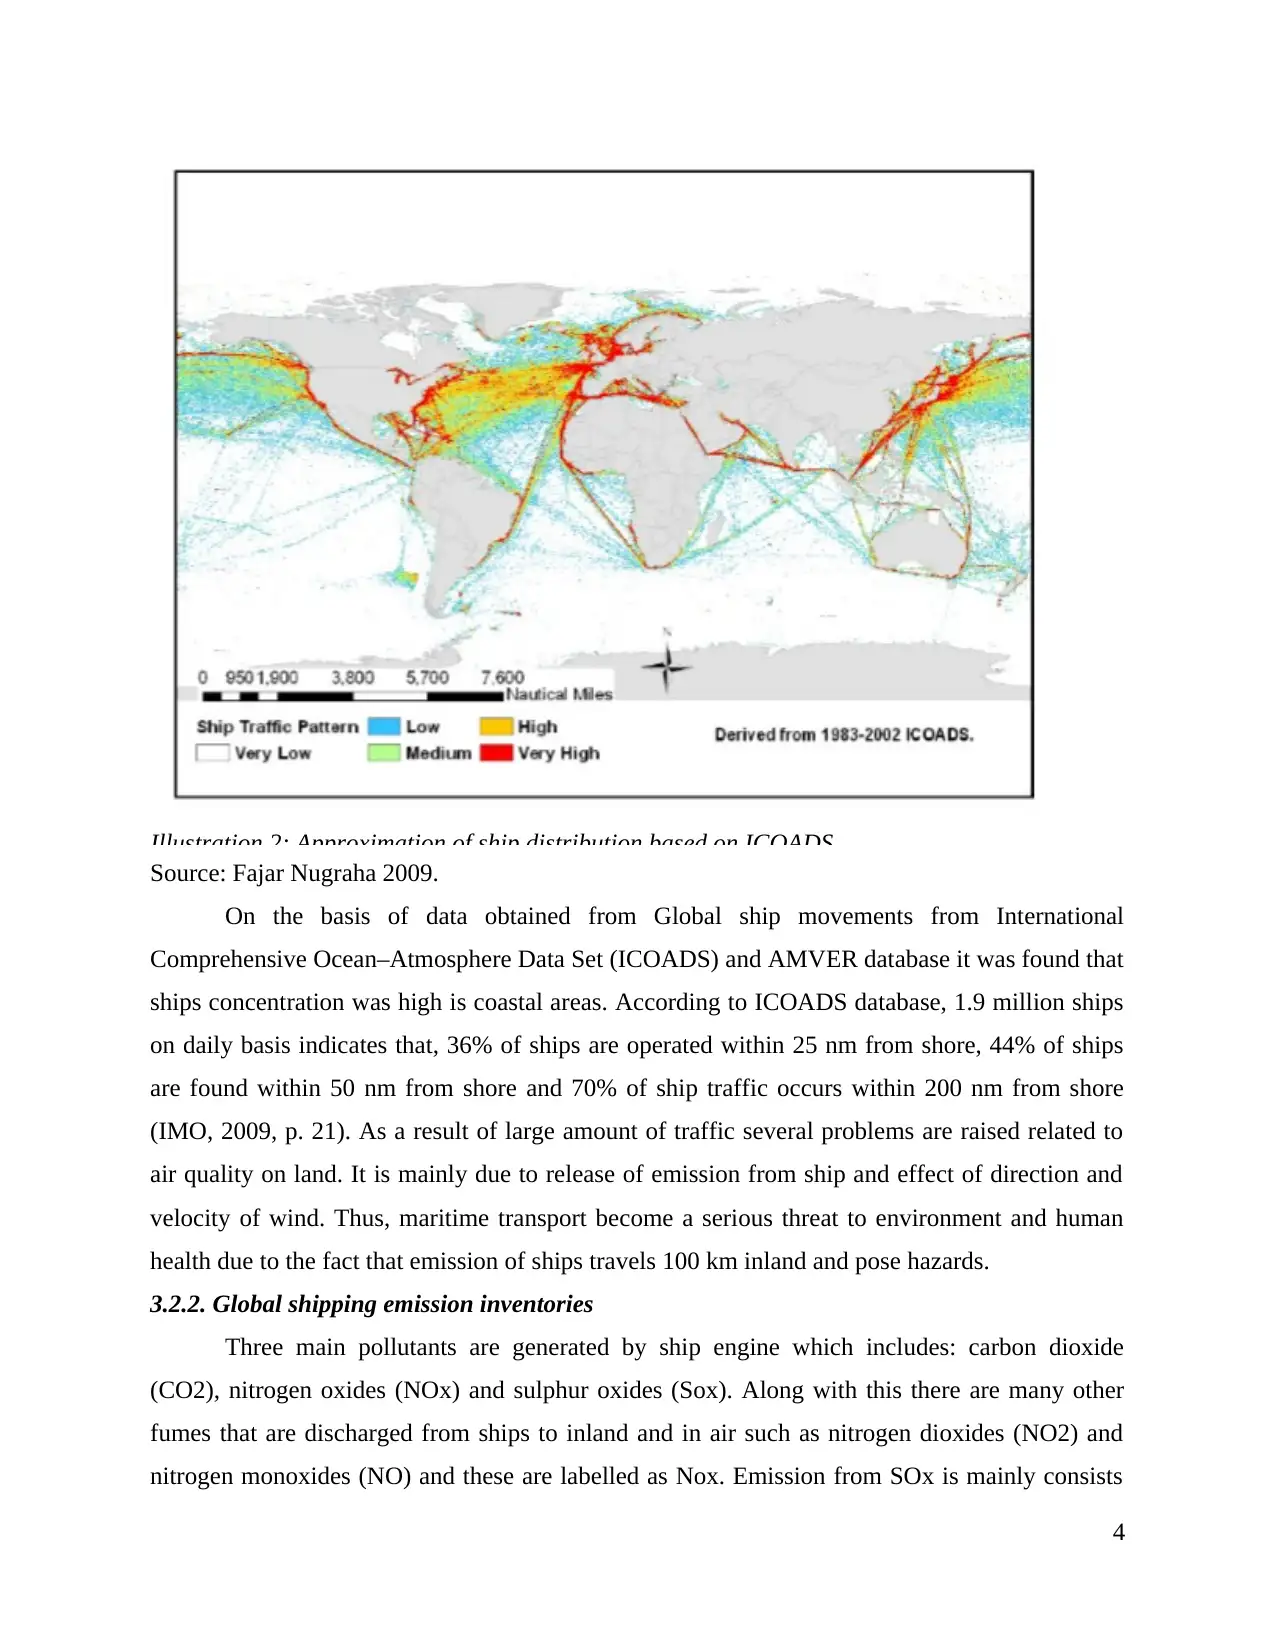
Illustration 2: Approximation of ship distribution based on ICOADS.
Source: Fajar Nugraha 2009.
On the basis of data obtained from Global ship movements from International
Comprehensive Ocean–Atmosphere Data Set (ICOADS) and AMVER database it was found that
ships concentration was high is coastal areas. According to ICOADS database, 1.9 million ships
on daily basis indicates that, 36% of ships are operated within 25 nm from shore, 44% of ships
are found within 50 nm from shore and 70% of ship traffic occurs within 200 nm from shore
(IMO, 2009, p. 21). As a result of large amount of traffic several problems are raised related to
air quality on land. It is mainly due to release of emission from ship and effect of direction and
velocity of wind. Thus, maritime transport become a serious threat to environment and human
health due to the fact that emission of ships travels 100 km inland and pose hazards.
3.2.2. Global shipping emission inventories
Three main pollutants are generated by ship engine which includes: carbon dioxide
(CO2), nitrogen oxides (NOx) and sulphur oxides (Sox). Along with this there are many other
fumes that are discharged from ships to inland and in air such as nitrogen dioxides (NO2) and
nitrogen monoxides (NO) and these are labelled as Nox. Emission from SOx is mainly consists
4
Paraphrase This Document
Need a fresh take? Get an instant paraphrase of this document with our AI Paraphraser
of SO2, SO3 (around 2-3%) and SO4 (Alexanderson, 1991, p.40). Due to the reaction between
NOx and Sox the particulate matter is formed. Emission studies has linked shipping traffic
density to estimate the global shipping emission inventories and several scholars and institutions
have already conducted this study (Endressen, Sørgaård, Sundet, Dalsøren, Isaksen, Berglen &
Gravir, 2003; Eyring, Köhler, van Aardenne and Lauer, 2005; Corbet, Winebrake, Green,
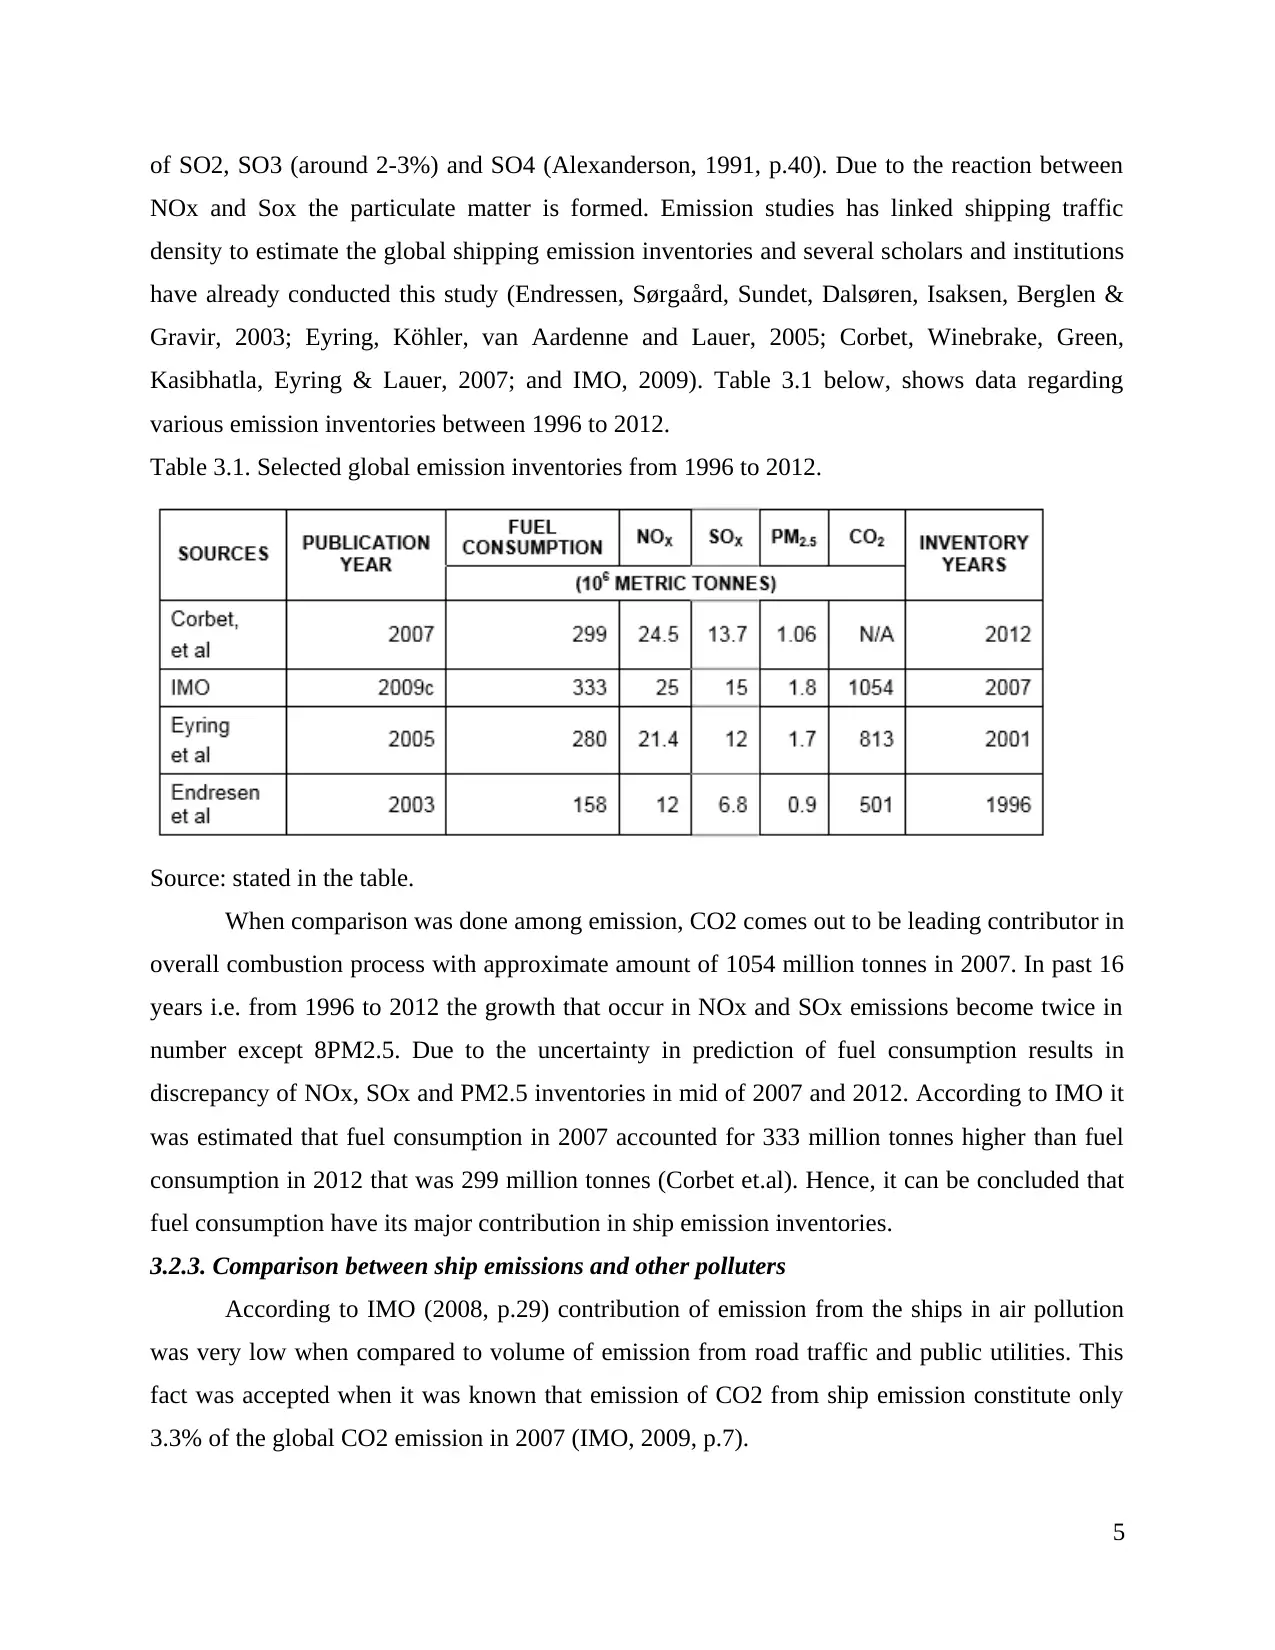
Kasibhatla, Eyring & Lauer, 2007; and IMO, 2009). Table 3.1 below, shows data regarding
various emission inventories between 1996 to 2012.
Table 3.1. Selected global emission inventories from 1996 to 2012.
Source: stated in the table.
When comparison was done among emission, CO2 comes out to be leading contributor in
overall combustion process with approximate amount of 1054 million tonnes in 2007. In past 16
years i.e. from 1996 to 2012 the growth that occur in NOx and SOx emissions become twice in
number except 8PM2.5. Due to the uncertainty in prediction of fuel consumption results in
discrepancy of NOx, SOx and PM2.5 inventories in mid of 2007 and 2012. According to IMO it
was estimated that fuel consumption in 2007 accounted for 333 million tonnes higher than fuel
consumption in 2012 that was 299 million tonnes (Corbet et.al). Hence, it can be concluded that
fuel consumption have its major contribution in ship emission inventories.
3.2.3. Comparison between ship emissions and other polluters
According to IMO (2008, p.29) contribution of emission from the ships in air pollution
was very low when compared to volume of emission from road traffic and public utilities. This
fact was accepted when it was known that emission of CO2 from ship emission constitute only
3.3% of the global CO2 emission in 2007 (IMO, 2009, p.7).
5
NOx and Sox the particulate matter is formed. Emission studies has linked shipping traffic
density to estimate the global shipping emission inventories and several scholars and institutions
have already conducted this study (Endressen, Sørgaård, Sundet, Dalsøren, Isaksen, Berglen &
Gravir, 2003; Eyring, Köhler, van Aardenne and Lauer, 2005; Corbet, Winebrake, Green,
Kasibhatla, Eyring & Lauer, 2007; and IMO, 2009). Table 3.1 below, shows data regarding
various emission inventories between 1996 to 2012.
Table 3.1. Selected global emission inventories from 1996 to 2012.
Source: stated in the table.
When comparison was done among emission, CO2 comes out to be leading contributor in
overall combustion process with approximate amount of 1054 million tonnes in 2007. In past 16
years i.e. from 1996 to 2012 the growth that occur in NOx and SOx emissions become twice in
number except 8PM2.5. Due to the uncertainty in prediction of fuel consumption results in
discrepancy of NOx, SOx and PM2.5 inventories in mid of 2007 and 2012. According to IMO it
was estimated that fuel consumption in 2007 accounted for 333 million tonnes higher than fuel
consumption in 2012 that was 299 million tonnes (Corbet et.al). Hence, it can be concluded that
fuel consumption have its major contribution in ship emission inventories.
3.2.3. Comparison between ship emissions and other polluters
According to IMO (2008, p.29) contribution of emission from the ships in air pollution
was very low when compared to volume of emission from road traffic and public utilities. This
fact was accepted when it was known that emission of CO2 from ship emission constitute only
3.3% of the global CO2 emission in 2007 (IMO, 2009, p.7).
5
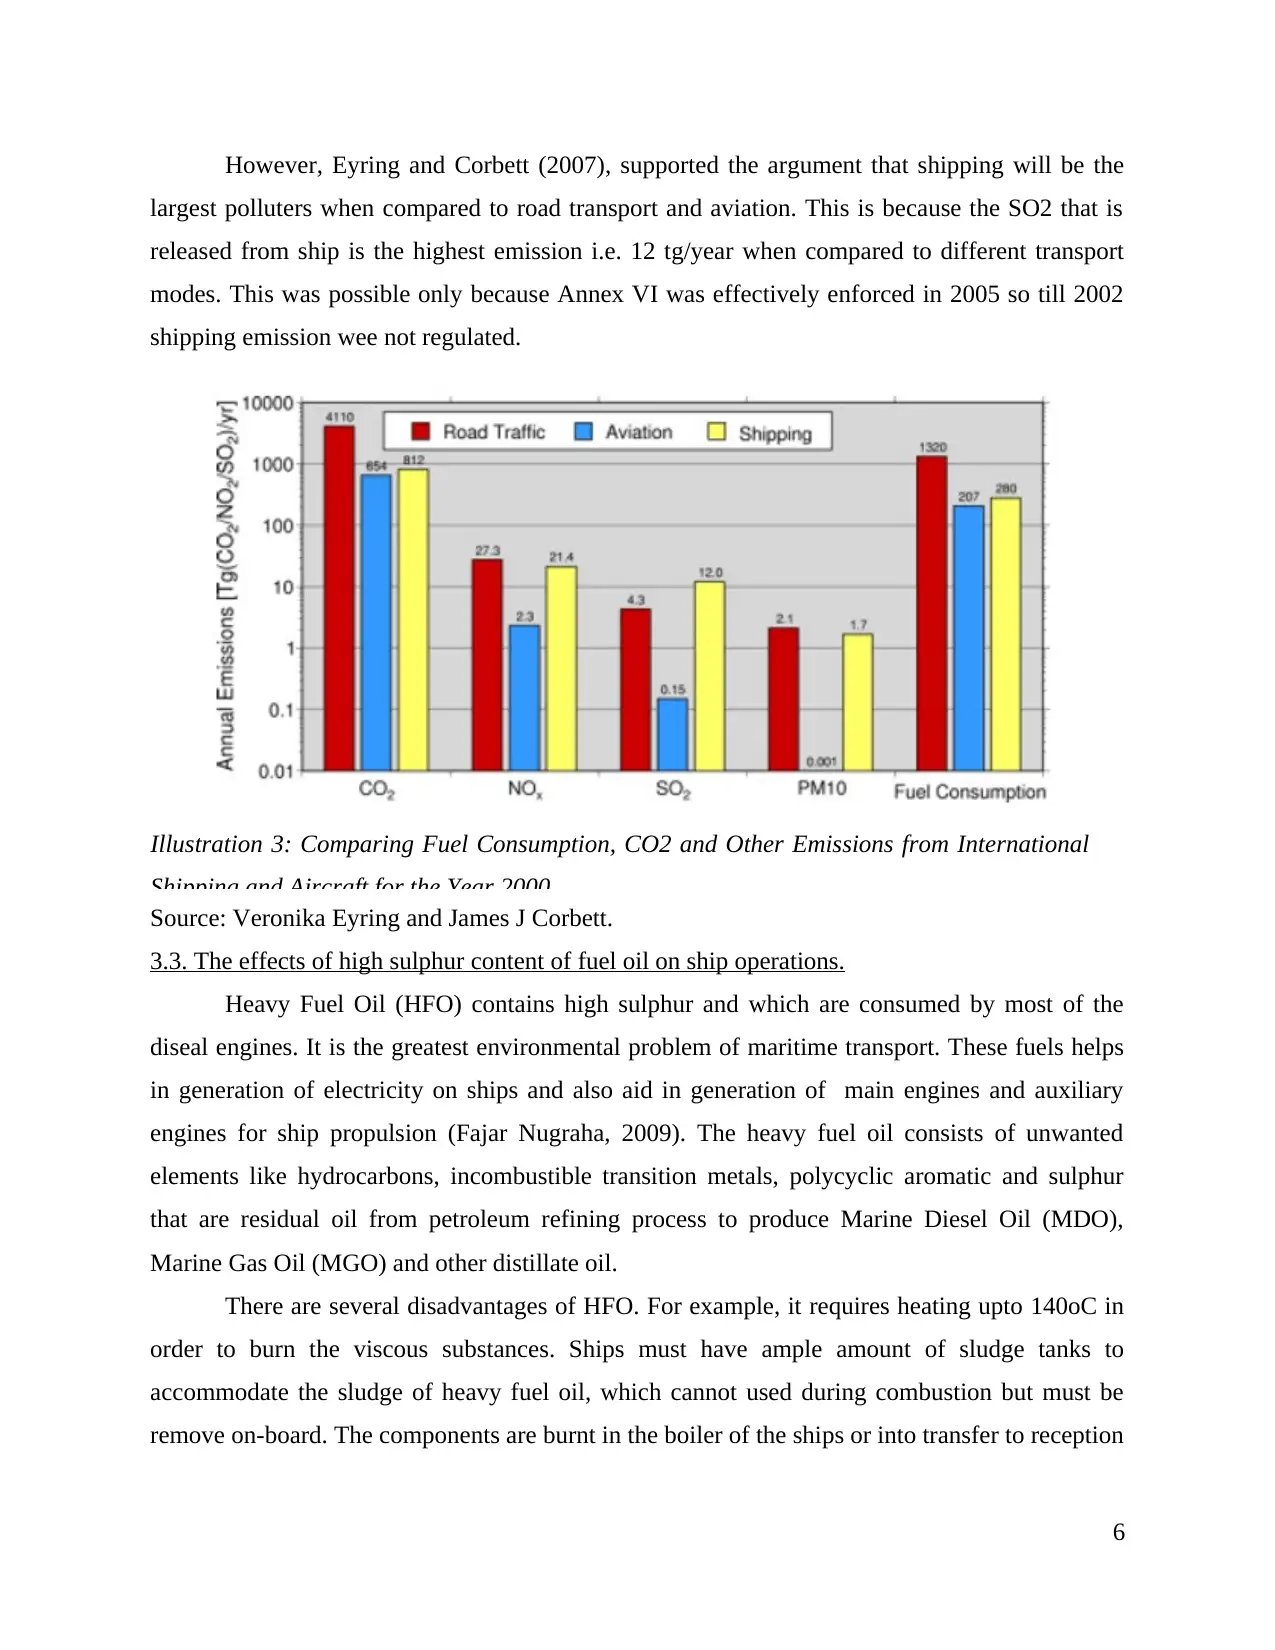
However, Eyring and Corbett (2007), supported the argument that shipping will be the
largest polluters when compared to road transport and aviation. This is because the SO2 that is
released from ship is the highest emission i.e. 12 tg/year when compared to different transport
modes. This was possible only because Annex VI was effectively enforced in 2005 so till 2002
shipping emission wee not regulated.
Illustration 3: Comparing Fuel Consumption, CO2 and Other Emissions from International
Shipping and Aircraft for the Year 2000
Source: Veronika Eyring and James J Corbett.
3.3. The effects of high sulphur content of fuel oil on ship operations.
Heavy Fuel Oil (HFO) contains high sulphur and which are consumed by most of the
diseal engines. It is the greatest environmental problem of maritime transport. These fuels helps
in generation of electricity on ships and also aid in generation of main engines and auxiliary
engines for ship propulsion (Fajar Nugraha, 2009). The heavy fuel oil consists of unwanted
elements like hydrocarbons, incombustible transition metals, polycyclic aromatic and sulphur
that are residual oil from petroleum refining process to produce Marine Diesel Oil (MDO),
Marine Gas Oil (MGO) and other distillate oil.
There are several disadvantages of HFO. For example, it requires heating upto 140oC in
order to burn the viscous substances. Ships must have ample amount of sludge tanks to
accommodate the sludge of heavy fuel oil, which cannot used during combustion but must be
remove on-board. The components are burnt in the boiler of the ships or into transfer to reception
6
⊘ This is a preview!⊘
Do you want full access?
Subscribe today to unlock all pages.
Trusted by 1+ million students worldwide
facilities. Moreover, the fumes exhausted by the ships emits harmful substances, which not only
impacts on environment but also affects the health of human beings.
3.4. Ship emission impact in selected sea areas.
Emission of NOx, SOx and PM from ships causes acidification, eutrophication, human health
damage and ground level ozone. This impacts on environment and human health simultaneously.
This Chapter will cover the impact of those emissions on the environment and human health. The
rules regarding restriction of those emissions in ECA will also be discussed.
3.4.1. The Baltic Sea
In the Northern Europe, Baltic Sea is located, which is surrounded with the Gulf of Bothnia in
the north, the Gulf of Finland in the east, the Gulf of Gdansk and the Gulf of Riga in the south
and the southeast respectively. With an area of approximately 415 thousand square kilometre,
Baltic sea is the largest brackish water basin in the world. (Helsinki Commission HELCOM,
2009). It is surround by countries: Denmark, Sweden, Finland, Russia, Estonia, Latvia, Lithuania
Poland, and Germany. The fresh water from rivers and rain and seawater combines gives the
brackish water of the Baltic sea. Quite few animal and plant species live in the low salinity of
the Baltic Sea environment, which is similar to a lake or an estuary. Human Activities are
responsible for the increase in pollution in the Baltic Sea. Due to which many spices of animals
and aquatic plants are on the verge of extinction. Annex I, Annex V and Annex VI of MARPOL
73/78 declares Baltic Sea as special area 10 after increase in the vulnerability. Particularly
Sensitive Sea Area (PSSA11) in 2005 declared Baltic sea as ECA in Appendix B. The list of
other special areas are presented under MARPOL.
As per, Pawlak, Laamanen & Andersen (2009, p.5), due to eutrophication 161 coastal
areas affected by the pollution of 171 coastal areas surrounding Baltic Sea. IT can be stated that
more than 90% of the total area were affected by the emission and pollution of Baltic Sea.
Several indicators of eutrophication occur in the Baltic Sea such as cyanobacteria, which have
covered beaches in the northern Baltic and in the Baltic Proper (HELCOM, 2006, p.16).
Inconvenience for recreational activities, reduced water transparency and low oxygen level are
the common problems and issues arises in the Baltic Sea. Thus, it implies that eutrophication
creates a great impact on tourism industry and marine ecosystem of the Baltic Sea.
The lesser expectancy in the human life considers the anthropogenic emissions from the
ships. The expectancy rate of even the Baltic countries has considered as below the average
7
Paraphrase This Document
Need a fresh take? Get an instant paraphrase of this document with our AI Paraphraser
values (Cofala et al, 2007, p. 39). This is because of the minimised traffic density of shipping in
the northern Baltic sea. When compared with the other parts of the European Sea, it was founded
lesser. According to Corbet and et.al (2007), there were a huge number of deaths as the
premature mortalities in the Mediterranean sea and Europe in the year 2002. A very wider
contribution to the mortality comes through the emissions from the ships that are navigating from
the sea and the Mediterranean sea. Health care is considered as a very essential service that is
being provided by the private and public sectors, specially in countries in which focus is on
preventing the illness that is being done by the emissions from the ships. This seems quite costly.
According to an environmental agency, it was analysed that for about 4.5 billion euro annually,
are being used for prevention of various diseases such as cancer etc. which is being done because
of the emissions (Transport & Environmental Bulletin, 2009). There are various strategies that
are helpful enough to reduce the emissions from the ships and these are taken from the shipping
and the land industries.
3.4.2 The English Channel and the North Sea
The north sea and the English channel is being considered as the strait of dover in the northern
boundary and the souther end as well. The northern sea occupies about 750,000 km and has a
volume of about 94,000 km (Vlasblom, 2006, p.51). It involves the English channel and the
straits of doves as well. It is considered as very shallow and is deep for about 700 m as the
northern Trench is (Ducrotoy & Elliot, 2008, p.9). Various emissions are released from the ships
such as NOx, SOx etc. When compared it with the Baltic Sea, the inventories in the emissions in
the North Sea are analysed as more than twice. It is enough understandable that the predictions
of the inventory are calculated on the basis of the movements in the ship (Cofala et al, 2007,
p.10). In fact, the number of ships navigating in the North Sea is larger than in the Baltic Sea as
stated above.
There were predictions regarding the emission of SO2 and NO2 that, 90% of these
pollutants were originating from the zone of 50 nautical miles which contaminate the north sea
along with English channel (The EEB et al, 2004, p.3). The presence of SO2 in environment
result sin acid rain which leads to acidification that layers the chemical composition of the land
and water and adversely effect the rainforest. For example, there is high deposition of acid in
several forests such as Germany 62,491 km, Belgium 4591 Km and in UK it is 4924 km (Cofala
8
et al, 2007, p.45). Due to deposition of acid on land the minerals are depleted which tends to
impair the growth of tress.
Along with this, life expectancy is also considered to be one major indicator of effect of
particulate mater on the human life. However, the average life expectancy in EU's 27 member
state was found to be 8 months in year 2000, along with this several other countries that border
Great Northern sea also witnessed this loss (Cofala et al, 2007, p.40). For example in Belgium it
was 12.17 month, Netherlands experience 11.51 and UK have 6.71 months. From the above data
it is clear that air quality in the Northern European countries that borders the Baltic Sea is good
for human health when compared to other countries due to less ship traffic density factor.
However, in the upcoming years if Arctic sea route becomes shipping lane, that will connect
both Europe and Asia then it will degrade the quality of air in that region and ultimately decrease
the life expectancy of people.
3.4.3. The Mediterranean Sea
Mediterranean sea is the largest intercostal sea, that separates the Europe, Asia and
Africa. It is also connected to the Atlantic Ocean and is completed enclosed by land from three
sides i.e. in North by Southern Europe and Anatolia, in South by North Africa and in the east by
Levant. The Mediterranean sea is along which covers the approximate area of 2,965,000 km2
with the average depth of more than 200 m (Clark, 2001, p. 206). The eastern and western
Mediterranean are separated by a channel known as Sicilian Channel with the formation of
different type of hydrological and geographical characteristics between them. The approximate
length of Mediterranean sea coast is 46,000 km with the dense populations comprising 601 cities
which receives 175 million tourist each year (Abdulla & Linden, 2008, p. 7).
9
⊘ This is a preview!⊘
Do you want full access?
Subscribe today to unlock all pages.
Trusted by 1+ million students worldwide
1 out of 50

Your All-in-One AI-Powered Toolkit for Academic Success.
+13062052269
info@desklib.com
Available 24*7 on WhatsApp / Email
![[object Object]](/_next/static/media/star-bottom.7253800d.svg)
Unlock your academic potential
Copyright © 2020–2025 A2Z Services. All Rights Reserved. Developed and managed by ZUCOL.