Practical Epidemiology-SPSS
Added on 2023-02-02
26 Pages2909 Words30 Views
Practical Epidemiology-SPSS

Table of Contents
INTRODUCTION 1
Topic 1- Types of variables, recoding outcome and predictor variables 1
TOPIC 2: Approaches for missing data and outliers 3
Topic 3- Descriptive analyses of epidemiological data 5
TOPIC 4: Correlation and linear regression 9
TOPIC 5: Differences between groups and binary logistic regression 11
CONCLUSION 14
REFERENCES 15
INTRODUCTION
Portfolio Assessment is a kind of assessment that have large number of meaning and its
process includes methods that can serve a variety of purpose with different result so that accurate
values can be determined. In general it is stated that portfolio assessment could be examination
of student-selected illustration of activity experiences and written document related to result
being received by them. It is totally helpful and supportable in progress that further support in
achieving goals, including student affectivity. Portfolio assessments are used for large-scale
classification and accountability intention. The report cover, preparation of epidemiological data
for analysis with types of variable, predicator variable, statistical methods to determine missing
data, Frequency distributions, central tendency, standard deviation, standard error, variance and
confidence intervals. Apart this correlation and linear regression and differences between groups
and logistic regression.
Topic 1- Types of variables, recoding outcome and predictor variables
A) Survey item (question) where the responses will result in a continuous variable.
From the number of question it has been stated that the survey question 'How many hours
of physical activity do you do per week?' easy is it to manage on your household income' that
would be a favourable result in a continuous variable which would be marked as “scale” in
SPSS. According to Andrew Messing (2011) a continuous variable is said to be one which have
a continuum and which could have an infinite group of values so that better outcome can be
extracted. In general a continuous variable is defined as a variable that have an infinite number
of possible outcome or values which is totally opposite of a discrete variable that could only
consider only specific number of result. The above asked question about the number of hours of
physical activity yo have totally meets the criteria of continuous variable such as theoretically an
individual could have workout hours from zero and to infinite hours in a day.
B) Research question that may require this variable to be transformed into a binary
variable.
From the variable, a research question that is needed to how many number of hours are
required for daily physical exercise in a day to be reduced into other categories which will result
in binary variable can be Do you have any health issues currently?. This is meant that actual data
is needed to be divided into two groups such as those individual which say that they perform
1
exercise for specific number of hours in a day and thus answer is above zero to the aforesaid
question and those individual which do not perform any workout and answer to zero.
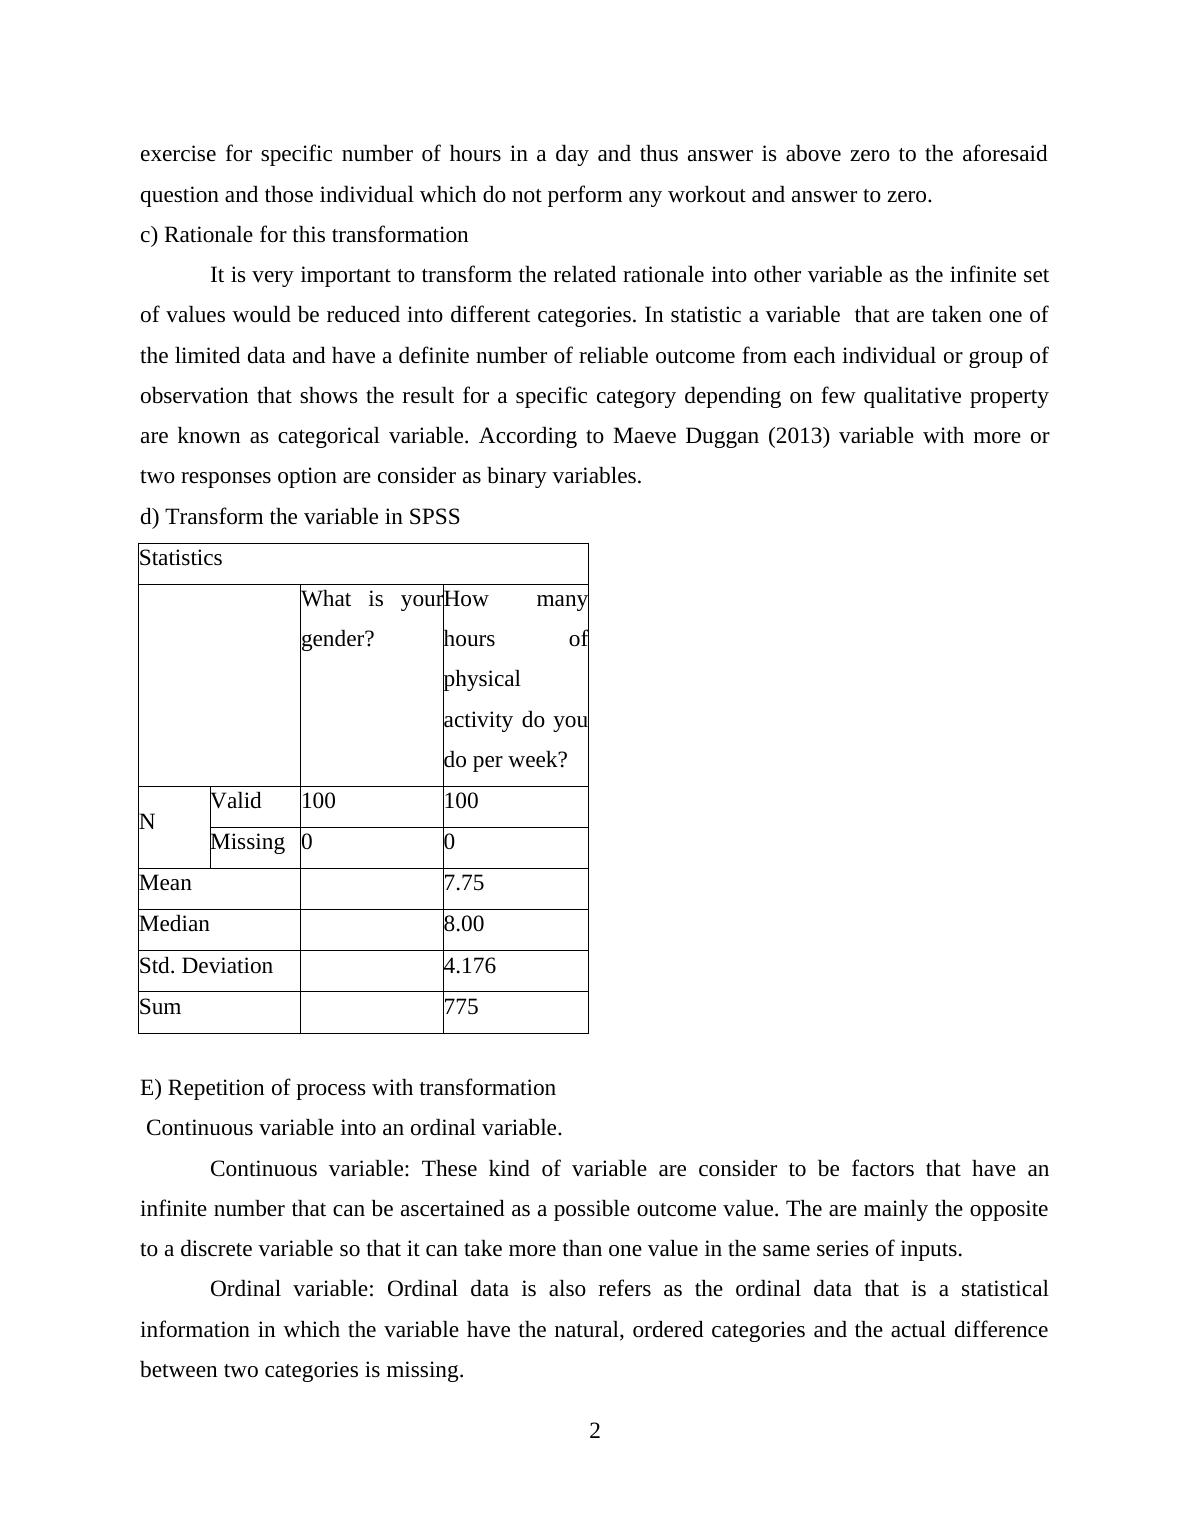
c) Rationale for this transformation
It is very important to transform the related rationale into other variable as the infinite set
of values would be reduced into different categories. In statistic a variable that are taken one of
the limited data and have a definite number of reliable outcome from each individual or group of
observation that shows the result for a specific category depending on few qualitative property
are known as categorical variable. According to Maeve Duggan (2013) variable with more or
two responses option are consider as binary variables.
d) Transform the variable in SPSS
Statistics
What is your
gender?
How many
hours of
physical
activity do you
do per week?
N Valid 100 100
Missing 0 0
Mean 7.75
Median 8.00
Std. Deviation 4.176
Sum 775
E) Repetition of process with transformation
Continuous variable into an ordinal variable.
Continuous variable: These kind of variable are consider to be factors that have an
infinite number that can be ascertained as a possible outcome value. The are mainly the opposite
to a discrete variable so that it can take more than one value in the same series of inputs.
Ordinal variable: Ordinal data is also refers as the ordinal data that is a statistical
information in which the variable have the natural, ordered categories and the actual difference
between two categories is missing.
2
question and those individual which do not perform any workout and answer to zero.
c) Rationale for this transformation
It is very important to transform the related rationale into other variable as the infinite set
of values would be reduced into different categories. In statistic a variable that are taken one of
the limited data and have a definite number of reliable outcome from each individual or group of
observation that shows the result for a specific category depending on few qualitative property
are known as categorical variable. According to Maeve Duggan (2013) variable with more or
two responses option are consider as binary variables.
d) Transform the variable in SPSS
Statistics
What is your
gender?
How many
hours of
physical
activity do you
do per week?
N Valid 100 100
Missing 0 0
Mean 7.75
Median 8.00
Std. Deviation 4.176
Sum 775
E) Repetition of process with transformation
Continuous variable into an ordinal variable.
Continuous variable: These kind of variable are consider to be factors that have an
infinite number that can be ascertained as a possible outcome value. The are mainly the opposite
to a discrete variable so that it can take more than one value in the same series of inputs.
Ordinal variable: Ordinal data is also refers as the ordinal data that is a statistical
information in which the variable have the natural, ordered categories and the actual difference
between two categories is missing.
2
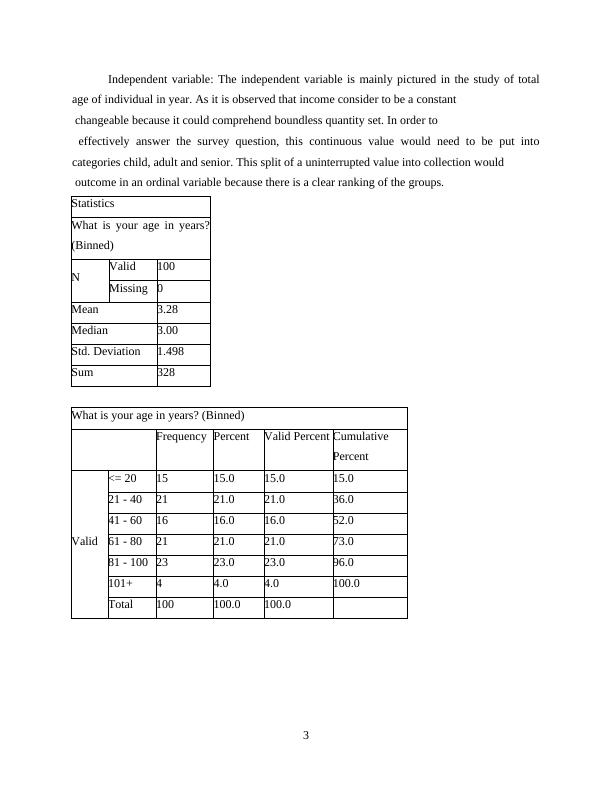
Independent variable: The independent variable is mainly pictured in the study of total
age of individual in year. As it is observed that income consider to be a constant
changeable because it could comprehend boundless quantity set. In order to
effectively answer the survey question, this continuous value would need to be put into
categories child, adult and senior. This split of a uninterrupted value into collection would
outcome in an ordinal variable because there is a clear ranking of the groups.
Statistics
What is your age in years?
(Binned)
N Valid 100
Missing 0
Mean 3.28
Median 3.00
Std. Deviation 1.498
Sum 328
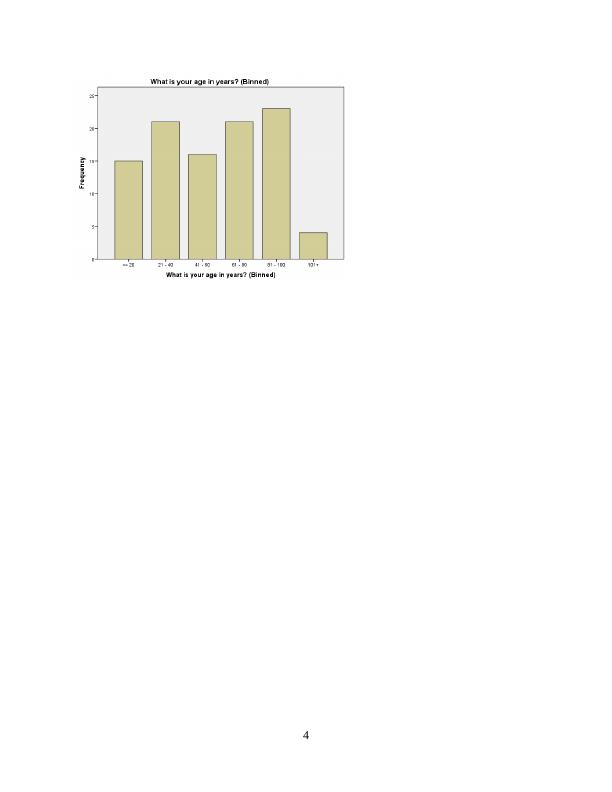
What is your age in years? (Binned)
Frequency Percent Valid Percent Cumulative
Percent
Valid
<= 20 15 15.0 15.0 15.0
21 - 40 21 21.0 21.0 36.0
41 - 60 16 16.0 16.0 52.0
61 - 80 21 21.0 21.0 73.0
81 - 100 23 23.0 23.0 96.0
101+ 4 4.0 4.0 100.0
Total 100 100.0 100.0
3
age of individual in year. As it is observed that income consider to be a constant
changeable because it could comprehend boundless quantity set. In order to
effectively answer the survey question, this continuous value would need to be put into
categories child, adult and senior. This split of a uninterrupted value into collection would
outcome in an ordinal variable because there is a clear ranking of the groups.
Statistics
What is your age in years?
(Binned)
N Valid 100
Missing 0
Mean 3.28
Median 3.00
Std. Deviation 1.498
Sum 328
What is your age in years? (Binned)
Frequency Percent Valid Percent Cumulative
Percent
Valid
<= 20 15 15.0 15.0 15.0
21 - 40 21 21.0 21.0 36.0
41 - 60 16 16.0 16.0 52.0
61 - 80 21 21.0 21.0 73.0
81 - 100 23 23.0 23.0 96.0
101+ 4 4.0 4.0 100.0
Total 100 100.0 100.0
3
4
End of preview
Want to access all the pages? Upload your documents or become a member.
Related Documents
Epidemiology Assignment Solutionlg...
|11
|3090
|181
Report on Health Statistic Assessmentlg...
|10
|2139
|64
Report on Myopia and Physical Activity in Adolescencelg...
|16
|2630
|59