Statistical Analysis of Singapore Rainfall Data (1980-2019): TMA01
VerifiedAdded on 2022/08/18
|18
|2657
|11
Homework Assignment
AI Summary
This assignment focuses on analyzing Singapore's monthly rainfall data from January 1980 to December 2019 to identify the wettest and driest periods. The student is tasked with using PSPP/SPSS to create variables, generate frequency distributions, and calculate descriptive statistics for total rainfall, number of days of rain, and z-scores. The assignment involves data transformation, statistical analysis, and interpretation of results, including identifying months, years, and decades with the highest and lowest rainfall. The student calculates probabilities, interprets z-scores, and addresses the limitations of using total rainfall and the number of rainy days as indicators of wetness/dryness, recommending solutions and analyzing the impact of the solution on the identified wettest and driest months. The assignment assesses the student's ability to apply statistical techniques to real-world data and draw meaningful conclusions for marketing and logistical purposes. The student's work includes the use of SPSS to compute new variables and conduct the necessary statistical analysis, including the creation of z-scores and frequency distribution tables.
Pre-Assignment Task (10 marks)
A market researcher is interested to understand the rain patterns in Singapore, specifically
which periods are the wettest and driest to plan for marketing campaigns, logistics, and
inventory for the products his customers are selling? He downloaded monthly rainfall data
from Jan 1980 to Dec 2019 for this analysis.
Download the folder “TMA01 rainfall data.zip” from Canvas L01> Modules > Assessments.
Create the necessary variables to separate year and month and import the CSV datafile using
PSPP/SPSS. Properly name each the variable that you have in the datafile, and define the
necessary value labels using the metadata file provided.
Capture screenshots of the Data View and Variable View of your datafile and paste them on
your assignment.
Question 1 (35 marks)
a) Apply the necessary transformation in PSPP/SPSS using the relevant variables from the
datafile to create two new variables, 1) Number of Days in the Month and 2) Decade. Identify
the appropriate scale of measurement for both variables, and generate the frequency
distribution tables for both variables. Cut and paste the PSPP/SPSS outputs into your answer.
Note: For Number of Days in the Month, please remember to take into account leap years.
Note: For Decade, please use the 0-to-9 decade denomination to group the years.
Paraphrase This Document
Need a fresh take? Get an instant paraphrase of this document with our AI Paraphraser
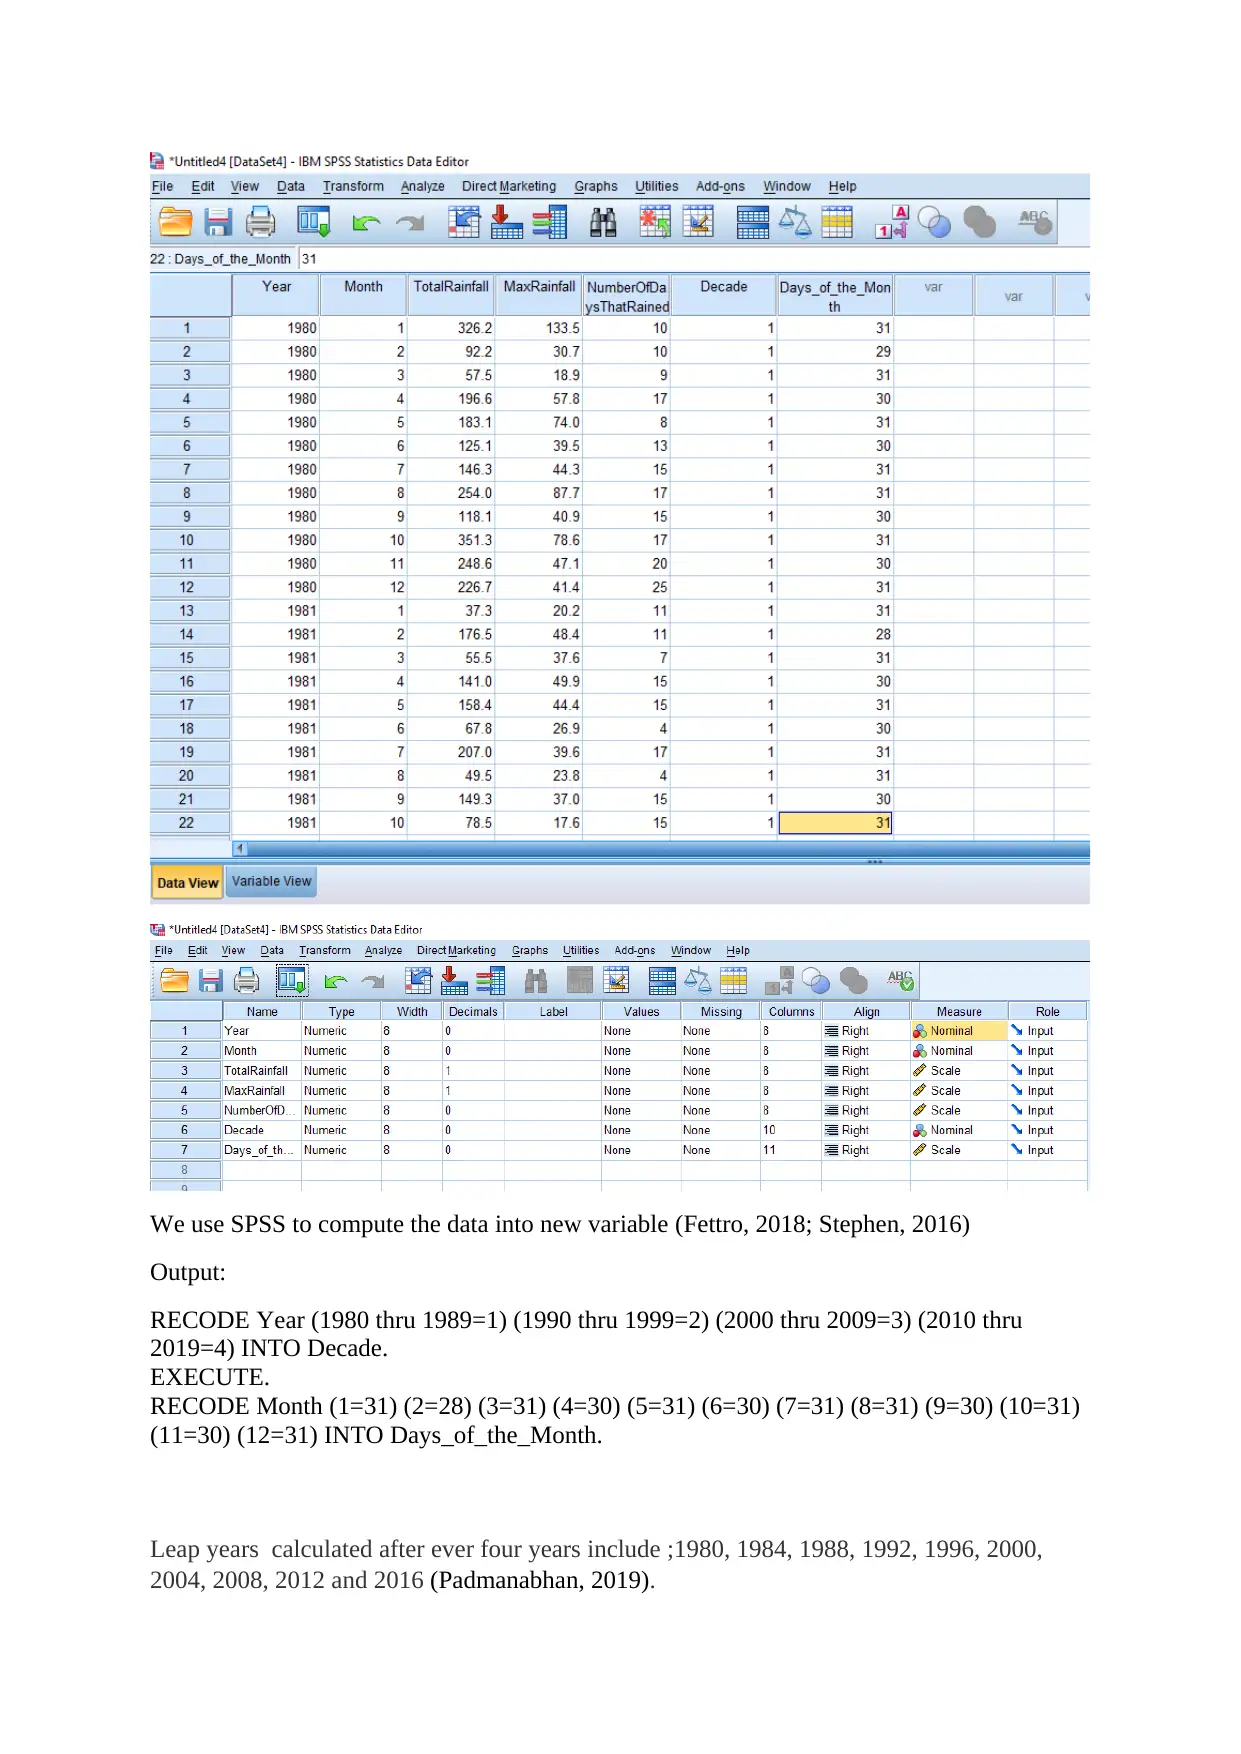
We use SPSS to compute the data into new variable (Fettro, 2018; Stephen, 2016)
Output:
RECODE Year (1980 thru 1989=1) (1990 thru 1999=2) (2000 thru 2009=3) (2010 thru
2019=4) INTO Decade.
EXECUTE.
RECODE Month (1=31) (2=28) (3=31) (4=30) (5=31) (6=30) (7=31) (8=31) (9=30) (10=31)
(11=30) (12=31) INTO Days_of_the_Month.
Leap years calculated after ever four years include ;1980, 1984, 1988, 1992, 1996, 2000,
2004, 2008, 2012 and 2016 (Padmanabhan, 2019).
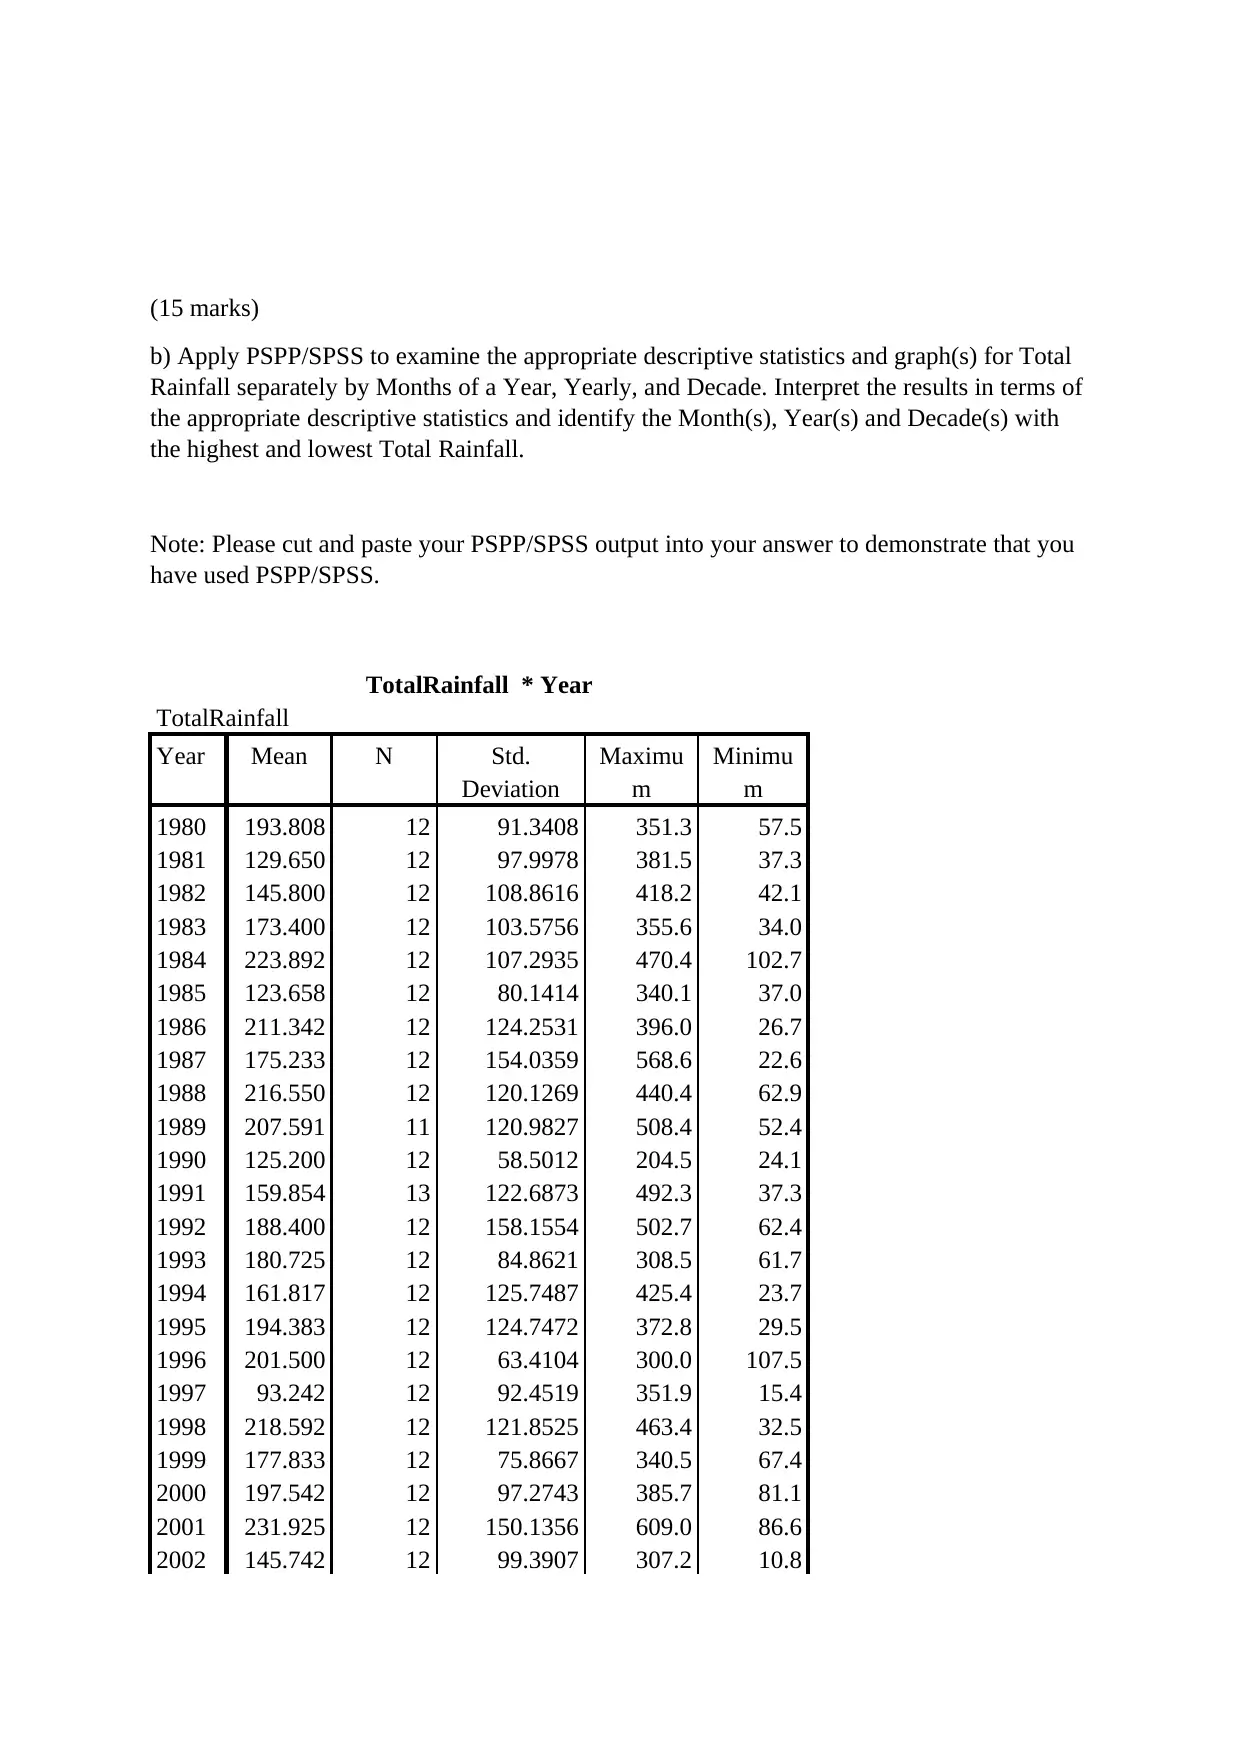
(15 marks)
b) Apply PSPP/SPSS to examine the appropriate descriptive statistics and graph(s) for Total
Rainfall separately by Months of a Year, Yearly, and Decade. Interpret the results in terms of
the appropriate descriptive statistics and identify the Month(s), Year(s) and Decade(s) with
the highest and lowest Total Rainfall.
Note: Please cut and paste your PSPP/SPSS output into your answer to demonstrate that you
have used PSPP/SPSS.
TotalRainfall * Year
TotalRainfall
Year Mean N Std.
Deviation
Maximu
m
Minimu
m
1980 193.808 12 91.3408 351.3 57.5
1981 129.650 12 97.9978 381.5 37.3
1982 145.800 12 108.8616 418.2 42.1
1983 173.400 12 103.5756 355.6 34.0
1984 223.892 12 107.2935 470.4 102.7
1985 123.658 12 80.1414 340.1 37.0
1986 211.342 12 124.2531 396.0 26.7
1987 175.233 12 154.0359 568.6 22.6
1988 216.550 12 120.1269 440.4 62.9
1989 207.591 11 120.9827 508.4 52.4
1990 125.200 12 58.5012 204.5 24.1
1991 159.854 13 122.6873 492.3 37.3
1992 188.400 12 158.1554 502.7 62.4
1993 180.725 12 84.8621 308.5 61.7
1994 161.817 12 125.7487 425.4 23.7
1995 194.383 12 124.7472 372.8 29.5
1996 201.500 12 63.4104 300.0 107.5
1997 93.242 12 92.4519 351.9 15.4
1998 218.592 12 121.8525 463.4 32.5
1999 177.833 12 75.8667 340.5 67.4
2000 197.542 12 97.2743 385.7 81.1
2001 231.925 12 150.1356 609.0 86.6
2002 145.742 12 99.3907 307.2 10.8
⊘ This is a preview!⊘
Do you want full access?
Subscribe today to unlock all pages.
Trusted by 1+ million students worldwide
2003 199.267 12 110.3674 444.2 50.3
2004 178.033 12 145.9483 600.9 31.9
2005 160.892 12 116.4661 362.9 8.4
2006 229.433 12 197.5286 765.9 83.1
2007 240.517 12 126.1310 468.6 105.5
2008 193.758 12 91.0411 327.3 87.2
2009 157.373 11 77.4860 281.8 21.8
2010 174.223 13 80.5821 298.5 6.3
2011 210.350 12 138.0207 513.2 23.0
2012 179.992 12 103.0773 363.4 53.0
2013 229.033 12 94.0858 395.2 85.8
2014 117.527 11 74.5507 250.8 .2
2015 116.338 13 79.9354 302.0 18.8
2016 162.975 12 78.9647 292.6 6.2
2017 170.467 12 84.3474 371.2 79.6
2018 142.350 12 77.2378 287.0 14.8
2019 113.958 12 116.2083 421.5 11.8
Total 176.287 480 112.3021 765.9 .2
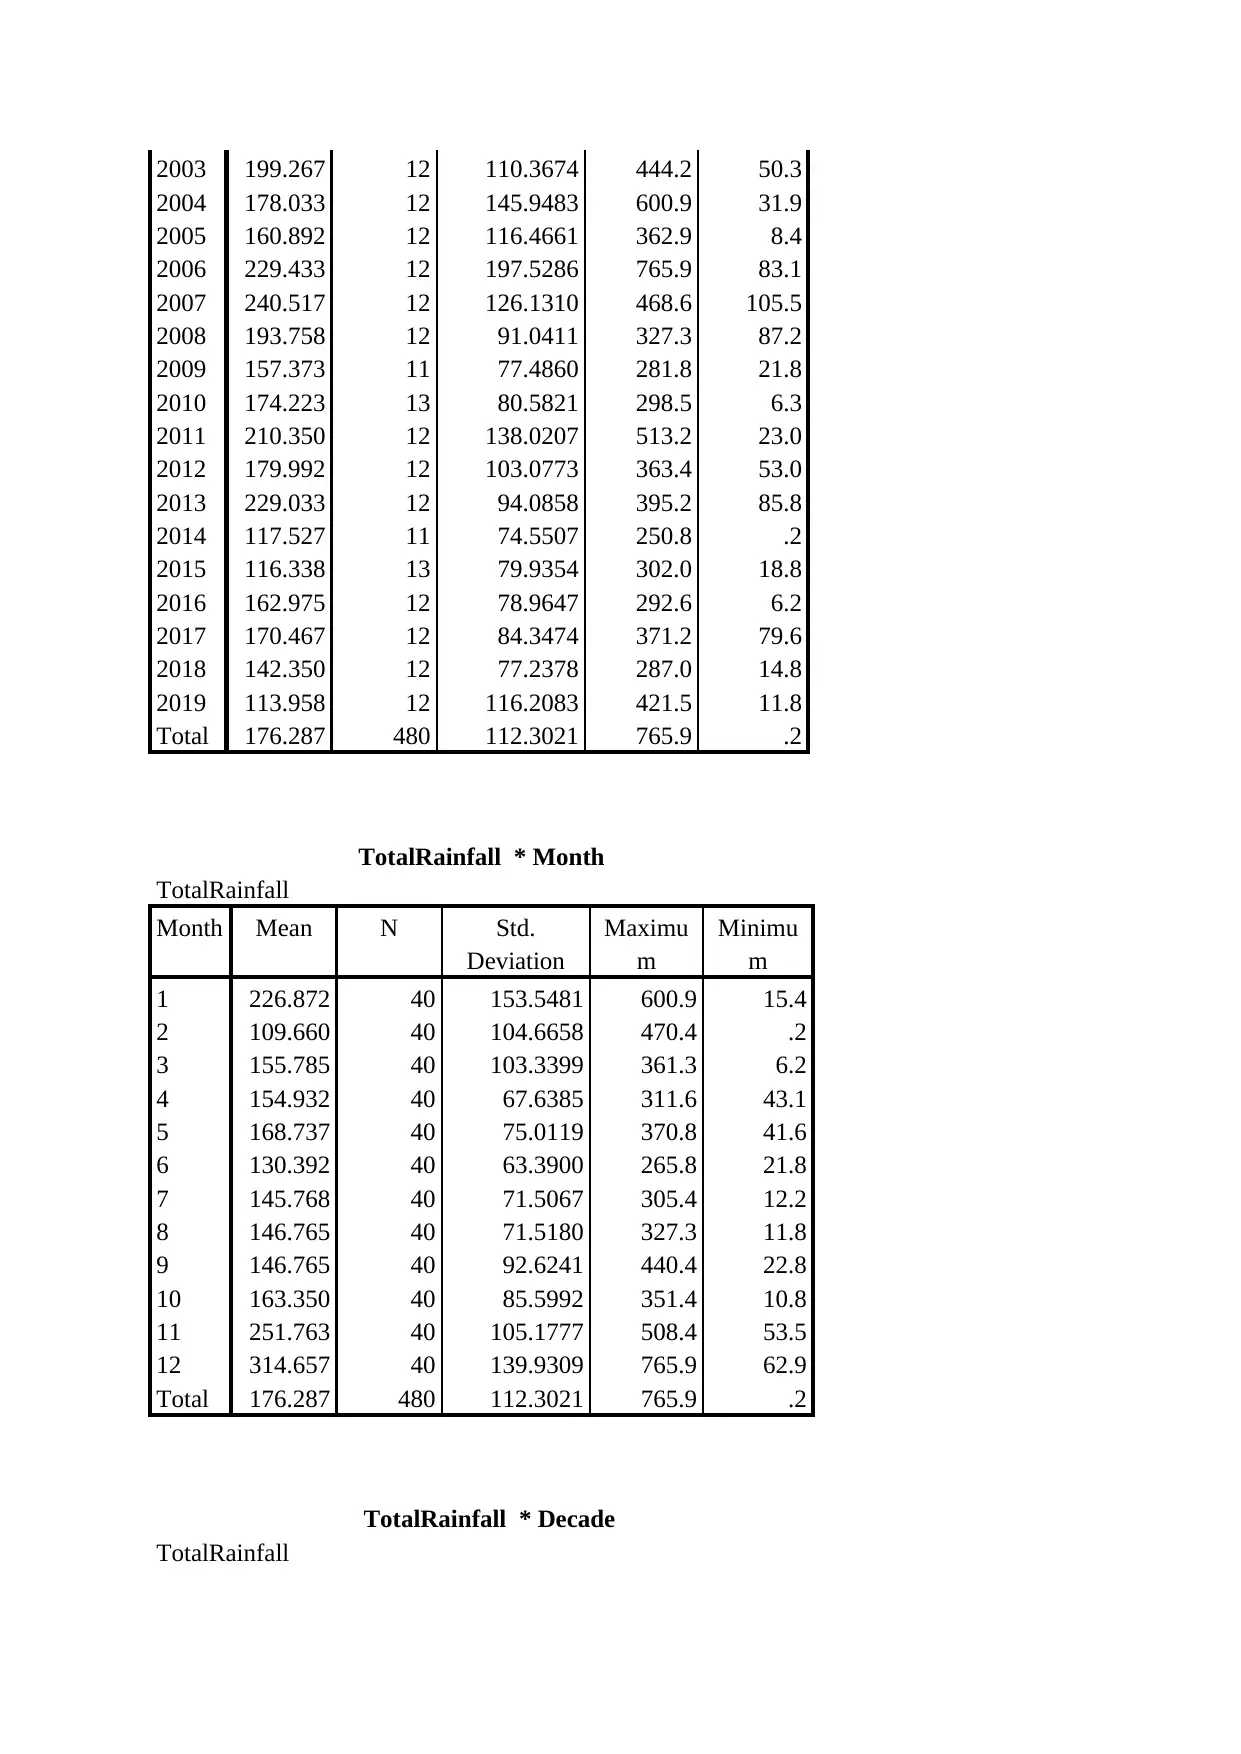
TotalRainfall * Month
TotalRainfall
Month Mean N Std.
Deviation
Maximu
m
Minimu
m
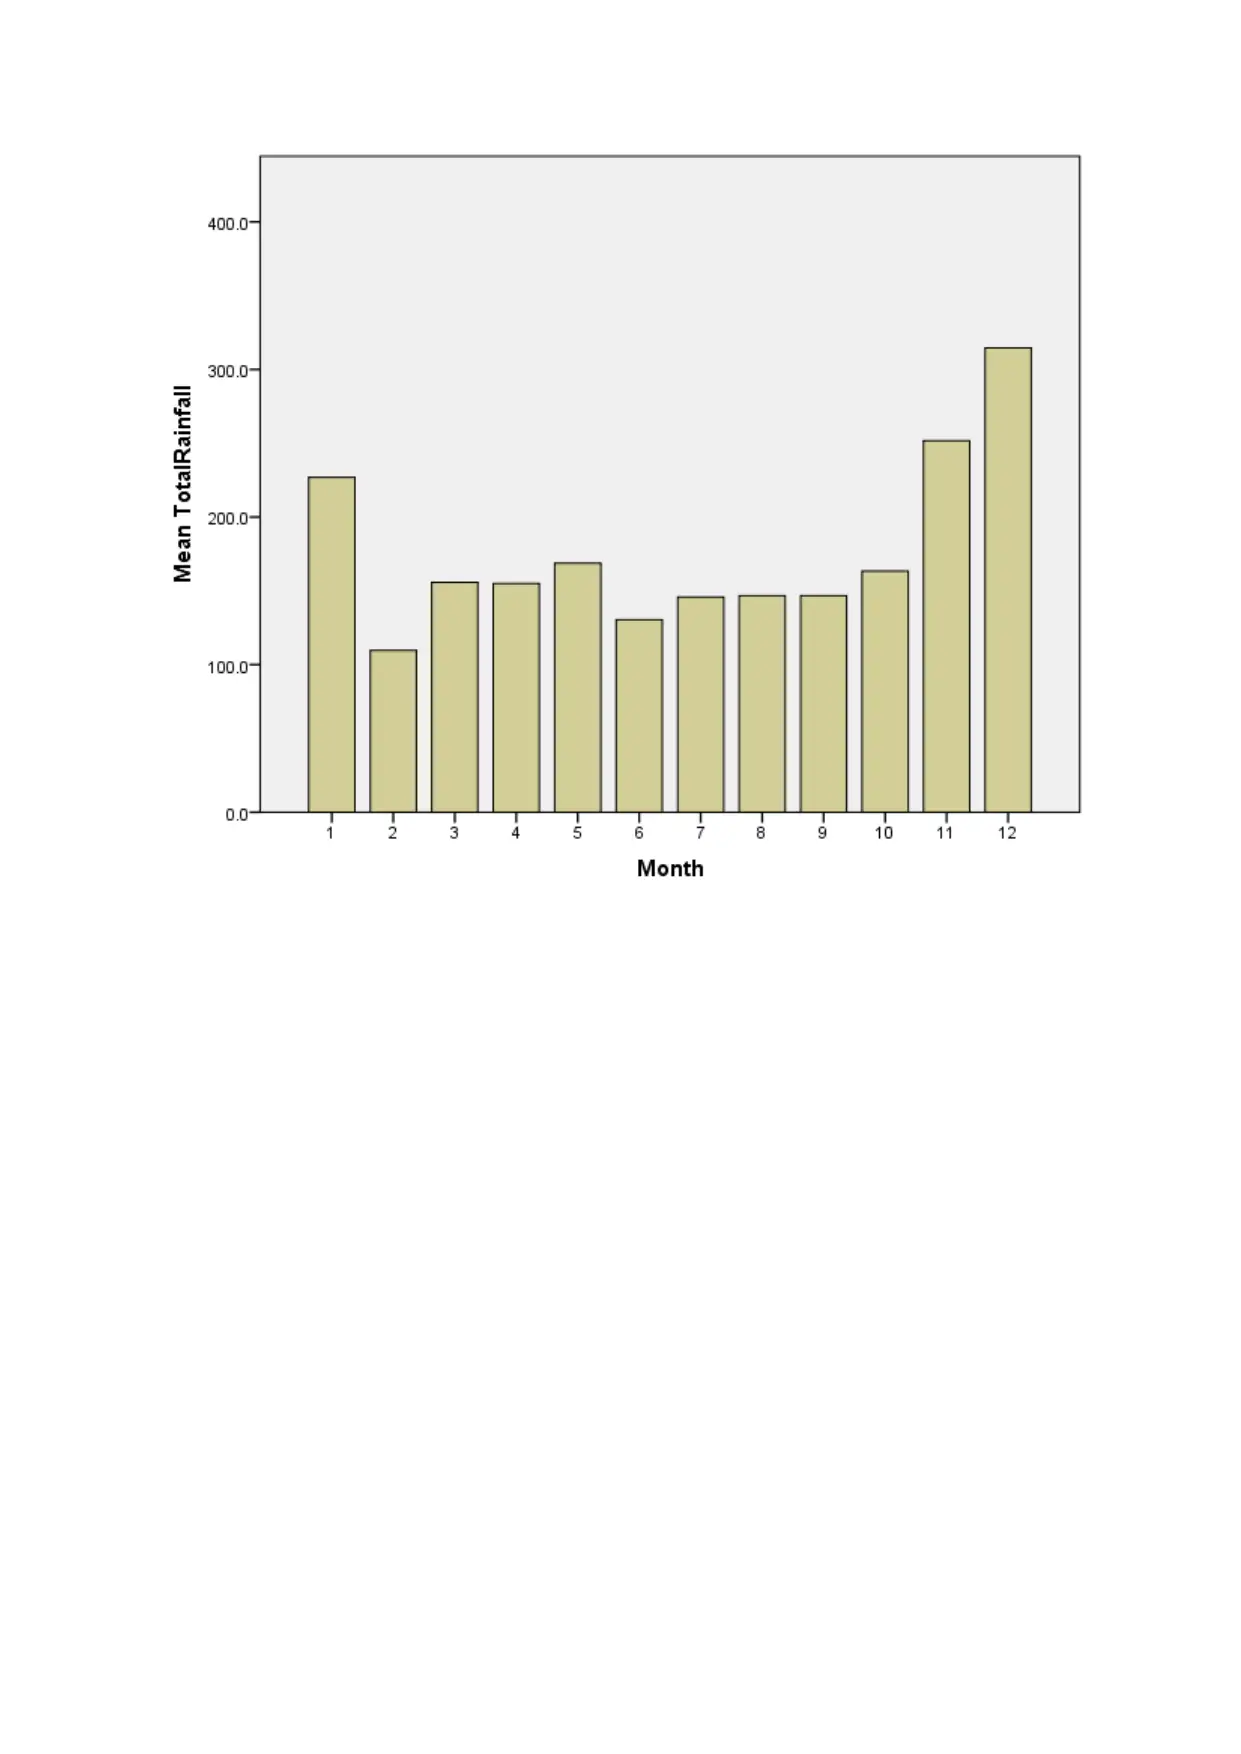
1 226.872 40 153.5481 600.9 15.4
2 109.660 40 104.6658 470.4 .2
3 155.785 40 103.3399 361.3 6.2
4 154.932 40 67.6385 311.6 43.1
5 168.737 40 75.0119 370.8 41.6
6 130.392 40 63.3900 265.8 21.8
7 145.768 40 71.5067 305.4 12.2
8 146.765 40 71.5180 327.3 11.8
9 146.765 40 92.6241 440.4 22.8
10 163.350 40 85.5992 351.4 10.8
11 251.763 40 105.1777 508.4 53.5
12 314.657 40 139.9309 765.9 62.9
Total 176.287 480 112.3021 765.9 .2
TotalRainfall * Decade
TotalRainfall
2004 178.033 12 145.9483 600.9 31.9
2005 160.892 12 116.4661 362.9 8.4
2006 229.433 12 197.5286 765.9 83.1
2007 240.517 12 126.1310 468.6 105.5
2008 193.758 12 91.0411 327.3 87.2
2009 157.373 11 77.4860 281.8 21.8
2010 174.223 13 80.5821 298.5 6.3
2011 210.350 12 138.0207 513.2 23.0
2012 179.992 12 103.0773 363.4 53.0
2013 229.033 12 94.0858 395.2 85.8
2014 117.527 11 74.5507 250.8 .2
2015 116.338 13 79.9354 302.0 18.8
2016 162.975 12 78.9647 292.6 6.2
2017 170.467 12 84.3474 371.2 79.6
2018 142.350 12 77.2378 287.0 14.8
2019 113.958 12 116.2083 421.5 11.8
Total 176.287 480 112.3021 765.9 .2
TotalRainfall * Month
TotalRainfall
Month Mean N Std.
Deviation
Maximu
m
Minimu
m
1 226.872 40 153.5481 600.9 15.4
2 109.660 40 104.6658 470.4 .2
3 155.785 40 103.3399 361.3 6.2
4 154.932 40 67.6385 311.6 43.1
5 168.737 40 75.0119 370.8 41.6
6 130.392 40 63.3900 265.8 21.8
7 145.768 40 71.5067 305.4 12.2
8 146.765 40 71.5180 327.3 11.8
9 146.765 40 92.6241 440.4 22.8
10 163.350 40 85.5992 351.4 10.8
11 251.763 40 105.1777 508.4 53.5
12 314.657 40 139.9309 765.9 62.9
Total 176.287 480 112.3021 765.9 .2
TotalRainfall * Decade
TotalRainfall
Paraphrase This Document
Need a fresh take? Get an instant paraphrase of this document with our AI Paraphraser
Decade Mean N Std.
Deviation
Maximu
m
Minimu
m
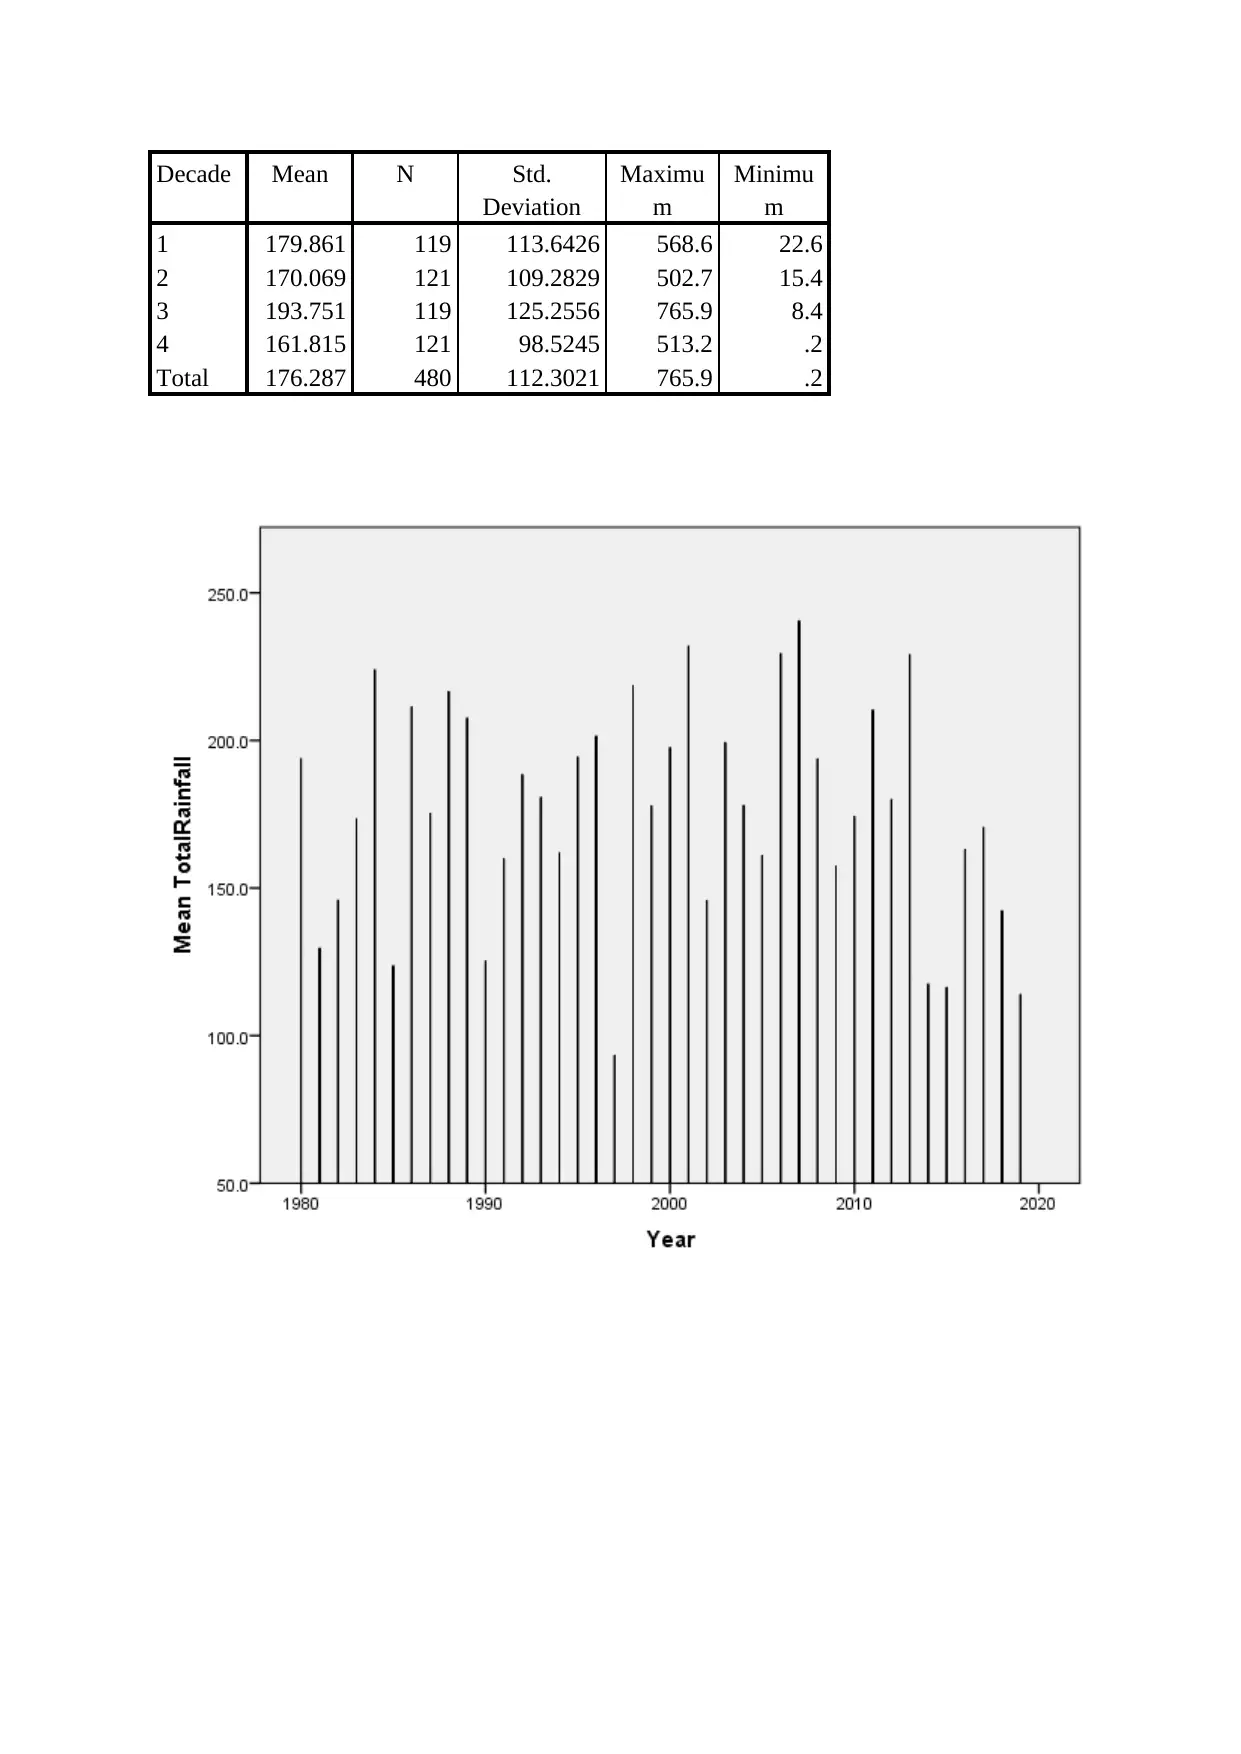
1 179.861 119 113.6426 568.6 22.6
2 170.069 121 109.2829 502.7 15.4
3 193.751 119 125.2556 765.9 8.4
4 161.815 121 98.5245 513.2 .2
Total 176.287 480 112.3021 765.9 .2
Deviation
Maximu
m
Minimu
m
1 179.861 119 113.6426 568.6 22.6
2 170.069 121 109.2829 502.7 15.4
3 193.751 119 125.2556 765.9 8.4
4 161.815 121 98.5245 513.2 .2
Total 176.287 480 112.3021 765.9 .2
⊘ This is a preview!⊘
Do you want full access?
Subscribe today to unlock all pages.
Trusted by 1+ million students worldwide
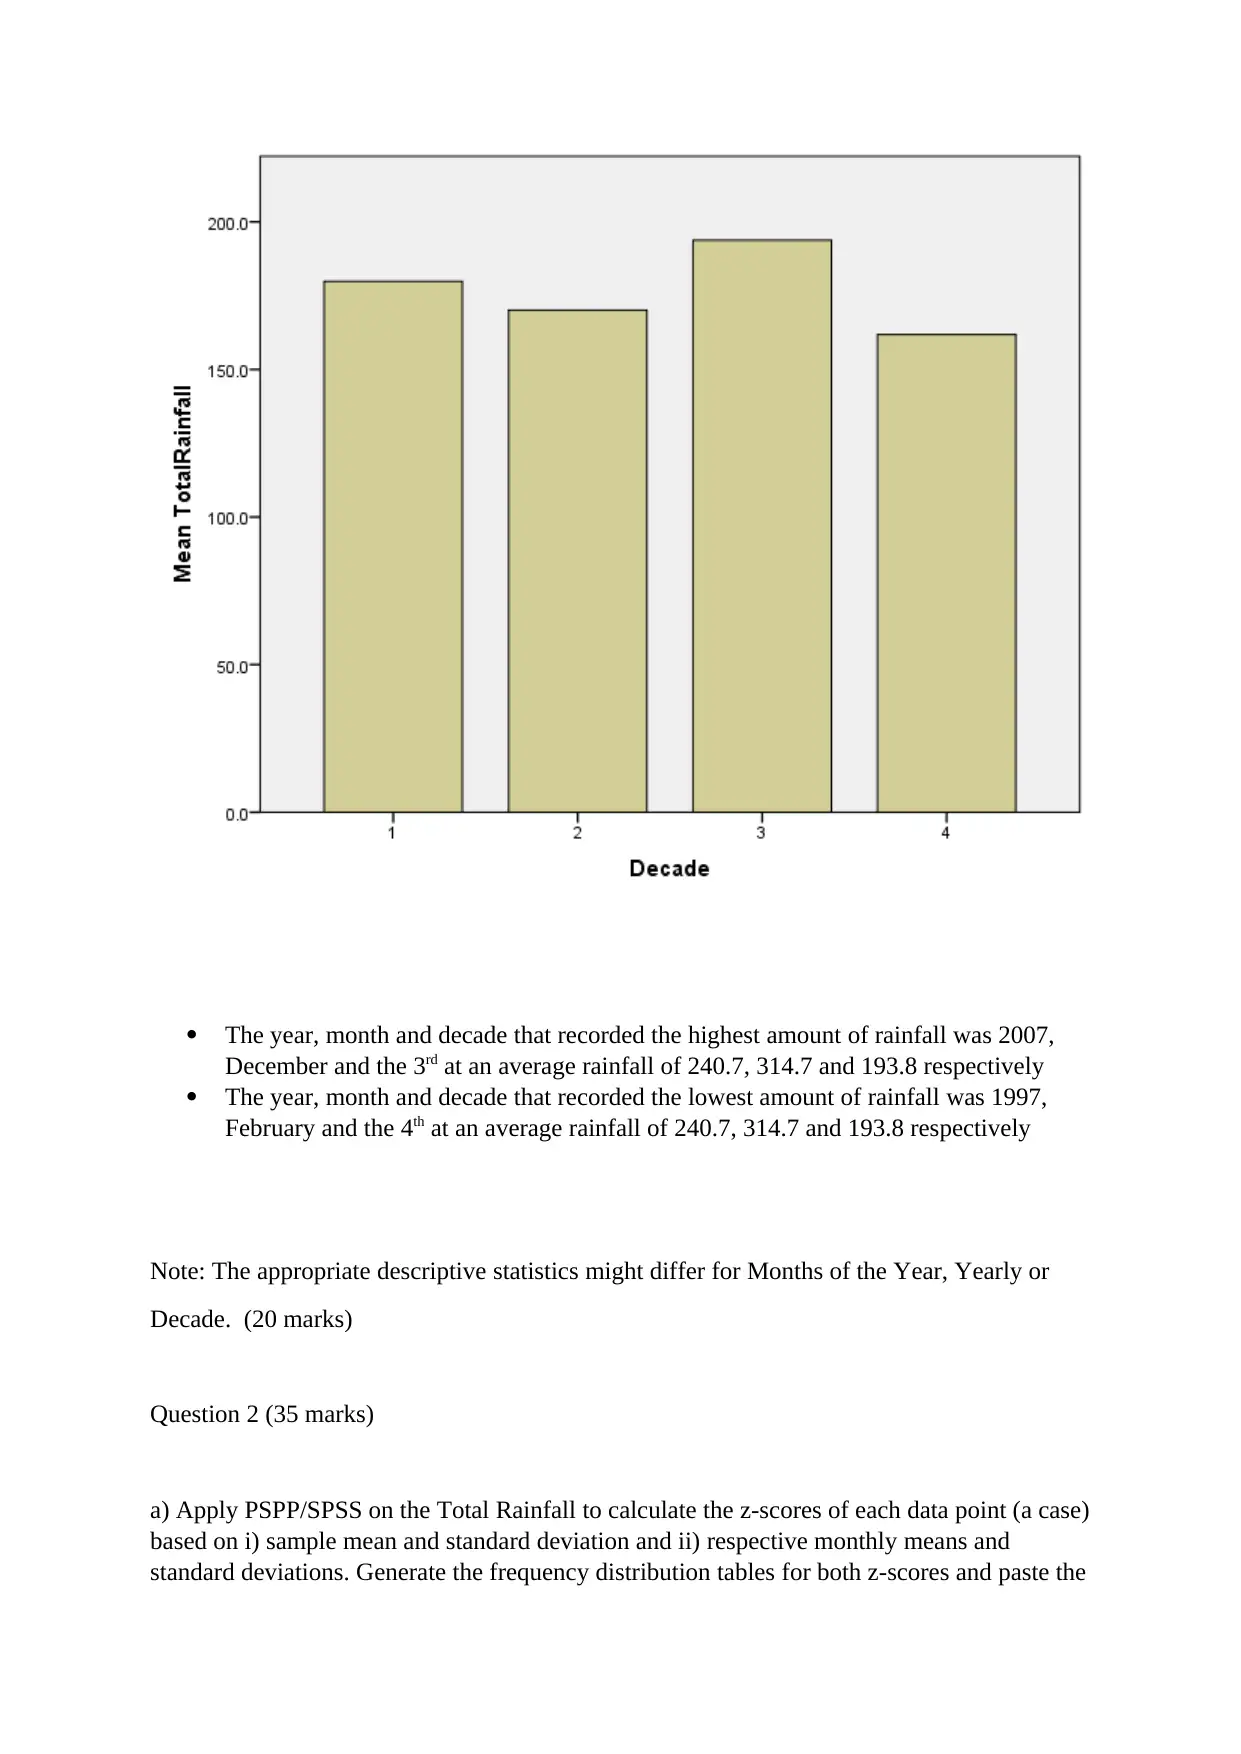
The year, month and decade that recorded the highest amount of rainfall was 2007,
December and the 3rd at an average rainfall of 240.7, 314.7 and 193.8 respectively
The year, month and decade that recorded the lowest amount of rainfall was 1997,
February and the 4th at an average rainfall of 240.7, 314.7 and 193.8 respectively
Note: The appropriate descriptive statistics might differ for Months of the Year, Yearly or
Decade. (20 marks)
Question 2 (35 marks)
a) Apply PSPP/SPSS on the Total Rainfall to calculate the z-scores of each data point (a case)
based on i) sample mean and standard deviation and ii) respective monthly means and
standard deviations. Generate the frequency distribution tables for both z-scores and paste the
Paraphrase This Document
Need a fresh take? Get an instant paraphrase of this document with our AI Paraphraser
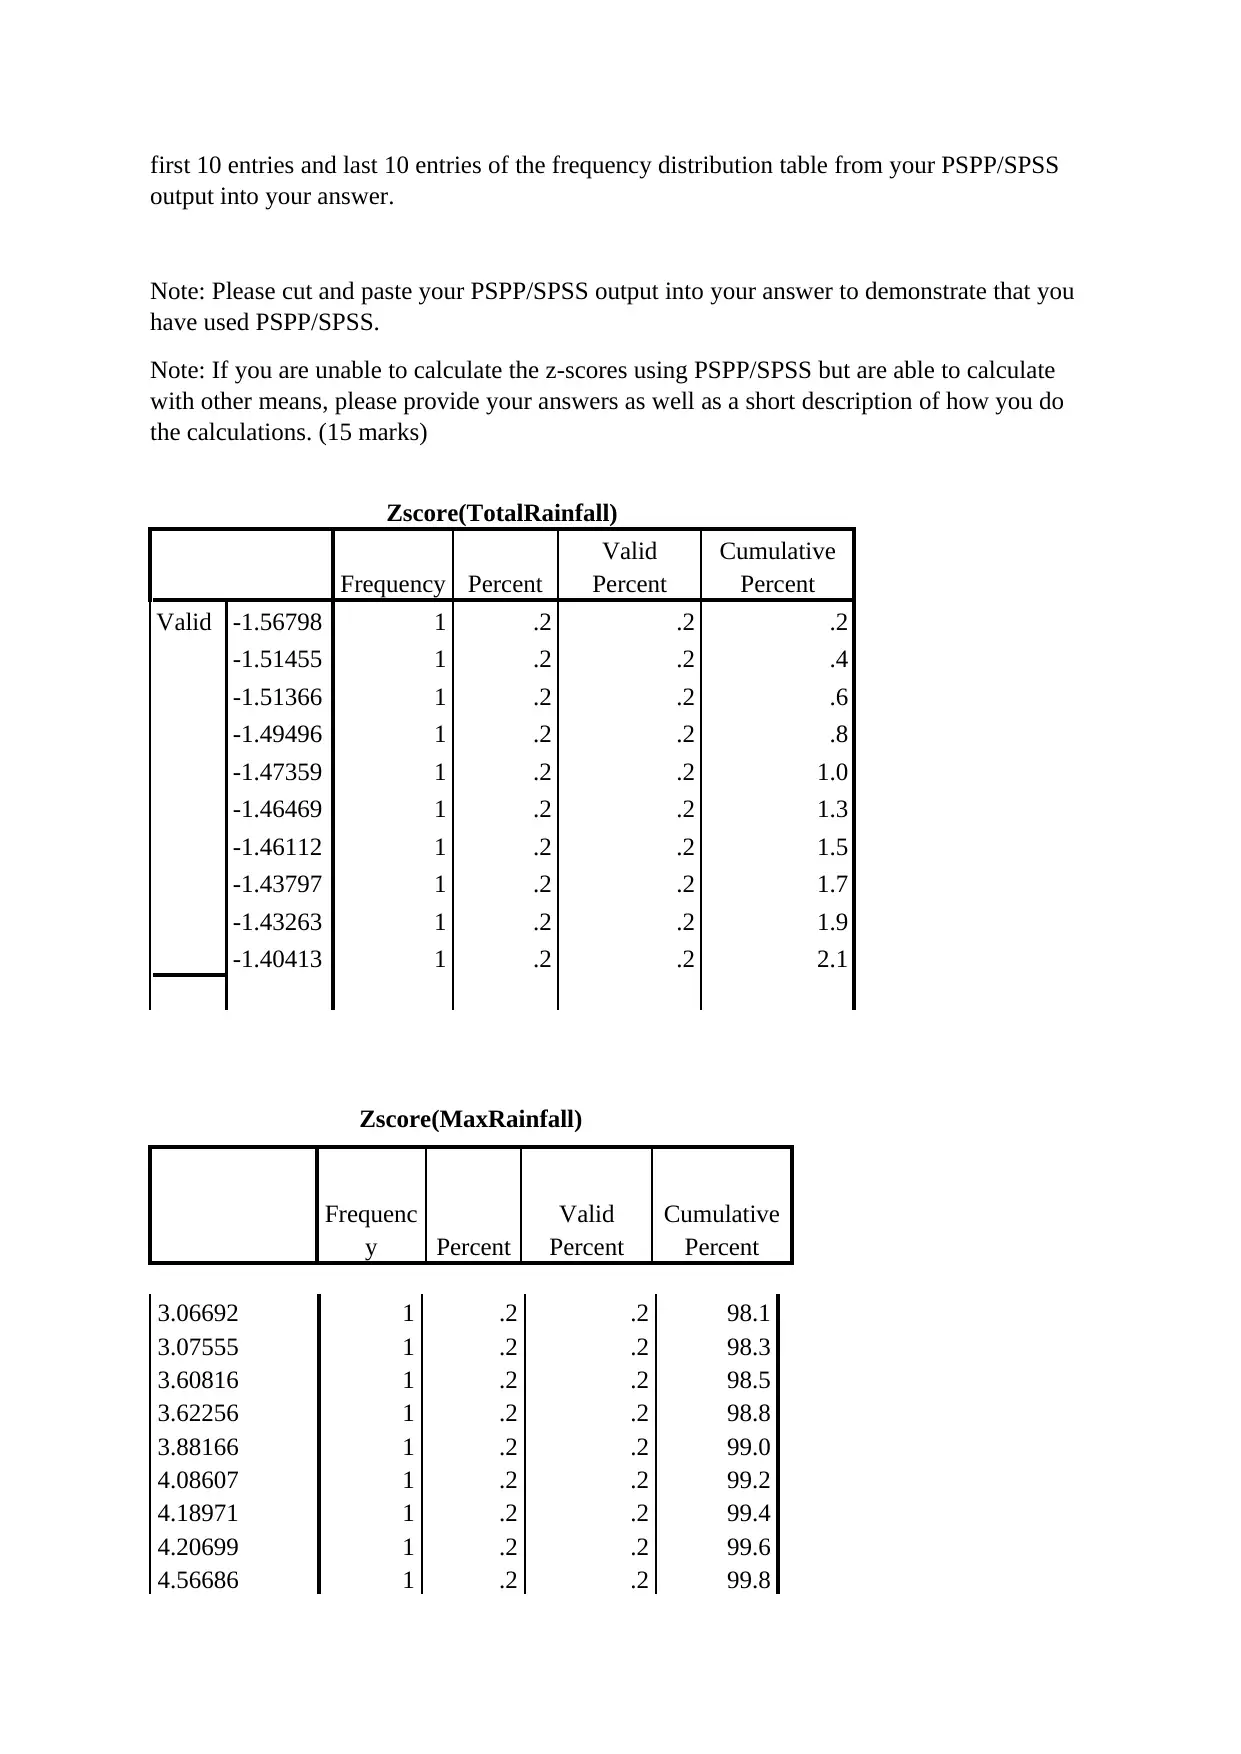
first 10 entries and last 10 entries of the frequency distribution table from your PSPP/SPSS
output into your answer.
Note: Please cut and paste your PSPP/SPSS output into your answer to demonstrate that you
have used PSPP/SPSS.
Note: If you are unable to calculate the z-scores using PSPP/SPSS but are able to calculate
with other means, please provide your answers as well as a short description of how you do
the calculations. (15 marks)
Zscore(TotalRainfall)
Frequency Percent
Valid
Percent
Cumulative
Percent
Valid -1.56798 1 .2 .2 .2
-1.51455 1 .2 .2 .4
-1.51366 1 .2 .2 .6
-1.49496 1 .2 .2 .8
-1.47359 1 .2 .2 1.0
-1.46469 1 .2 .2 1.3
-1.46112 1 .2 .2 1.5
-1.43797 1 .2 .2 1.7
-1.43263 1 .2 .2 1.9
-1.40413 1 .2 .2 2.1
Zscore(MaxRainfall)
Frequenc
y Percent
Valid
Percent
Cumulative
Percent
3.06692 1 .2 .2 98.1
3.07555 1 .2 .2 98.3
3.60816 1 .2 .2 98.5
3.62256 1 .2 .2 98.8
3.88166 1 .2 .2 99.0
4.08607 1 .2 .2 99.2
4.18971 1 .2 .2 99.4
4.20699 1 .2 .2 99.6
4.56686 1 .2 .2 99.8
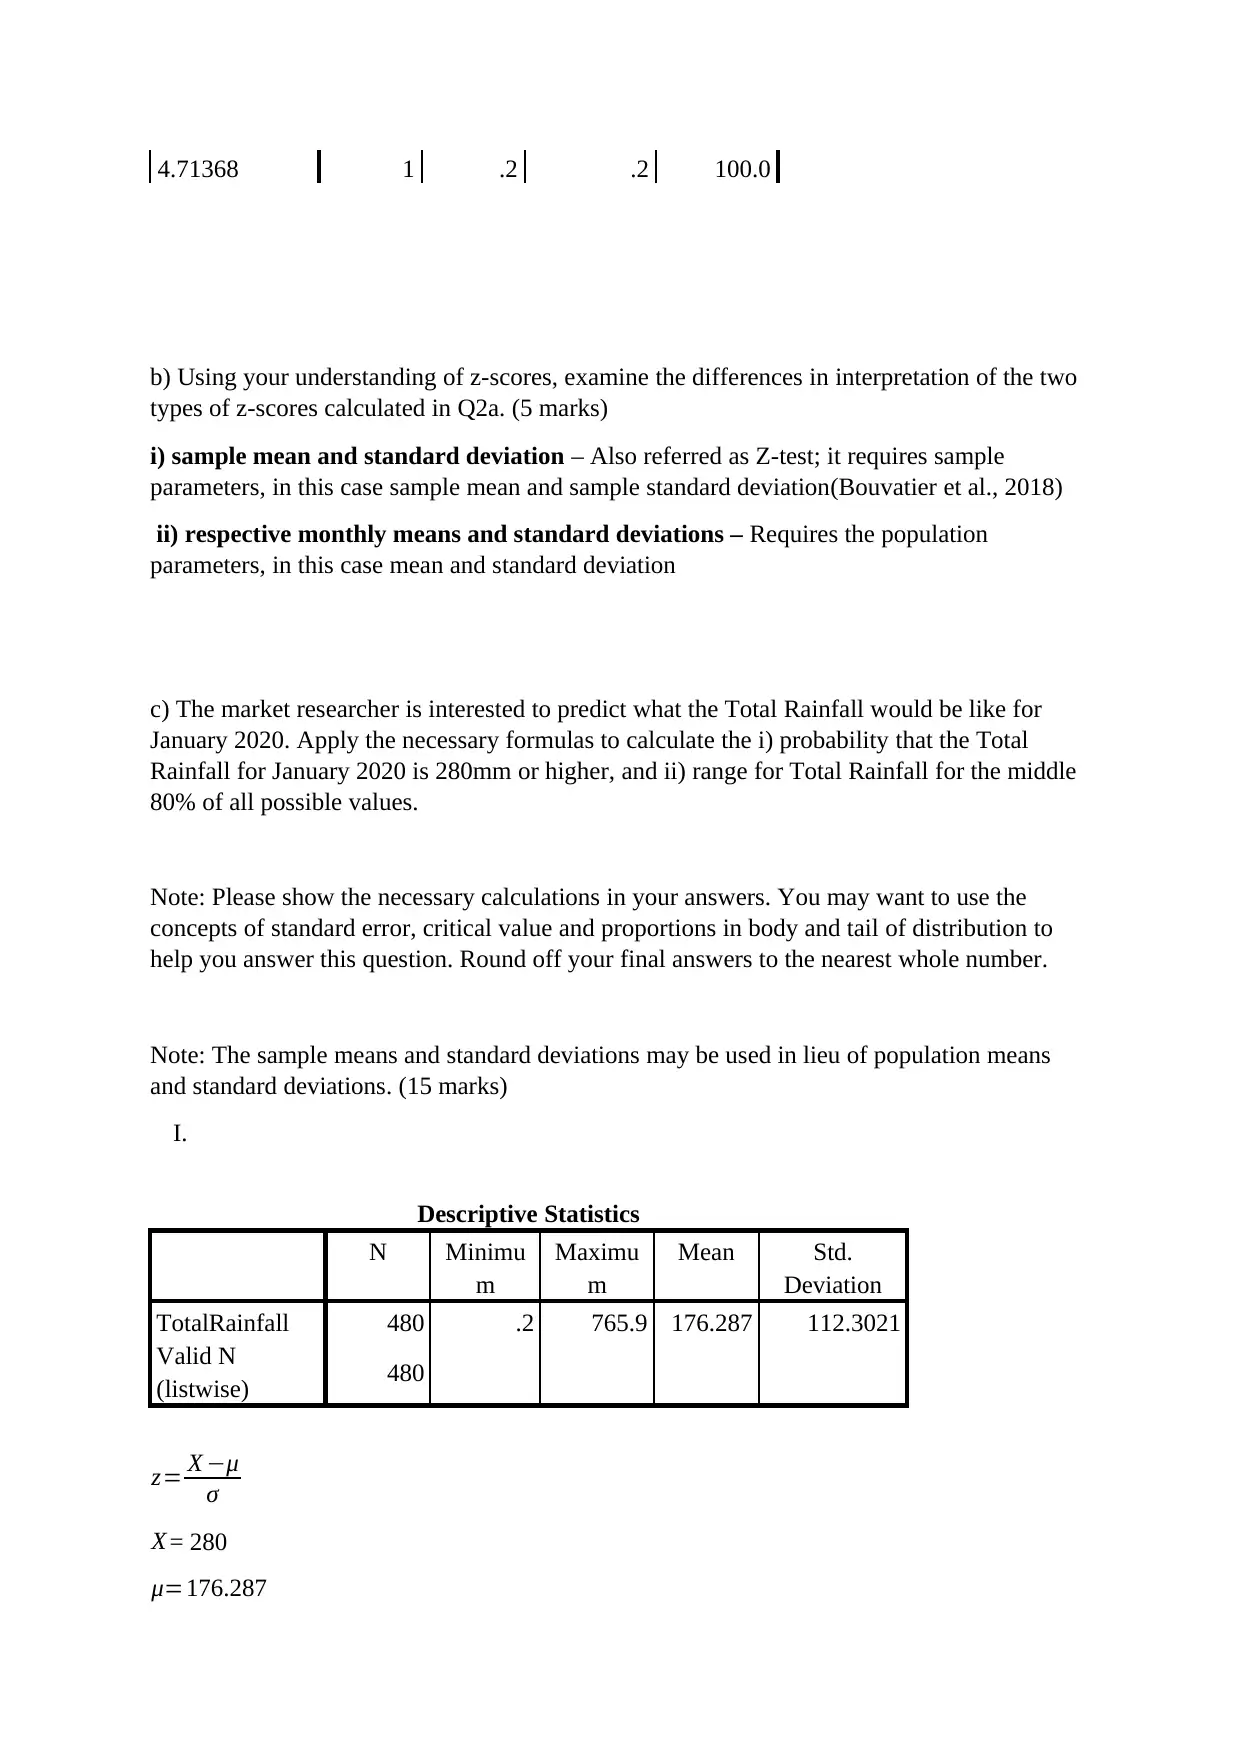
4.71368 1 .2 .2 100.0
b) Using your understanding of z-scores, examine the differences in interpretation of the two
types of z-scores calculated in Q2a. (5 marks)
i) sample mean and standard deviation – Also referred as Z-test; it requires sample
parameters, in this case sample mean and sample standard deviation(Bouvatier et al., 2018)
ii) respective monthly means and standard deviations – Requires the population
parameters, in this case mean and standard deviation
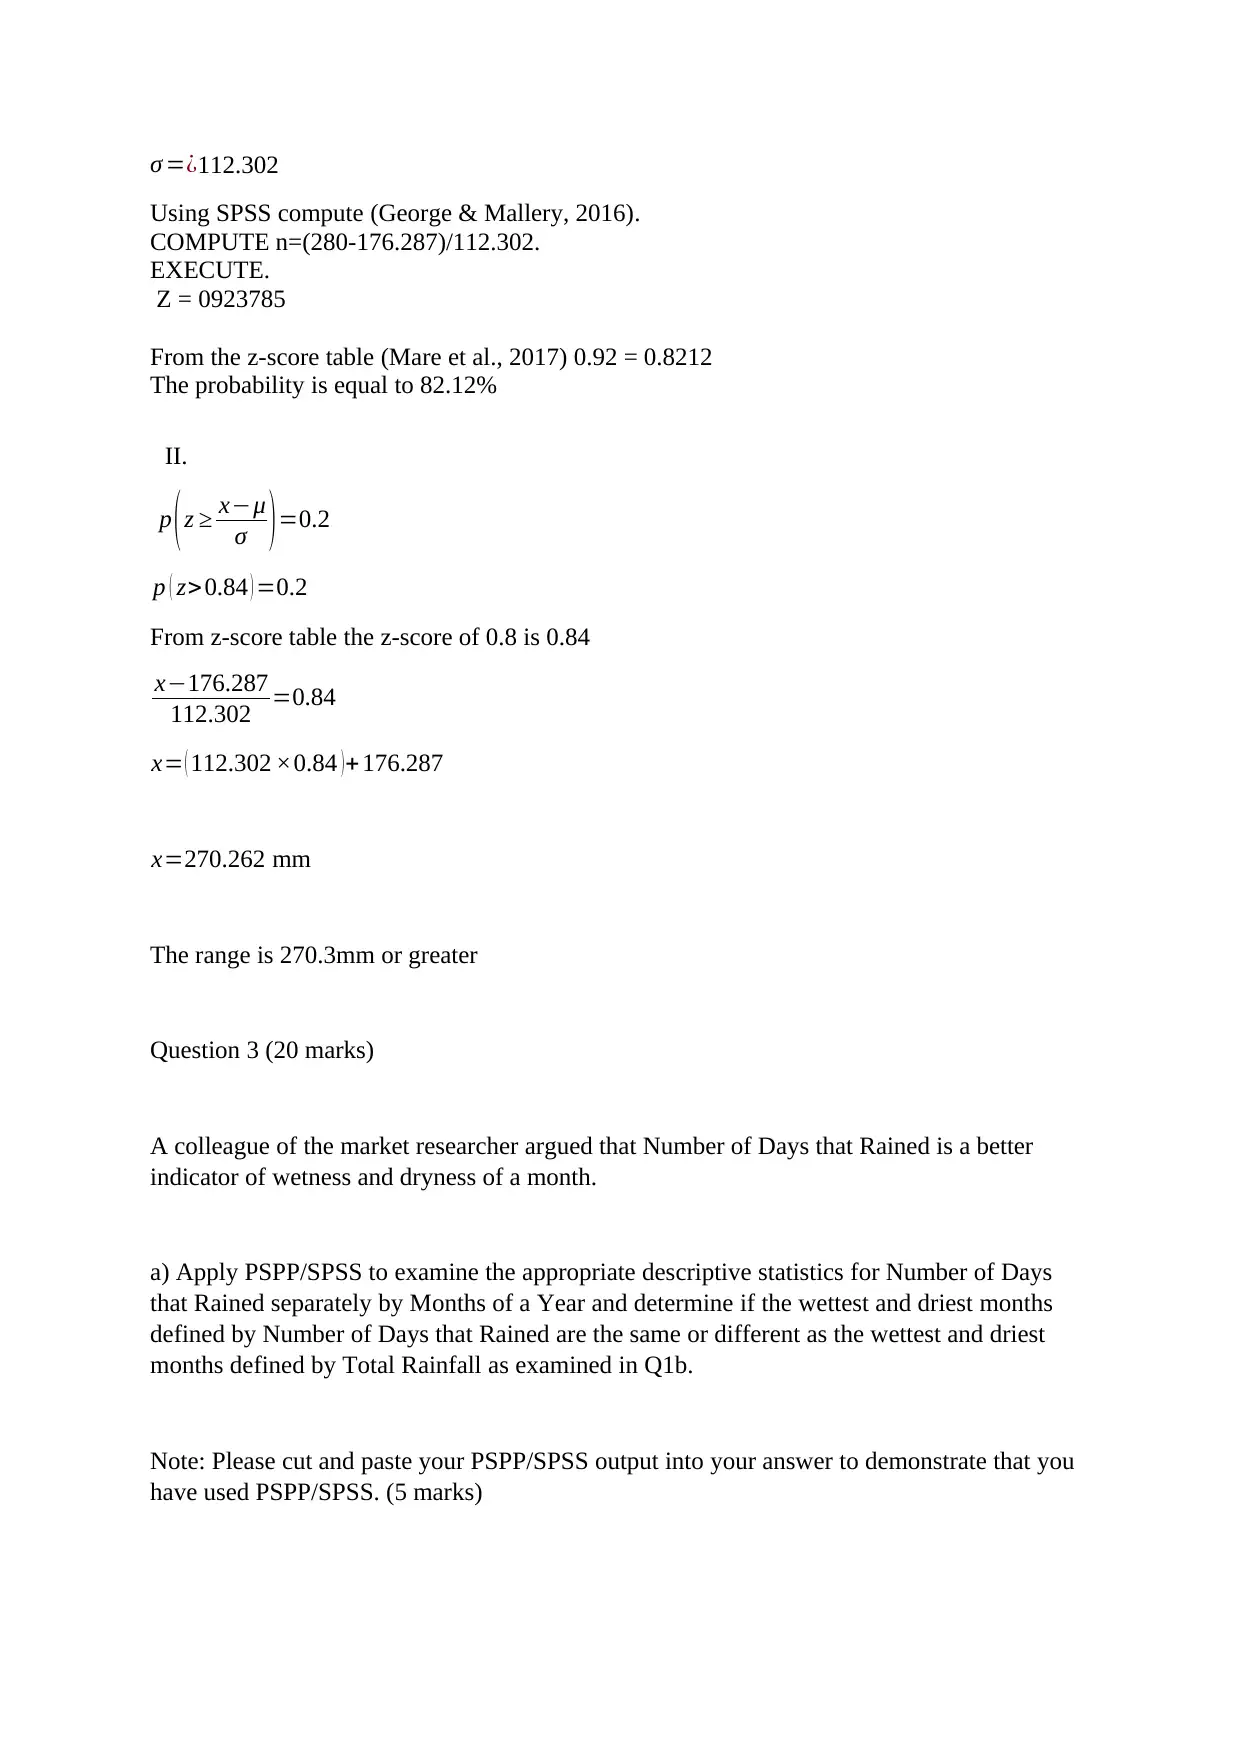
c) The market researcher is interested to predict what the Total Rainfall would be like for
January 2020. Apply the necessary formulas to calculate the i) probability that the Total
Rainfall for January 2020 is 280mm or higher, and ii) range for Total Rainfall for the middle
80% of all possible values.
Note: Please show the necessary calculations in your answers. You may want to use the
concepts of standard error, critical value and proportions in body and tail of distribution to
help you answer this question. Round off your final answers to the nearest whole number.
Note: The sample means and standard deviations may be used in lieu of population means
and standard deviations. (15 marks)
I.
Descriptive Statistics
N Minimu
m
Maximu
m
Mean Std.
Deviation
TotalRainfall 480 .2 765.9 176.287 112.3021
Valid N
(listwise) 480
z= X −μ
σ
X = 280
μ=176.287
b) Using your understanding of z-scores, examine the differences in interpretation of the two
types of z-scores calculated in Q2a. (5 marks)
i) sample mean and standard deviation – Also referred as Z-test; it requires sample
parameters, in this case sample mean and sample standard deviation(Bouvatier et al., 2018)
ii) respective monthly means and standard deviations – Requires the population
parameters, in this case mean and standard deviation
c) The market researcher is interested to predict what the Total Rainfall would be like for
January 2020. Apply the necessary formulas to calculate the i) probability that the Total
Rainfall for January 2020 is 280mm or higher, and ii) range for Total Rainfall for the middle
80% of all possible values.
Note: Please show the necessary calculations in your answers. You may want to use the
concepts of standard error, critical value and proportions in body and tail of distribution to
help you answer this question. Round off your final answers to the nearest whole number.
Note: The sample means and standard deviations may be used in lieu of population means
and standard deviations. (15 marks)
I.
Descriptive Statistics
N Minimu
m
Maximu
m
Mean Std.
Deviation
TotalRainfall 480 .2 765.9 176.287 112.3021
Valid N
(listwise) 480
z= X −μ
σ
X = 280
μ=176.287
⊘ This is a preview!⊘
Do you want full access?
Subscribe today to unlock all pages.
Trusted by 1+ million students worldwide
σ =¿112.302
Using SPSS compute (George & Mallery, 2016).
COMPUTE n=(280-176.287)/112.302.
EXECUTE.
Z = 0923785
From the z-score table (Mare et al., 2017) 0.92 = 0.8212
The probability is equal to 82.12%
II.
p ( z ≥ x−μ
σ ) =0.2
p ( z>0.84 ) =0.2
From z-score table the z-score of 0.8 is 0.84
x−176.287
112.302 =0.84
x= ( 112.302 ×0.84 )+ 176.287
x=270.262 mm
The range is 270.3mm or greater
Question 3 (20 marks)
A colleague of the market researcher argued that Number of Days that Rained is a better
indicator of wetness and dryness of a month.
a) Apply PSPP/SPSS to examine the appropriate descriptive statistics for Number of Days
that Rained separately by Months of a Year and determine if the wettest and driest months
defined by Number of Days that Rained are the same or different as the wettest and driest
months defined by Total Rainfall as examined in Q1b.
Note: Please cut and paste your PSPP/SPSS output into your answer to demonstrate that you
have used PSPP/SPSS. (5 marks)
Paraphrase This Document
Need a fresh take? Get an instant paraphrase of this document with our AI Paraphraser
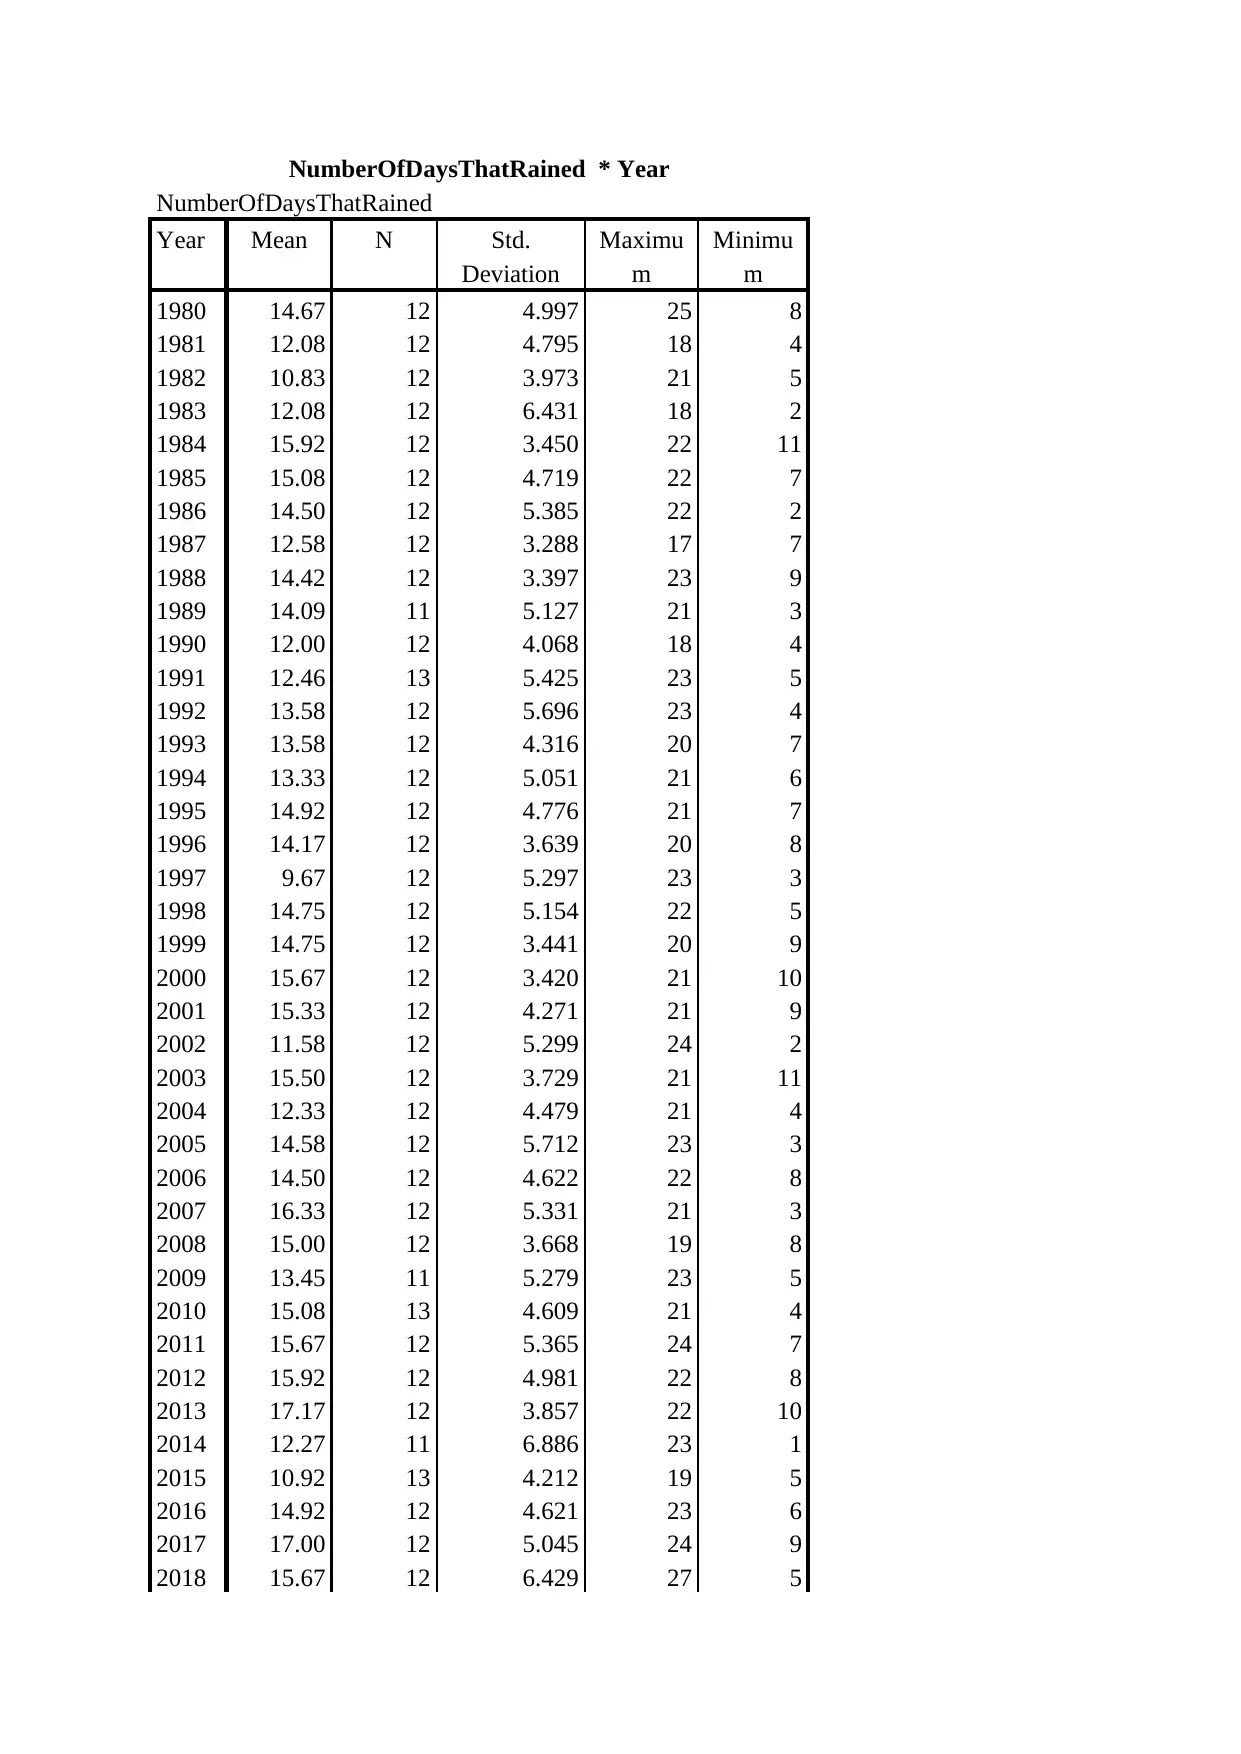
NumberOfDaysThatRained * Year
NumberOfDaysThatRained
Year Mean N Std.
Deviation
Maximu
m
Minimu
m
1980 14.67 12 4.997 25 8
1981 12.08 12 4.795 18 4
1982 10.83 12 3.973 21 5
1983 12.08 12 6.431 18 2
1984 15.92 12 3.450 22 11
1985 15.08 12 4.719 22 7
1986 14.50 12 5.385 22 2
1987 12.58 12 3.288 17 7
1988 14.42 12 3.397 23 9
1989 14.09 11 5.127 21 3
1990 12.00 12 4.068 18 4
1991 12.46 13 5.425 23 5
1992 13.58 12 5.696 23 4
1993 13.58 12 4.316 20 7
1994 13.33 12 5.051 21 6
1995 14.92 12 4.776 21 7
1996 14.17 12 3.639 20 8
1997 9.67 12 5.297 23 3
1998 14.75 12 5.154 22 5
1999 14.75 12 3.441 20 9
2000 15.67 12 3.420 21 10
2001 15.33 12 4.271 21 9
2002 11.58 12 5.299 24 2
2003 15.50 12 3.729 21 11
2004 12.33 12 4.479 21 4
2005 14.58 12 5.712 23 3
2006 14.50 12 4.622 22 8
2007 16.33 12 5.331 21 3
2008 15.00 12 3.668 19 8
2009 13.45 11 5.279 23 5
2010 15.08 13 4.609 21 4
2011 15.67 12 5.365 24 7
2012 15.92 12 4.981 22 8
2013 17.17 12 3.857 22 10
2014 12.27 11 6.886 23 1
2015 10.92 13 4.212 19 5
2016 14.92 12 4.621 23 6
2017 17.00 12 5.045 24 9
2018 15.67 12 6.429 27 5
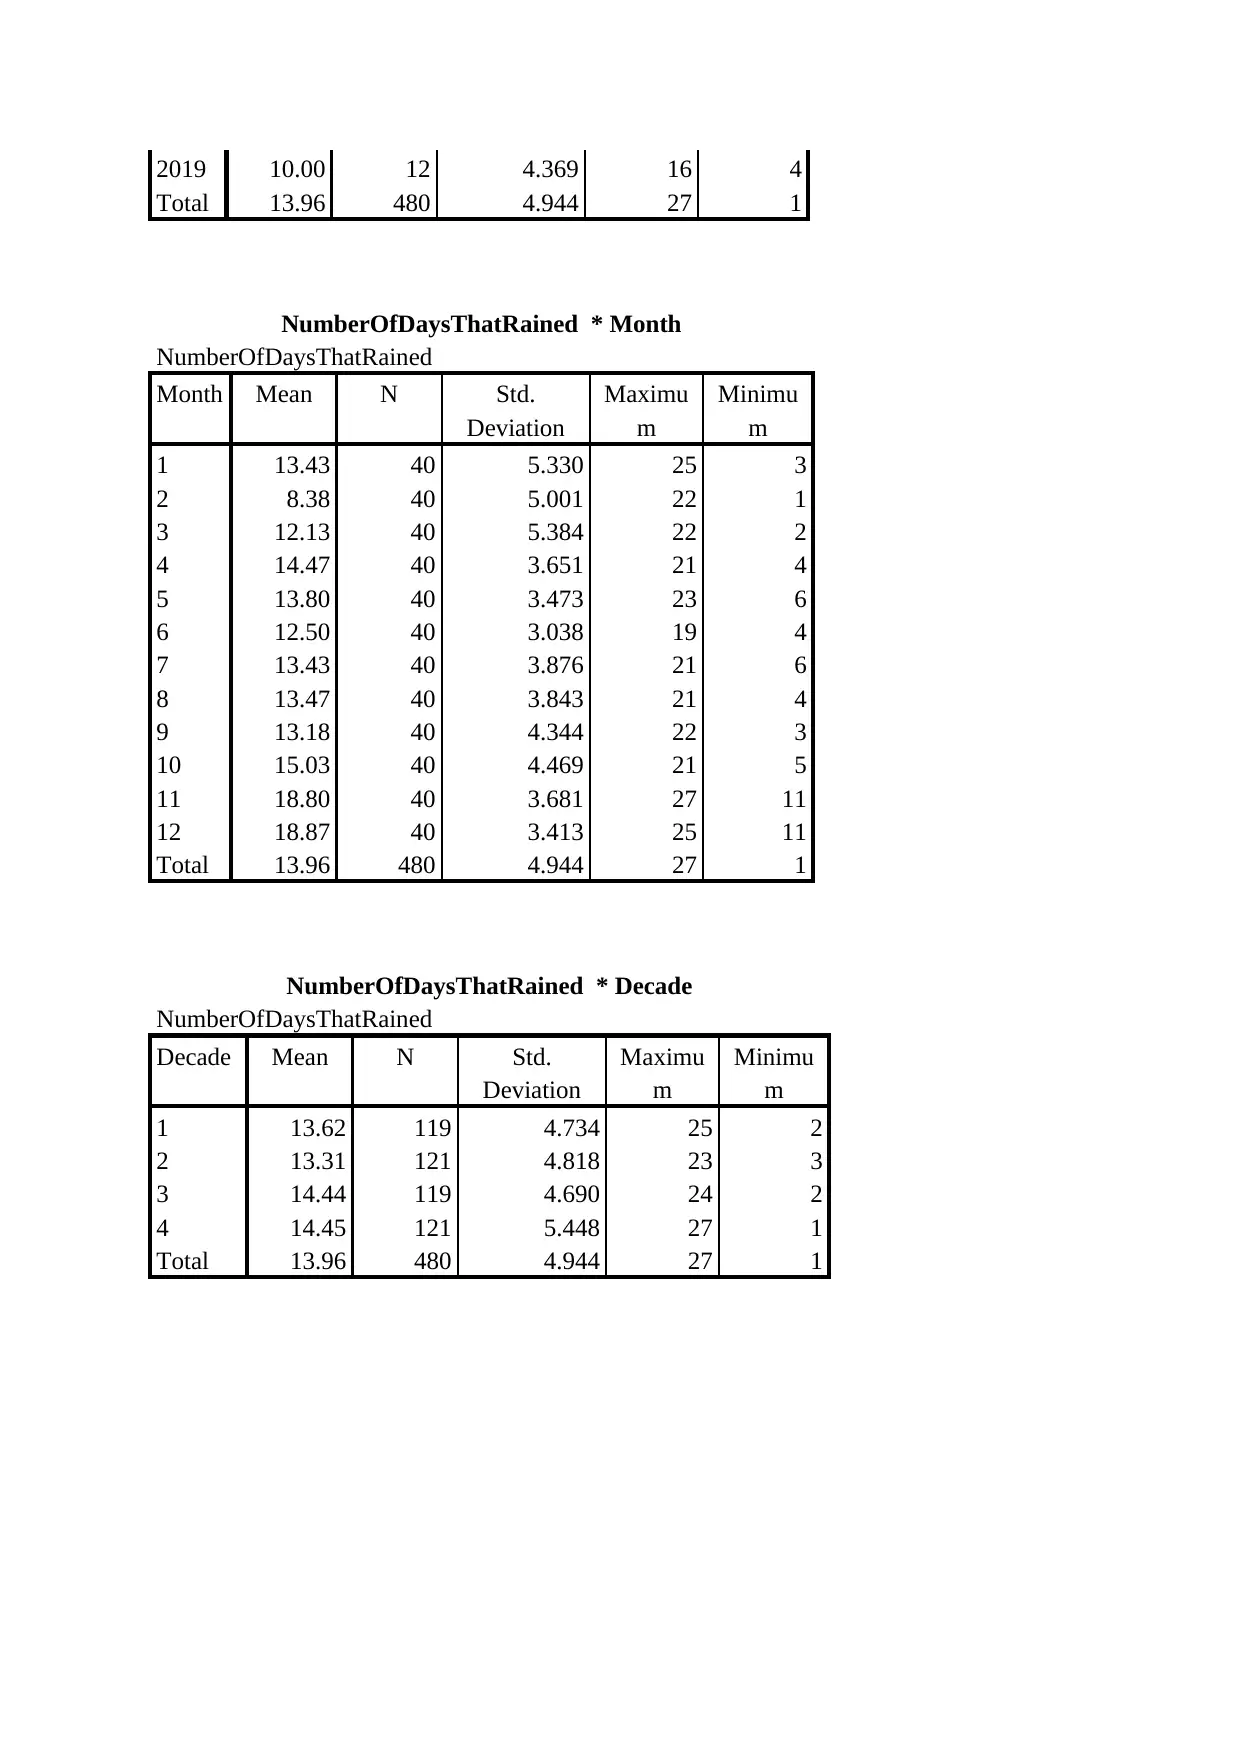
2019 10.00 12 4.369 16 4
Total 13.96 480 4.944 27 1
NumberOfDaysThatRained * Month
NumberOfDaysThatRained
Month Mean N Std.
Deviation
Maximu
m
Minimu
m
1 13.43 40 5.330 25 3
2 8.38 40 5.001 22 1
3 12.13 40 5.384 22 2
4 14.47 40 3.651 21 4
5 13.80 40 3.473 23 6
6 12.50 40 3.038 19 4
7 13.43 40 3.876 21 6
8 13.47 40 3.843 21 4
9 13.18 40 4.344 22 3
10 15.03 40 4.469 21 5
11 18.80 40 3.681 27 11
12 18.87 40 3.413 25 11
Total 13.96 480 4.944 27 1
NumberOfDaysThatRained * Decade
NumberOfDaysThatRained
Decade Mean N Std.
Deviation
Maximu
m
Minimu
m
1 13.62 119 4.734 25 2
2 13.31 121 4.818 23 3
3 14.44 119 4.690 24 2
4 14.45 121 5.448 27 1
Total 13.96 480 4.944 27 1
Total 13.96 480 4.944 27 1
NumberOfDaysThatRained * Month
NumberOfDaysThatRained
Month Mean N Std.
Deviation
Maximu
m
Minimu
m
1 13.43 40 5.330 25 3
2 8.38 40 5.001 22 1
3 12.13 40 5.384 22 2
4 14.47 40 3.651 21 4
5 13.80 40 3.473 23 6
6 12.50 40 3.038 19 4
7 13.43 40 3.876 21 6
8 13.47 40 3.843 21 4
9 13.18 40 4.344 22 3
10 15.03 40 4.469 21 5
11 18.80 40 3.681 27 11
12 18.87 40 3.413 25 11
Total 13.96 480 4.944 27 1
NumberOfDaysThatRained * Decade
NumberOfDaysThatRained
Decade Mean N Std.
Deviation
Maximu
m
Minimu
m
1 13.62 119 4.734 25 2
2 13.31 121 4.818 23 3
3 14.44 119 4.690 24 2
4 14.45 121 5.448 27 1
Total 13.96 480 4.944 27 1
⊘ This is a preview!⊘
Do you want full access?
Subscribe today to unlock all pages.
Trusted by 1+ million students worldwide
1 out of 18
Your All-in-One AI-Powered Toolkit for Academic Success.
+13062052269
info@desklib.com
Available 24*7 on WhatsApp / Email
![[object Object]](/_next/static/media/star-bottom.7253800d.svg)
Unlock your academic potential
Copyright © 2020–2026 A2Z Services. All Rights Reserved. Developed and managed by ZUCOL.