Comprehensive Pre-Calculus Midterm Exam: Functions and Solutions
VerifiedAdded on 2023/06/13
|11
|2025
|86
Quiz and Exam
AI Summary
This document features a solved Pre-Calculus midterm exam covering a range of topics including verifying trigonometric identities, calculating charges based on gas usage, determining wind chill factors, analyzing function behavior using the Leading Coefficient Test, creating scatter plots to model data, and solving compound interest problems. The exam also involves finding vertical asymptotes of rational functions, determining reference angles, and applying transformations to absolute value functions. Each problem provides step-by-step solutions, making it a valuable resource for students studying pre-calculus concepts and exam preparation. The document provides detailed solutions for each question, demonstrating the application of pre-calculus principles to solve mathematical problems.
Pre-Calculus Midterm Exam
1
Score: ______ / ______
Name: ____________________________
Student Number: ___________________
Short Answer: Type your answer below each question. Show your work.
1 Verify the identity. Show your work.
cot θ sec θ = csc θ∙
Taking the L.H.S
cot θ sec θ =∙ 𝐶𝑜𝑠 𝜃
𝑆𝑖𝑛 𝜃 × 1
𝐶𝑜𝑠 𝜃
= 1
𝑆𝑖𝑛 𝜃= csc θ (R.H.S)
2 A gas company has the following rate schedule for natural gas usage in single-family residences:
Monthly service charge $8.80
Per therm service charge
1st 25 therms $0.6686/therm
Over 25 therms $0.85870/therm
What is the charge for using 25 therms in one month? Show your work.
What is the charge for using 45 therms in one month? Show your work.
Construct a function that gives the monthly charge C for x therms of gas.
Solution - Total charge for using 25 therms in one month
= 8.8 + 25*0.6686=16.715+8.8 = 25.52
Total charge for using 45 therms in one month.
Paraphrase This Document
Need a fresh take? Get an instant paraphrase of this document with our AI Paraphraser
Pre-Calculus Midterm Exam
2
45 = 25 + 20 = Therms required
For first 25 therms the charge is .6686/therm, and rest of the 20 it is 0.85870/therm
8.8 + 25*.6686 + 20*.85870
25.52+17.174 = 42.694$
The function required
f(x) = 8.80 + 0.6686(x) for x<=25
and f(x) = f(x) = 8.80 + 0.6686(25) + 0.85870(x-25) for x>25
3 The wind chill factor represents the equivalent air temperature at a standard wind speed that
would produce the same heat loss as the given temperature and wind speed. One formula for
computing the equivalent temperature is
W(t) = {
𝑡
33 −(10.45+10√𝑣−𝑣)(33−𝑡)
2204
33 − 1.5958(33 − 𝑡)
if 0 ≤ v < 1.79
if 1.79 ≤ v < 20
if v ≥ 20
where v represents the wind speed (in meters per second) and t represents the air temperature .
Compute the wind chill for an air temperature of 15°C and a wind speed of 12 meters per second.
(Round the answer to one decimal place.) Show your work.
As v = 12, the middle formula seems to be one to be worked on
W(t) = 33 - (10.45+10√𝑣−𝑣)(33−𝑡)
2204
At t = 15
W(15) = 33 - (10.45+10√12−12)(33−15)
2204 = 33-0.286 = 32.7
4 Complete the following:
(a) Use the Leading Coefficient Test to determine the graph's end behavior.
(b) Find the x-intercepts. State whether the graph crosses the x-axis or touches the x-axis
and turns around at each intercept. Show your work.
(c) Find the y-intercept. Show your work.
f(x) = x2(x + 2)
Pre-Calculus Midterm Exam
3
(a).
As x goes to -inf, x^3 goes to -inf, so f(X) goes to -inf.
As x goes to +inf, x^3 goes to +inf, so f(X) goes to +inf
(b).
Solving, x2(x + 2) = 0
x2 = 0 and (x+2) = 0
x = 0 and x =-2
Therefore, the X intercepts are (0,0) and (-2,0)
At x = 0, the graph touches and turns around but at x= -2 the graph crosses the x – axis.
(c).
Y-intercept is the point on the graph where x = 0
Solving, y = x2(x + 2) at x = 0
y = 0(0+2) = 0
Therefore, Y Intercept is (0,0)
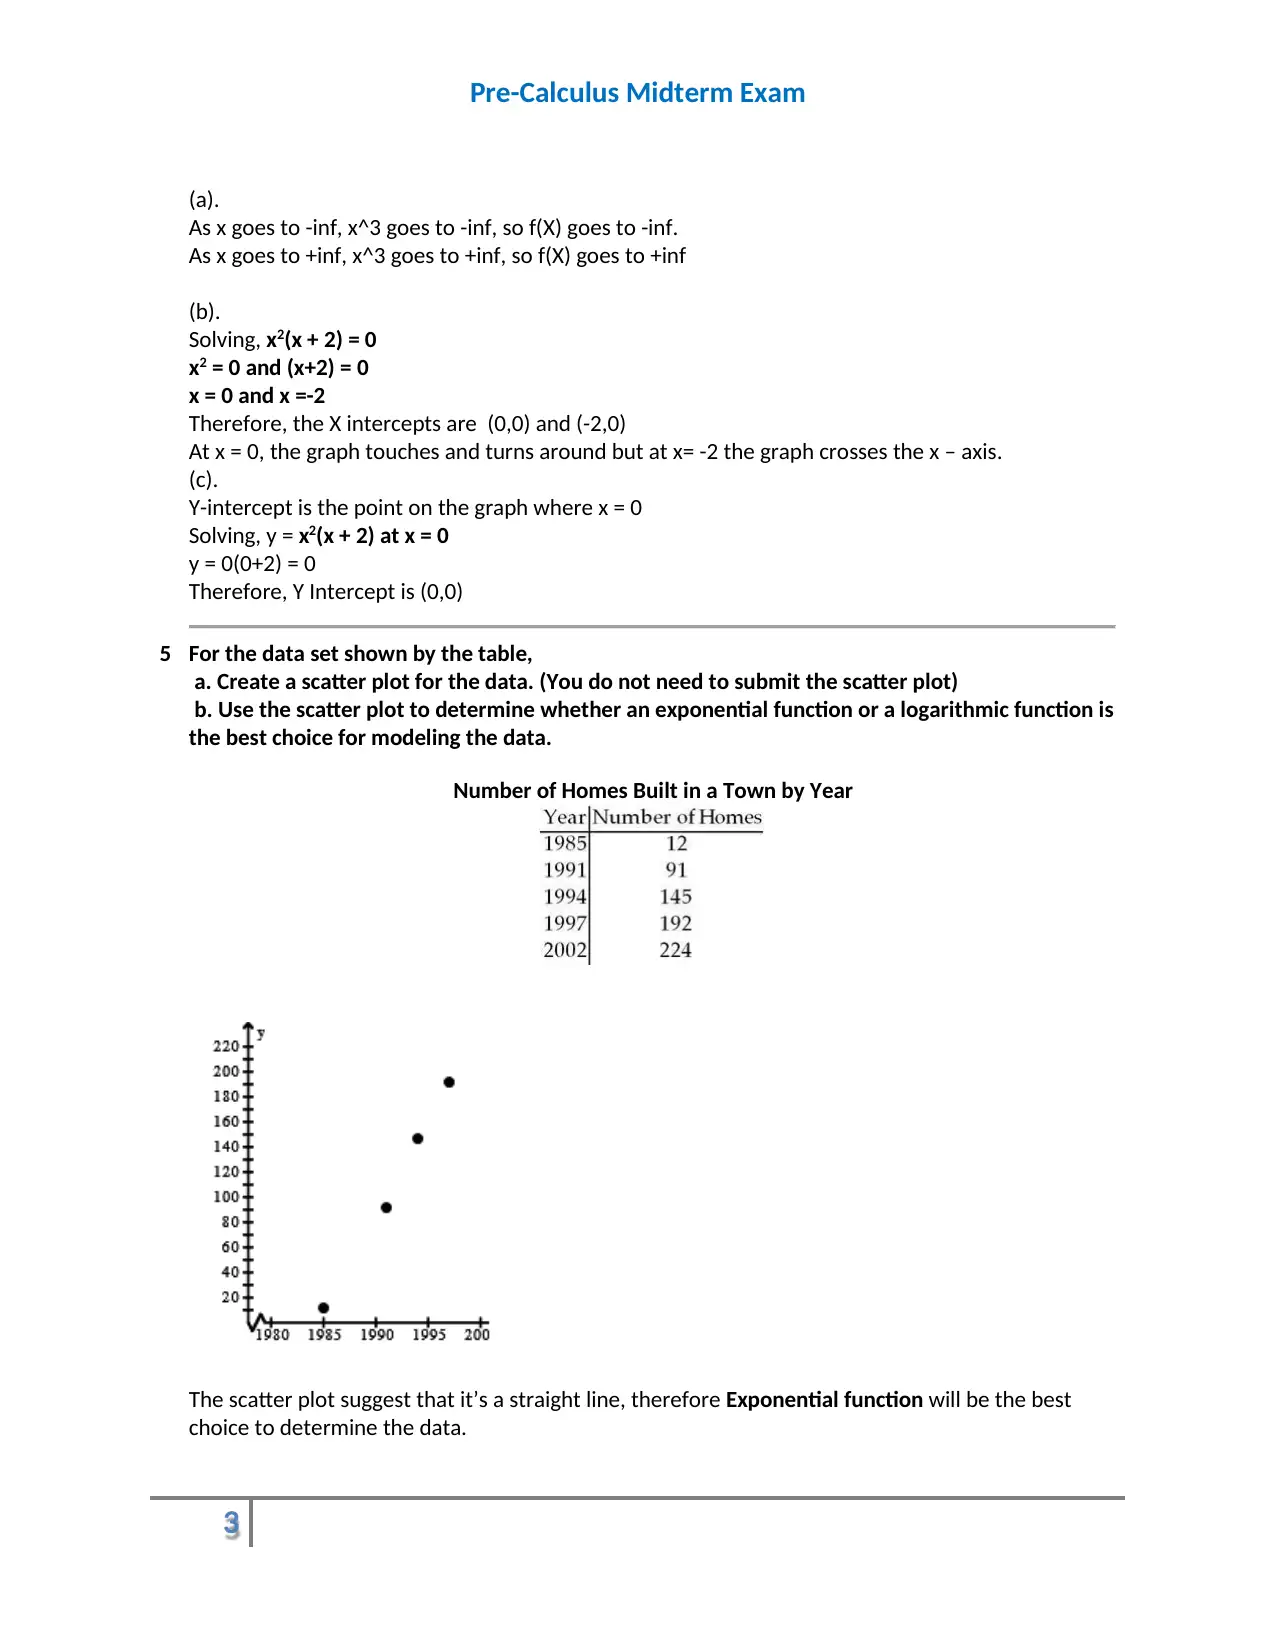
5 For the data set shown by the table,
a. Create a scatter plot for the data. (You do not need to submit the scatter plot)
b. Use the scatter plot to determine whether an exponential function or a logarithmic function is
the best choice for modeling the data.
Number of Homes Built in a Town by Year
The scatter plot suggest that it’s a straight line, therefore Exponential function will be the best
choice to determine the data.
3
(a).
As x goes to -inf, x^3 goes to -inf, so f(X) goes to -inf.
As x goes to +inf, x^3 goes to +inf, so f(X) goes to +inf
(b).
Solving, x2(x + 2) = 0
x2 = 0 and (x+2) = 0
x = 0 and x =-2
Therefore, the X intercepts are (0,0) and (-2,0)
At x = 0, the graph touches and turns around but at x= -2 the graph crosses the x – axis.
(c).
Y-intercept is the point on the graph where x = 0
Solving, y = x2(x + 2) at x = 0
y = 0(0+2) = 0
Therefore, Y Intercept is (0,0)
5 For the data set shown by the table,
a. Create a scatter plot for the data. (You do not need to submit the scatter plot)
b. Use the scatter plot to determine whether an exponential function or a logarithmic function is
the best choice for modeling the data.
Number of Homes Built in a Town by Year
The scatter plot suggest that it’s a straight line, therefore Exponential function will be the best
choice to determine the data.
⊘ This is a preview!⊘
Do you want full access?
Subscribe today to unlock all pages.
Trusted by 1+ million students worldwide
Pre-Calculus Midterm Exam
4
6 Verify the identity. Show your work.
(1 + tan2u)(1 - sin2u) = 1
Taking L.H.S
(1 + tan2u)(1 - sin2u) = sec2u * cos2u = 1
𝑐𝑜𝑠2𝑢 * cos2u = 1 (R.H.S)
7 Verify the identity. Show your work.
cot2x + csc2x = 2csc2x - 1
Taking R.H.S
2csc2x – 1 = csc2x + csc2x -1 = csc2x + 1
𝑠𝑖𝑛2𝑥 – 1 = csc2x + 1−𝑠𝑖𝑛2𝑥
𝑠𝑖𝑛2𝑥 = csc2x + 𝑐𝑜𝑠2𝑥
𝑠𝑖𝑛2𝑥 = csc2x + cot2x (L.H.S)
8 Verify the identity. Show your work.
1 + sec2xsin2x = sec2x
Taking L.H.S
1 + sec2xsin2x = 1 + 1
𝑐𝑜𝑠2𝑥sin2x = 1+tan2x = sec2x (R.H.S)
9 Verify the identity. Show your work.
cos(α - β) - cos(α + β) = 2 sin α sin β
Taking L.H.S
cos(α - β) - cos(α + β) = cos(α) cos(β) + sin(α) sin(β) - cos(α) cos(β) + sin(α) sin(β) = 2 sin α sin β
(R.H.S)
10 The following data represents the normal monthly precipitation for a certain city.
4
6 Verify the identity. Show your work.
(1 + tan2u)(1 - sin2u) = 1
Taking L.H.S
(1 + tan2u)(1 - sin2u) = sec2u * cos2u = 1
𝑐𝑜𝑠2𝑢 * cos2u = 1 (R.H.S)
7 Verify the identity. Show your work.
cot2x + csc2x = 2csc2x - 1
Taking R.H.S
2csc2x – 1 = csc2x + csc2x -1 = csc2x + 1
𝑠𝑖𝑛2𝑥 – 1 = csc2x + 1−𝑠𝑖𝑛2𝑥
𝑠𝑖𝑛2𝑥 = csc2x + 𝑐𝑜𝑠2𝑥
𝑠𝑖𝑛2𝑥 = csc2x + cot2x (L.H.S)
8 Verify the identity. Show your work.
1 + sec2xsin2x = sec2x
Taking L.H.S
1 + sec2xsin2x = 1 + 1
𝑐𝑜𝑠2𝑥sin2x = 1+tan2x = sec2x (R.H.S)
9 Verify the identity. Show your work.
cos(α - β) - cos(α + β) = 2 sin α sin β
Taking L.H.S
cos(α - β) - cos(α + β) = cos(α) cos(β) + sin(α) sin(β) - cos(α) cos(β) + sin(α) sin(β) = 2 sin α sin β
(R.H.S)
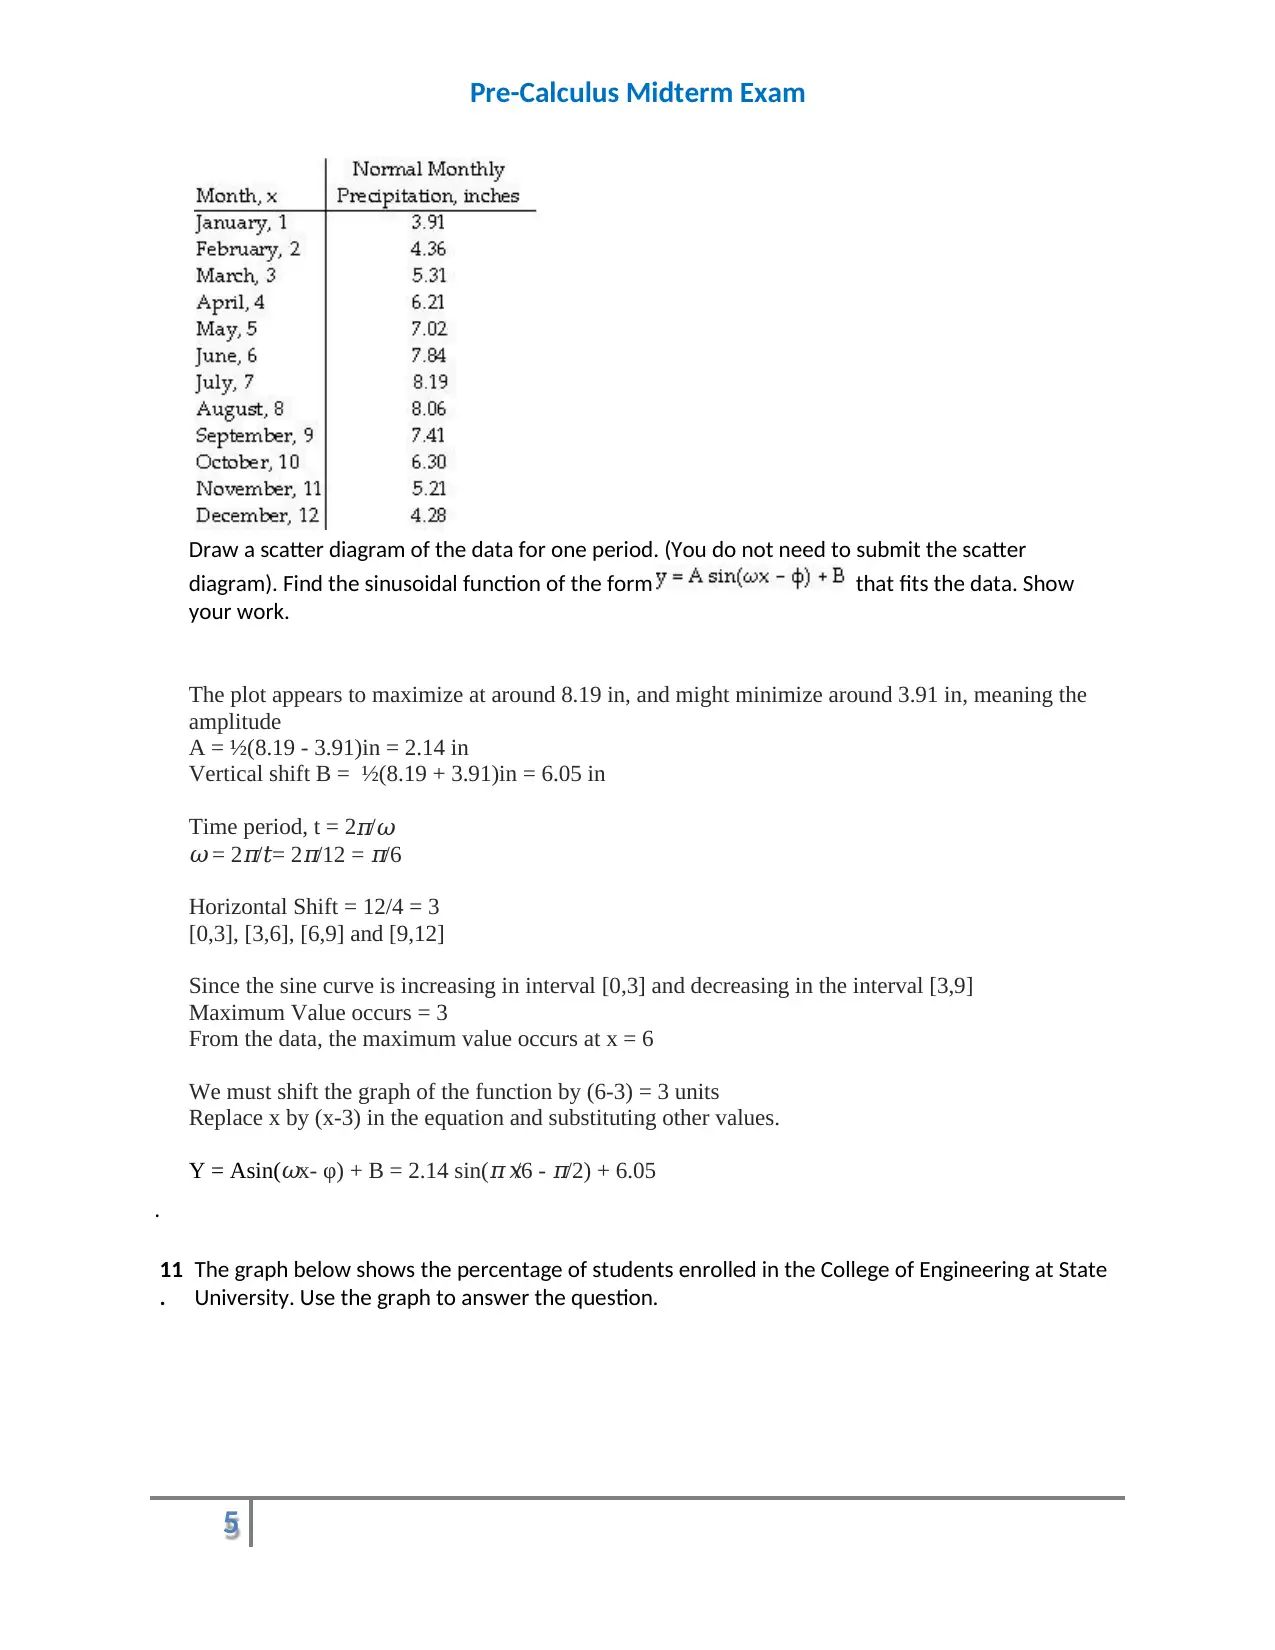
10 The following data represents the normal monthly precipitation for a certain city.
Paraphrase This Document
Need a fresh take? Get an instant paraphrase of this document with our AI Paraphraser
Pre-Calculus Midterm Exam
5
Draw a scatter diagram of the data for one period. (You do not need to submit the scatter
diagram). Find the sinusoidal function of the form that fits the data. Show
your work.
The plot appears to maximize at around 8.19 in, and might minimize around 3.91 in, meaning the
amplitude
A = ½(8.19 - 3.91)in = 2.14 in
Vertical shift B = ½(8.19 + 3.91)in = 6.05 in
Time period, t = 2𝜋/𝜔
𝜔 = 2𝜋/𝑡= 2𝜋/12 = 𝜋/6
Horizontal Shift = 12/4 = 3
[0,3], [3,6], [6,9] and [9,12]
Since the sine curve is increasing in interval [0,3] and decreasing in the interval [3,9]
Maximum Value occurs = 3
From the data, the maximum value occurs at x = 6
We must shift the graph of the function by (6-3) = 3 units
Replace x by (x-3) in the equation and substituting other values.
Y = Asin(𝜔x- φ) + B = 2.14 sin(𝜋𝑥/6 - 𝜋/2) + 6.05
.
11
.
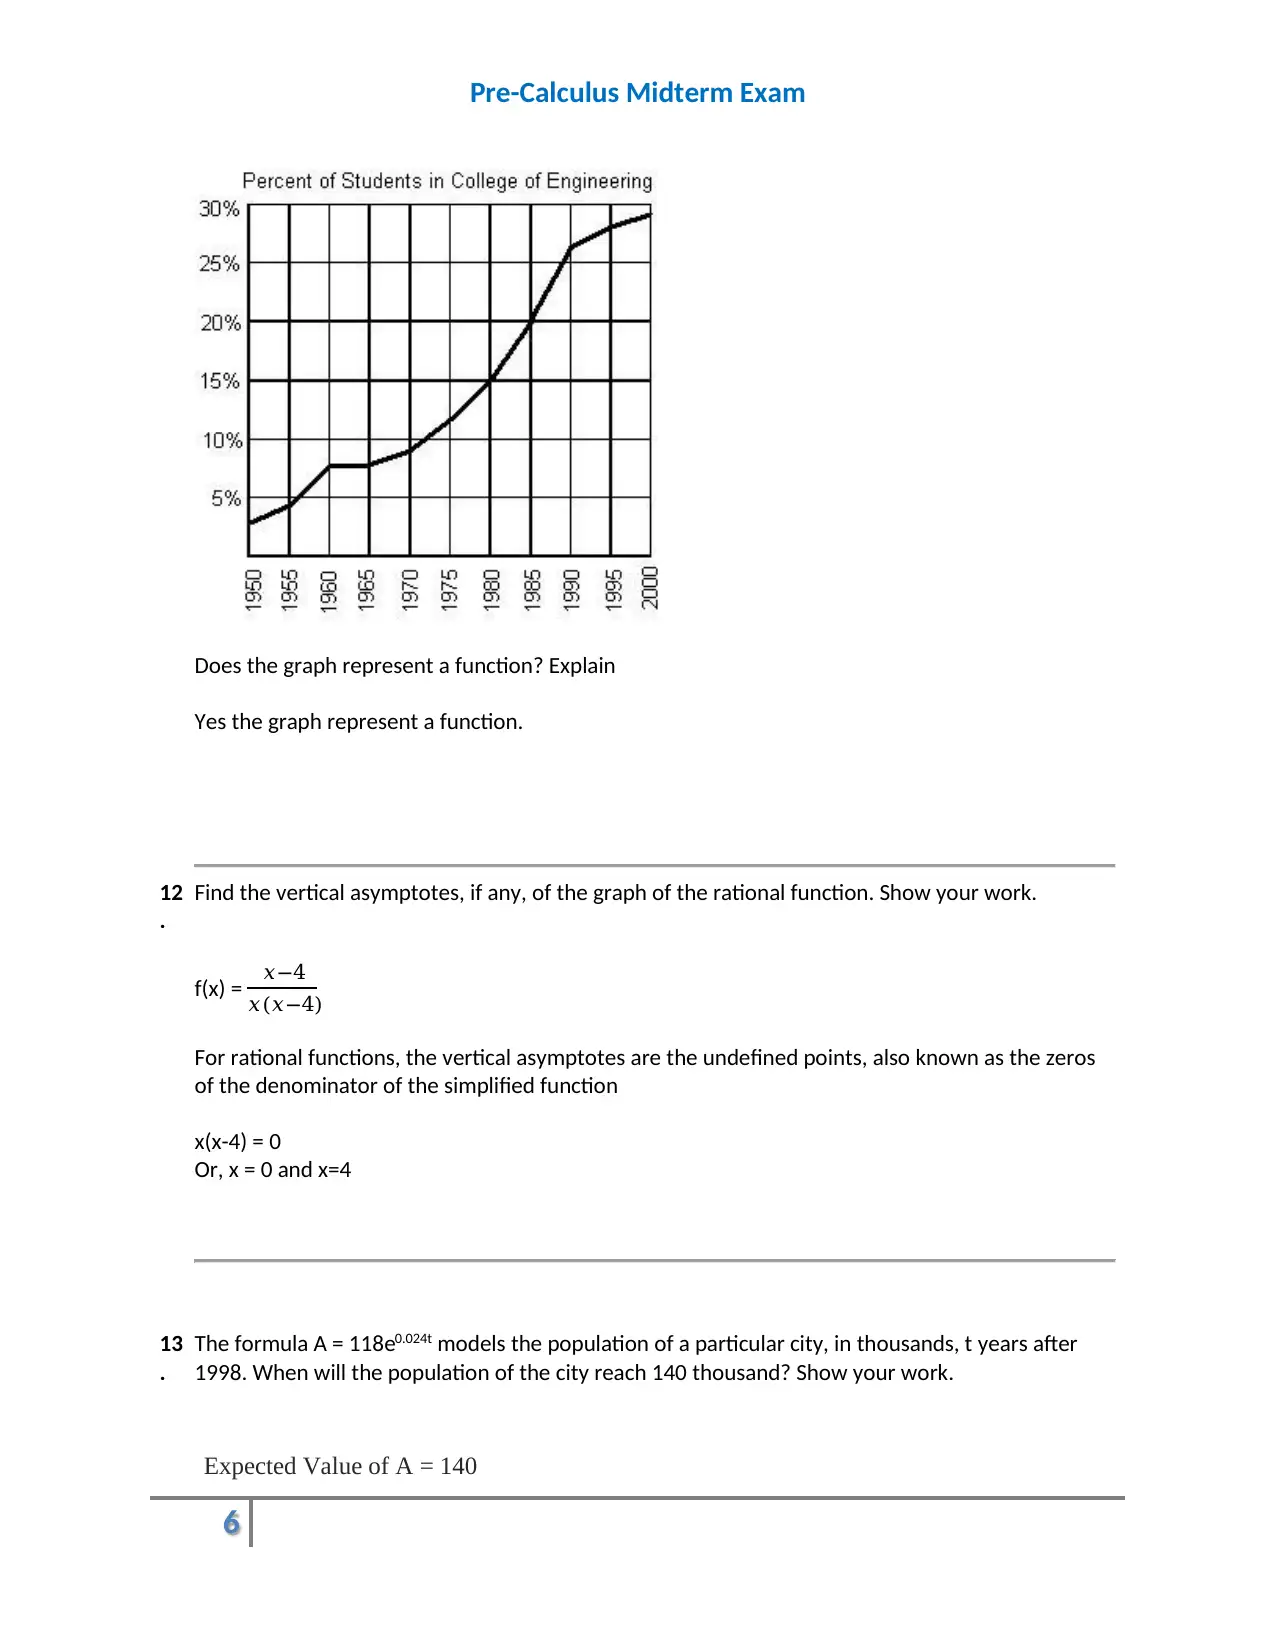
The graph below shows the percentage of students enrolled in the College of Engineering at State
University. Use the graph to answer the question.
5
Draw a scatter diagram of the data for one period. (You do not need to submit the scatter
diagram). Find the sinusoidal function of the form that fits the data. Show
your work.
The plot appears to maximize at around 8.19 in, and might minimize around 3.91 in, meaning the
amplitude
A = ½(8.19 - 3.91)in = 2.14 in
Vertical shift B = ½(8.19 + 3.91)in = 6.05 in
Time period, t = 2𝜋/𝜔
𝜔 = 2𝜋/𝑡= 2𝜋/12 = 𝜋/6
Horizontal Shift = 12/4 = 3
[0,3], [3,6], [6,9] and [9,12]
Since the sine curve is increasing in interval [0,3] and decreasing in the interval [3,9]
Maximum Value occurs = 3
From the data, the maximum value occurs at x = 6
We must shift the graph of the function by (6-3) = 3 units
Replace x by (x-3) in the equation and substituting other values.
Y = Asin(𝜔x- φ) + B = 2.14 sin(𝜋𝑥/6 - 𝜋/2) + 6.05
.
11
.
The graph below shows the percentage of students enrolled in the College of Engineering at State
University. Use the graph to answer the question.
Pre-Calculus Midterm Exam
6
Does the graph represent a function? Explain
Yes the graph represent a function.
12
.
Find the vertical asymptotes, if any, of the graph of the rational function. Show your work.
f(x) = 𝑥−4
𝑥(𝑥−4)
For rational functions, the vertical asymptotes are the undefined points, also known as the zeros
of the denominator of the simplified function
x(x-4) = 0
Or, x = 0 and x=4
13
.
The formula A = 118e0.024t models the population of a particular city, in thousands, t years after
1998. When will the population of the city reach 140 thousand? Show your work.
Expected Value of A = 140
⊘ This is a preview!⊘
Do you want full access?
Subscribe today to unlock all pages.
Trusted by 1+ million students worldwide
Pre-Calculus Midterm Exam
7
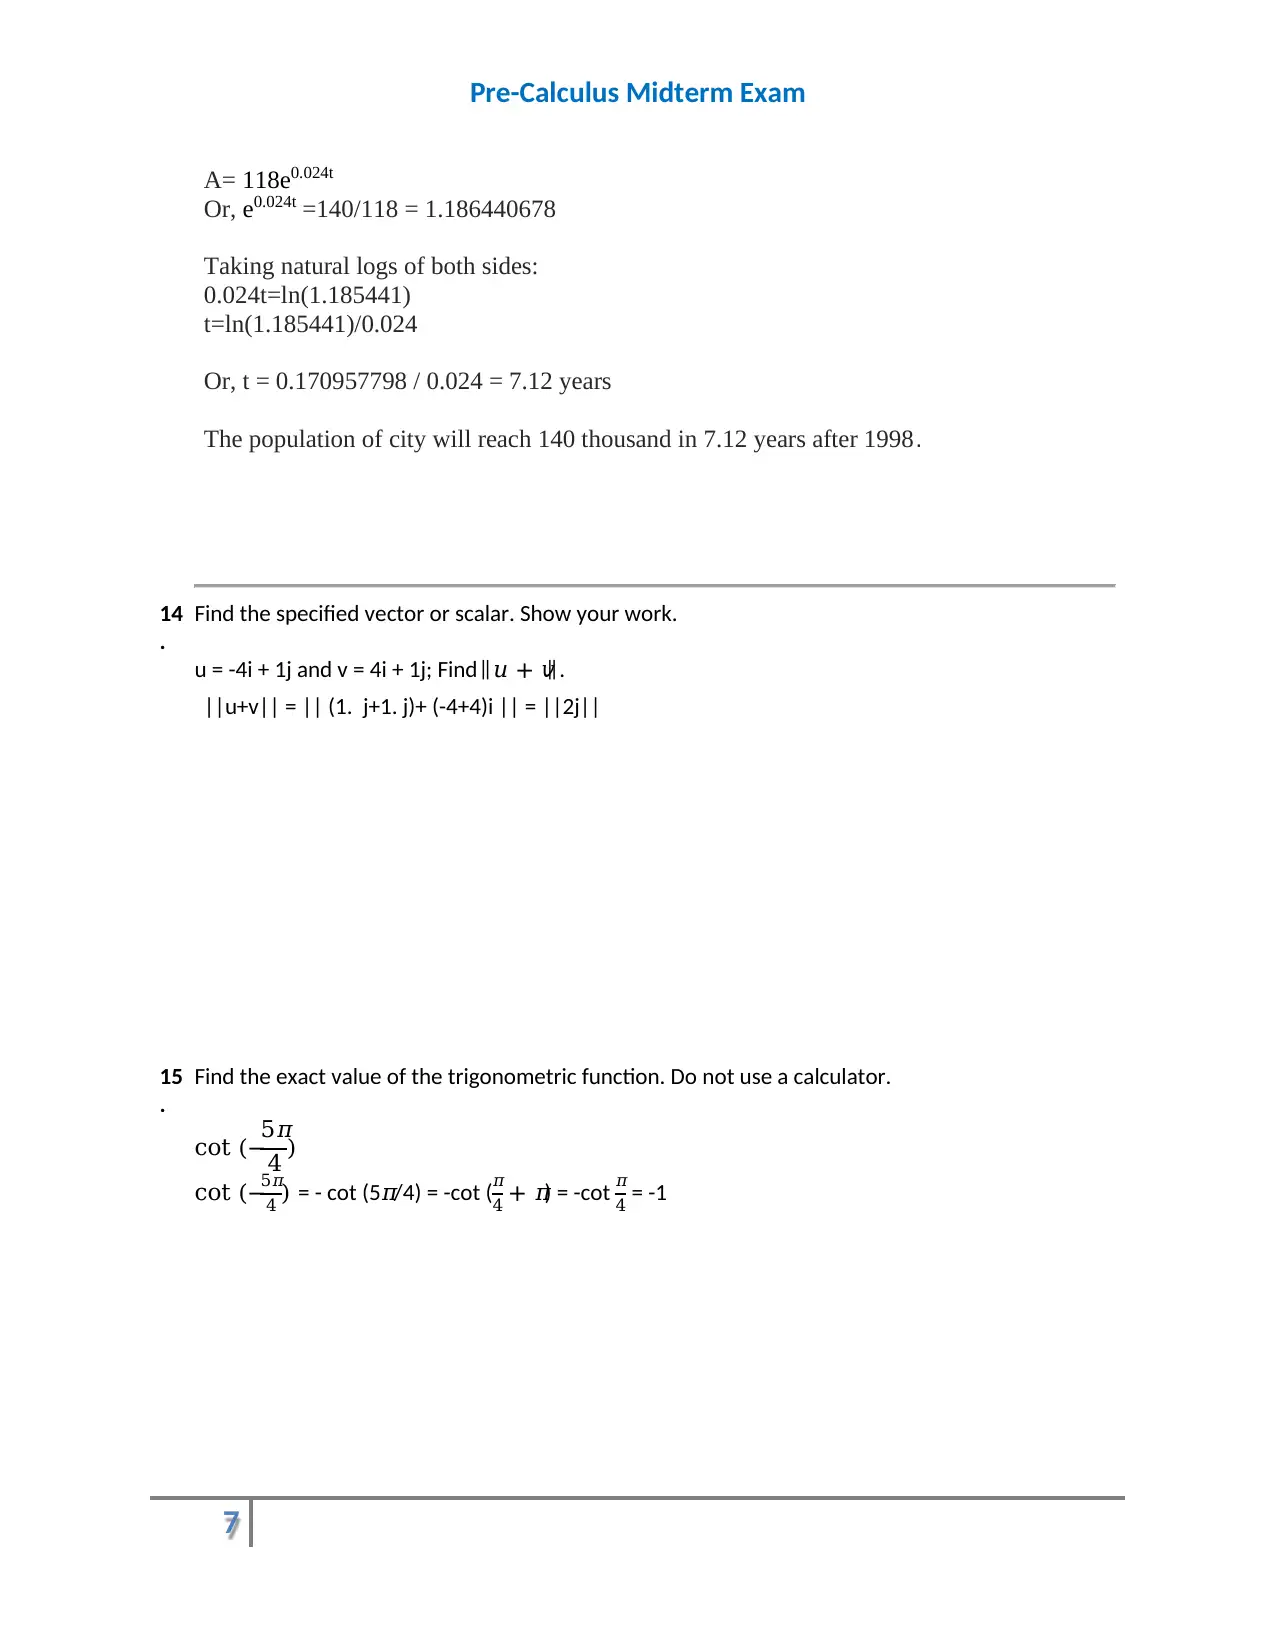
A= 118e0.024t
Or, e0.024t =140/118 = 1.186440678
Taking natural logs of both sides:
0.024t=ln(1.185441)
t=ln(1.185441)/0.024
Or, t = 0.170957798 / 0.024 = 7.12 years
The population of city will reach 140 thousand in 7.12 years after 1998.
14
.
Find the specified vector or scalar. Show your work.
u = -4i + 1j and v = 4i + 1j; Find ‖ 𝑢 + 𝑣‖ .
||u+v|| = || (1. j+1. j)+ (-4+4)i || = ||2j||
15
.
Find the exact value of the trigonometric function. Do not use a calculator.
cot (−
5𝜋
4 )
cot (−
5𝜋
4 ) = - cot (5𝜋/4) = -cot (𝜋
4 + 𝜋) = -cot 𝜋
4 = -1
7
A= 118e0.024t
Or, e0.024t =140/118 = 1.186440678
Taking natural logs of both sides:
0.024t=ln(1.185441)
t=ln(1.185441)/0.024
Or, t = 0.170957798 / 0.024 = 7.12 years
The population of city will reach 140 thousand in 7.12 years after 1998.
14
.
Find the specified vector or scalar. Show your work.
u = -4i + 1j and v = 4i + 1j; Find ‖ 𝑢 + 𝑣‖ .
||u+v|| = || (1. j+1. j)+ (-4+4)i || = ||2j||
15
.
Find the exact value of the trigonometric function. Do not use a calculator.
cot (−
5𝜋
4 )
cot (−
5𝜋
4 ) = - cot (5𝜋/4) = -cot (𝜋
4 + 𝜋) = -cot 𝜋
4 = -1
Paraphrase This Document
Need a fresh take? Get an instant paraphrase of this document with our AI Paraphraser
Pre-Calculus Midterm Exam
8
16
.
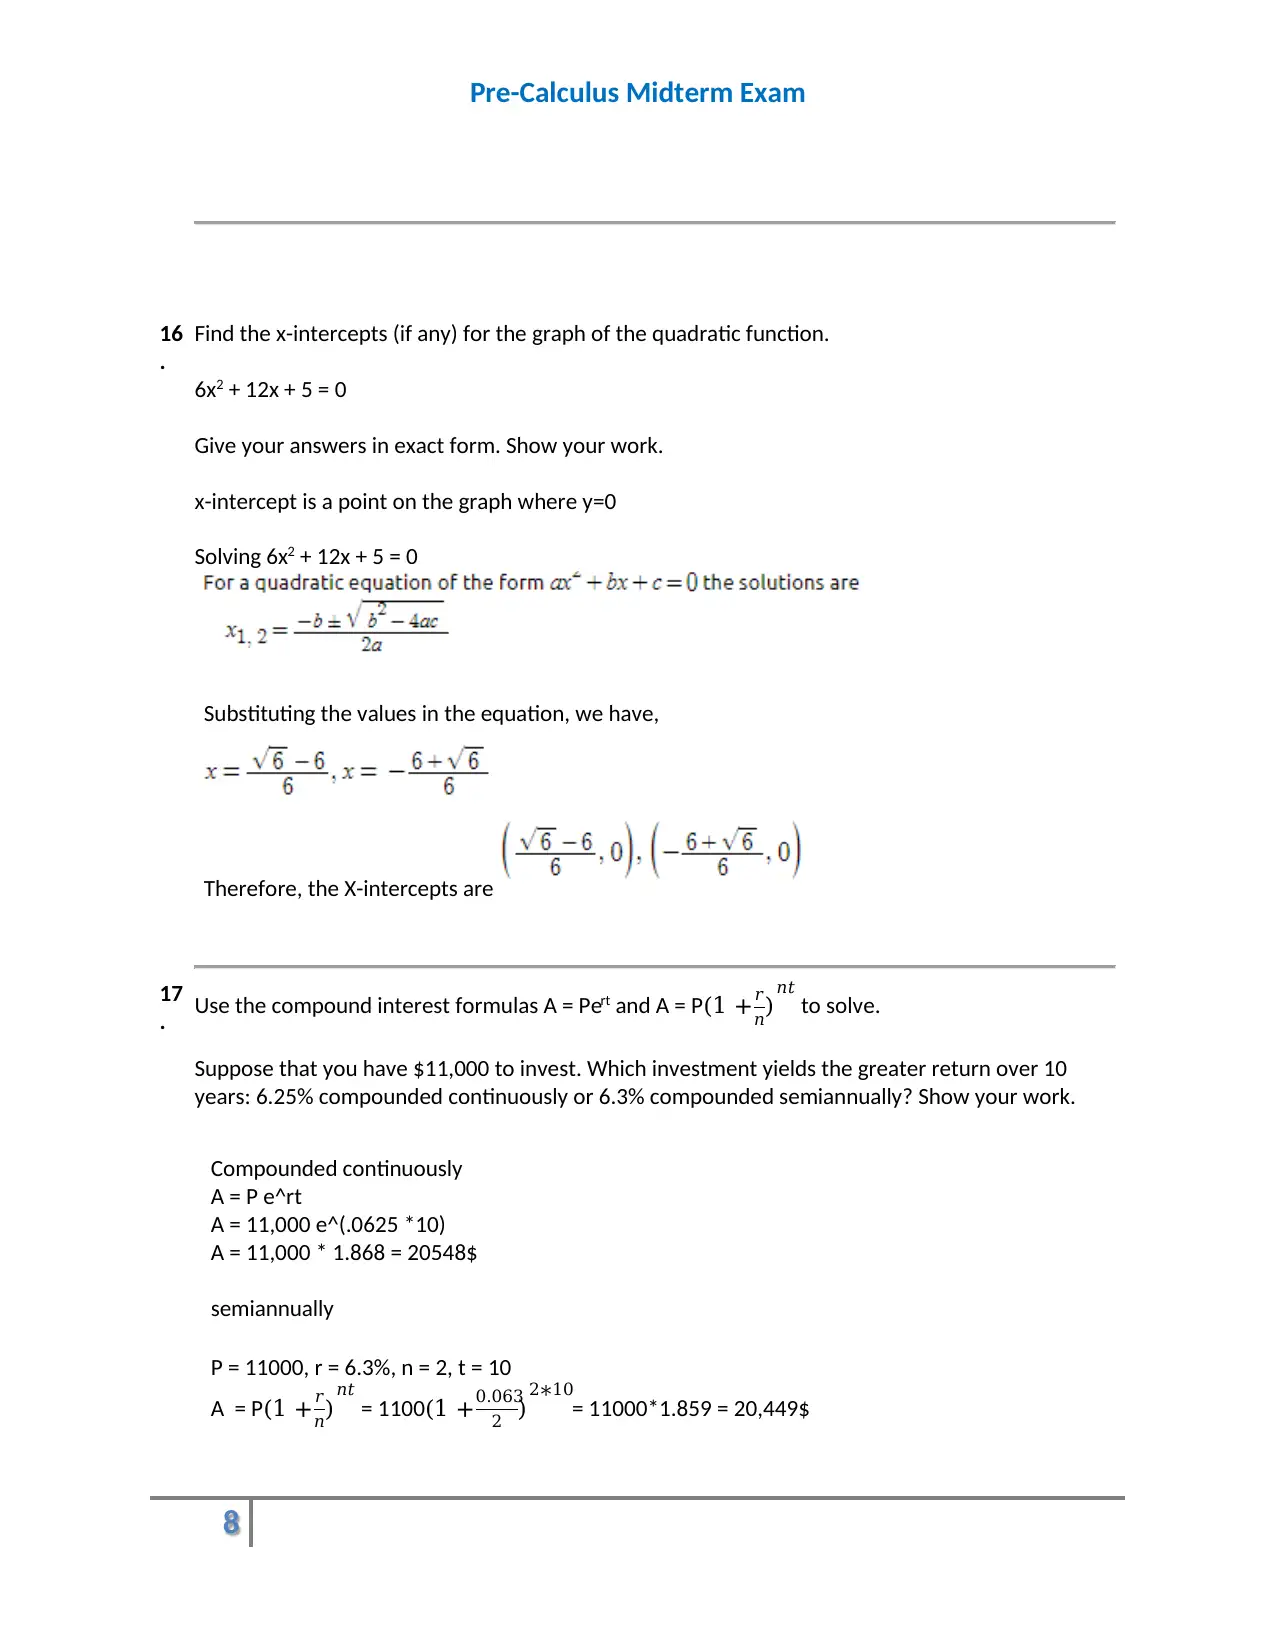
Find the x-intercepts (if any) for the graph of the quadratic function.
6x2 + 12x + 5 = 0
Give your answers in exact form. Show your work.
x-intercept is a point on the graph where y=0
Solving 6x2 + 12x + 5 = 0
Substituting the values in the equation, we have,
Therefore, the X-intercepts are
17
. Use the compound interest formulas A = Pert and A = P(1 +𝑟
𝑛)𝑛𝑡
to solve.
Suppose that you have $11,000 to invest. Which investment yields the greater return over 10
years: 6.25% compounded continuously or 6.3% compounded semiannually? Show your work.
Compounded continuously
A = P e^rt
A = 11,000 e^(.0625 *10)
A = 11,000 * 1.868 = 20548$
semiannually
P = 11000, r = 6.3%, n = 2, t = 10
A = P(1 +𝑟
𝑛)𝑛𝑡
= 1100(1 +0.063
2 )2∗10
= 11000*1.859 = 20,449$
8
16
.
Find the x-intercepts (if any) for the graph of the quadratic function.
6x2 + 12x + 5 = 0
Give your answers in exact form. Show your work.
x-intercept is a point on the graph where y=0
Solving 6x2 + 12x + 5 = 0
Substituting the values in the equation, we have,
Therefore, the X-intercepts are
17
. Use the compound interest formulas A = Pert and A = P(1 +𝑟
𝑛)𝑛𝑡
to solve.
Suppose that you have $11,000 to invest. Which investment yields the greater return over 10
years: 6.25% compounded continuously or 6.3% compounded semiannually? Show your work.
Compounded continuously
A = P e^rt
A = 11,000 e^(.0625 *10)
A = 11,000 * 1.868 = 20548$
semiannually
P = 11000, r = 6.3%, n = 2, t = 10
A = P(1 +𝑟
𝑛)𝑛𝑡
= 1100(1 +0.063
2 )2∗10
= 11000*1.859 = 20,449$
Pre-Calculus Midterm Exam
9
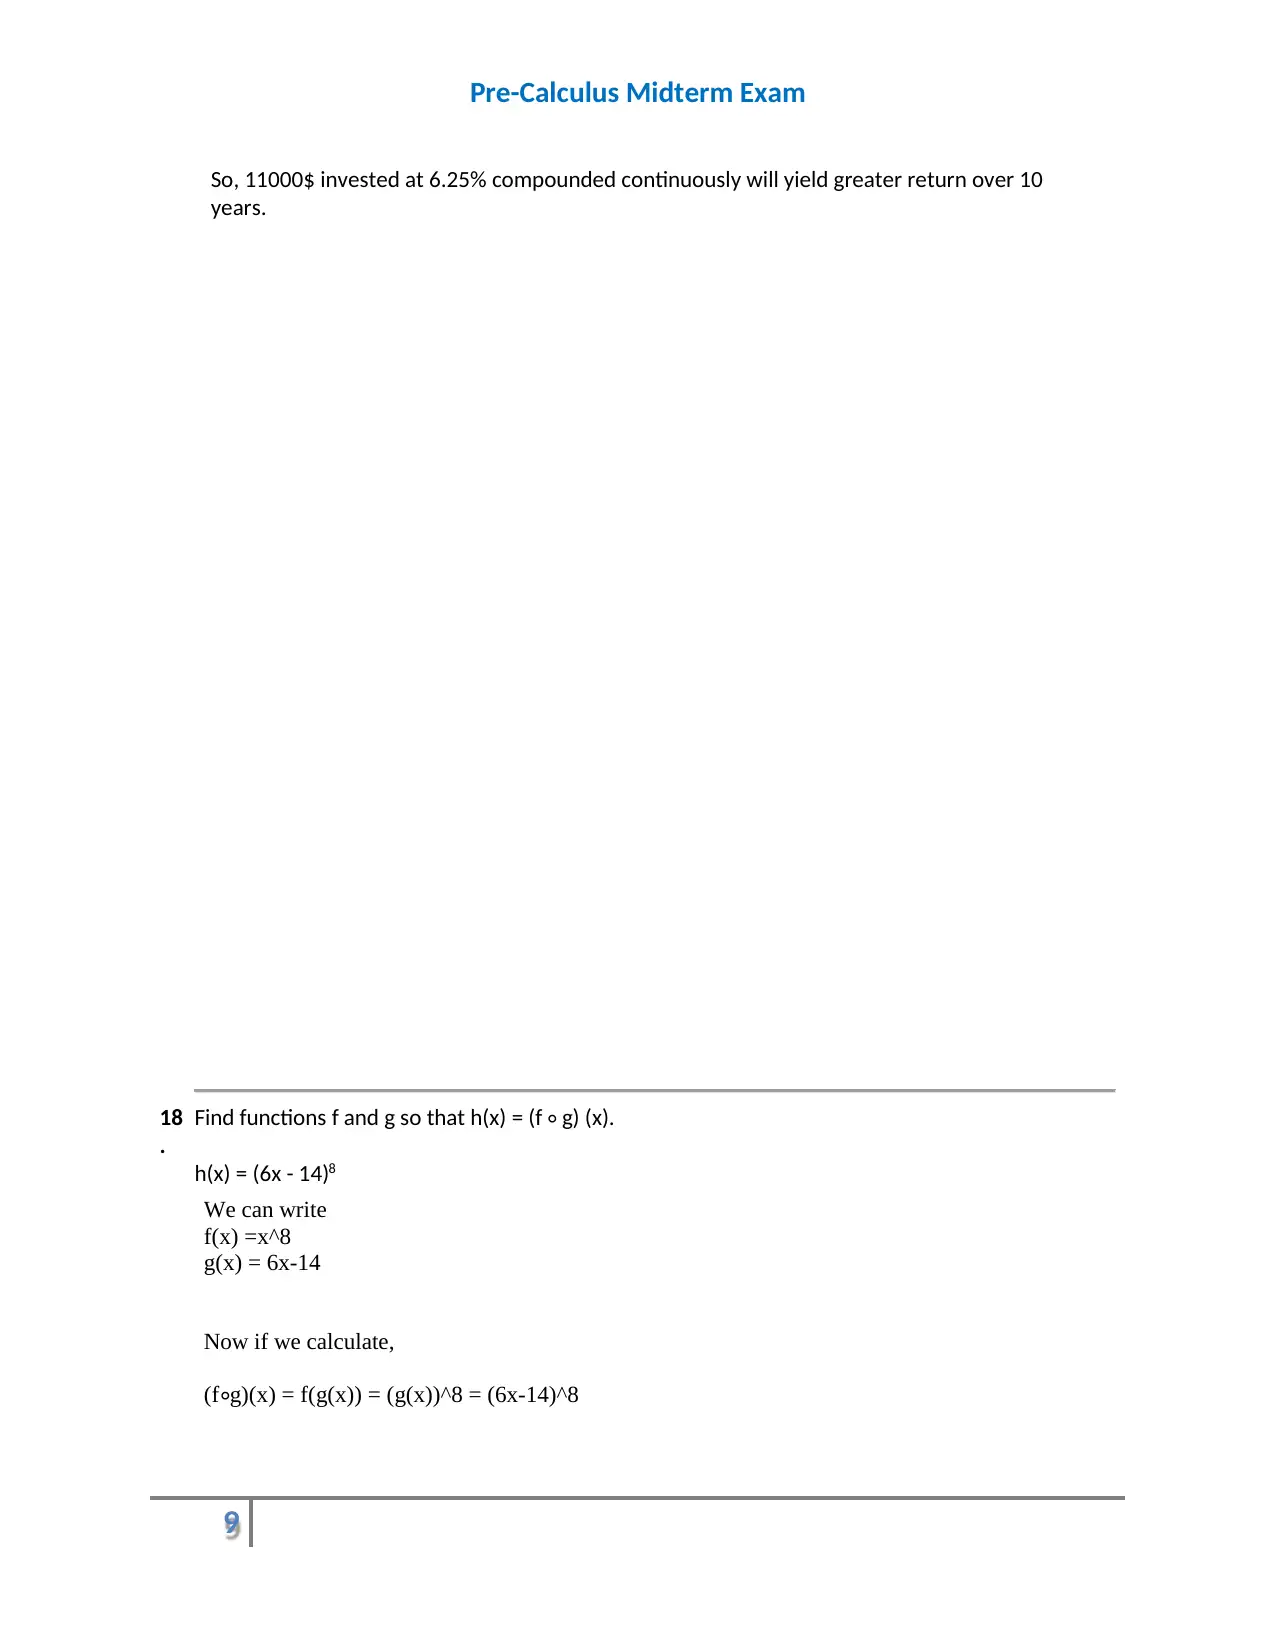
So, 11000$ invested at 6.25% compounded continuously will yield greater return over 10
years.
18
.
Find functions f and g so that h(x) = (f ∘ g) (x).
h(x) = (6x - 14)8
We can write
f(x) =x^8
g(x) = 6x-14
Now if we calculate,
(f∘g)(x) = f(g(x)) = (g(x))^8 = (6x-14)^8
9
So, 11000$ invested at 6.25% compounded continuously will yield greater return over 10
years.
18
.
Find functions f and g so that h(x) = (f ∘ g) (x).
h(x) = (6x - 14)8
We can write
f(x) =x^8
g(x) = 6x-14
Now if we calculate,
(f∘g)(x) = f(g(x)) = (g(x))^8 = (6x-14)^8
⊘ This is a preview!⊘
Do you want full access?
Subscribe today to unlock all pages.
Trusted by 1+ million students worldwide
Pre-Calculus Midterm Exam
10
19
.
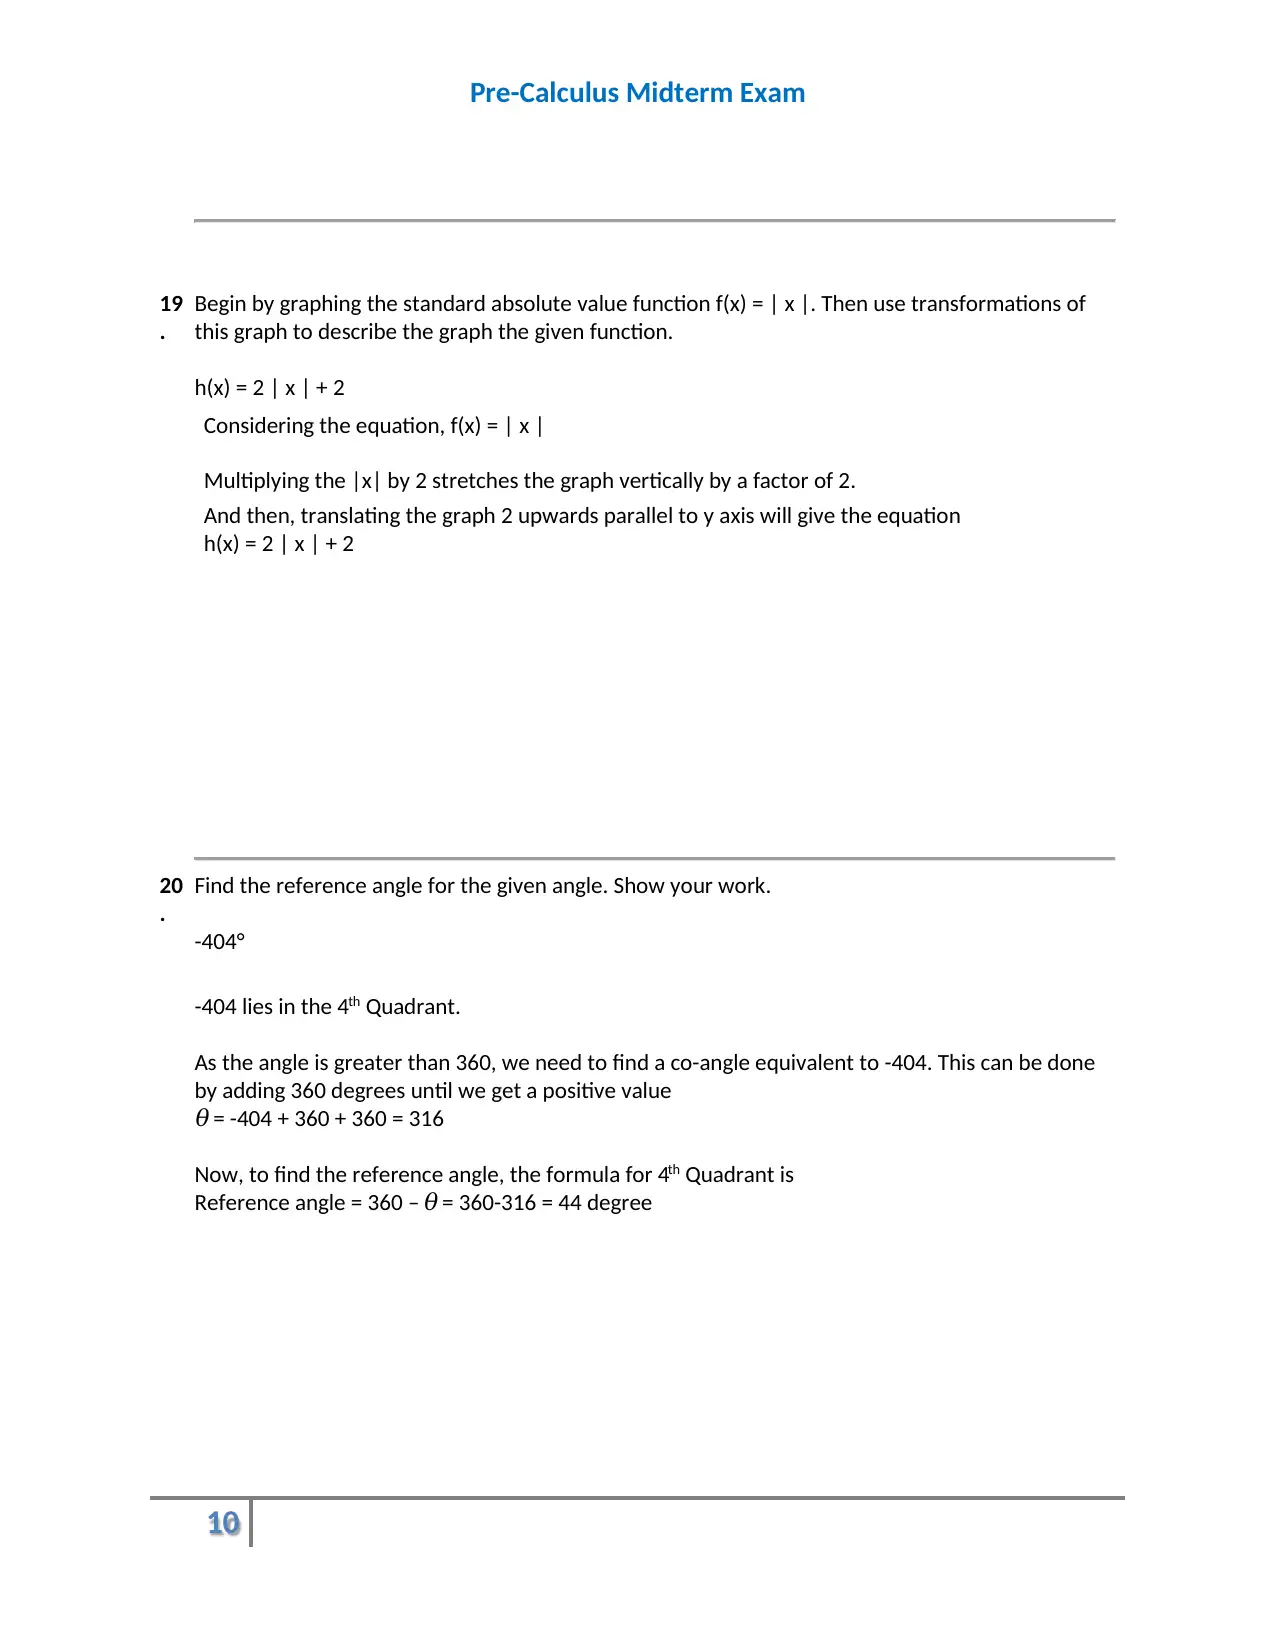
Begin by graphing the standard absolute value function f(x) = | x |. Then use transformations of
this graph to describe the graph the given function.
h(x) = 2 | x | + 2
Considering the equation, f(x) = | x |
Multiplying the |x| by 2 stretches the graph vertically by a factor of 2.
And then, translating the graph 2 upwards parallel to y axis will give the equation
h(x) = 2 | x | + 2
20
.
Find the reference angle for the given angle. Show your work.
-404°
-404 lies in the 4th Quadrant.
As the angle is greater than 360, we need to find a co-angle equivalent to -404. This can be done
by adding 360 degrees until we get a positive value
𝜃 = -404 + 360 + 360 = 316
Now, to find the reference angle, the formula for 4th Quadrant is
Reference angle = 360 – 𝜃 = 360-316 = 44 degree
10
19
.
Begin by graphing the standard absolute value function f(x) = | x |. Then use transformations of
this graph to describe the graph the given function.
h(x) = 2 | x | + 2
Considering the equation, f(x) = | x |
Multiplying the |x| by 2 stretches the graph vertically by a factor of 2.
And then, translating the graph 2 upwards parallel to y axis will give the equation
h(x) = 2 | x | + 2
20
.
Find the reference angle for the given angle. Show your work.
-404°
-404 lies in the 4th Quadrant.
As the angle is greater than 360, we need to find a co-angle equivalent to -404. This can be done
by adding 360 degrees until we get a positive value
𝜃 = -404 + 360 + 360 = 316
Now, to find the reference angle, the formula for 4th Quadrant is
Reference angle = 360 – 𝜃 = 360-316 = 44 degree
Paraphrase This Document
Need a fresh take? Get an instant paraphrase of this document with our AI Paraphraser
Pre-Calculus Midterm Exam
11
Score: ______ / ______
11
Score: ______ / ______
1 out of 11
Your All-in-One AI-Powered Toolkit for Academic Success.
+13062052269
info@desklib.com
Available 24*7 on WhatsApp / Email
![[object Object]](/_next/static/media/star-bottom.7253800d.svg)
Unlock your academic potential
Copyright © 2020–2026 A2Z Services. All Rights Reserved. Developed and managed by ZUCOL.