Predicting Gold Price Fluctuation in Indian Market
VerifiedAdded on 2023/05/28
|10
|3872
|367
AI Summary
The study aims to predict the fluctuations in gold prices in the Indian market using data mining techniques. The report explains the entire supply chain for India’s gold market from imports and recycling through to customer demands. The project expects to predict the gold prices accurately.
Contribute Materials
Your contribution can guide someone’s learning journey. Share your
documents today.
PREDICTING GOLD PRICE
FLUCTUATION IN INDIAN MARKET
Ashok Kumar
X16138422
National college of Ireland
Higher Diploma in Data Analysis
FLUCTUATION IN INDIAN MARKET
Ashok Kumar
X16138422
National college of Ireland
Higher Diploma in Data Analysis
Secure Best Marks with AI Grader
Need help grading? Try our AI Grader for instant feedback on your assignments.
Abstract
The main idea of this exercise is to predict
the fluctuations in gold prices in India.
Where I am going to work on developing
exclusive models that are going to
describes the roles and ways of
approaching the sources that I am going to
considering. In this project I am going to
gather the data from 2008 to 2018. Which
includes the data of Indian economy, this
report explains the entire supply chain for
India’s gold market from imports and
recycling through to customer demands at
the same time gives an overview of current
policies on gold transactions and how they
have been considered over the years.
Alistair Hewitt, Director, and Market
Intelligence, World council Said: In 2016
India was one of the world’s fastest
growing economies, while the economy
was rocked by the demonetisation. By
2020 they expect Indian gold demand to
average 850t to 950t per annum. In India
Gold has higher value and is used to
protect oneself from inflation, that’s why
investors choose to acquire gold instead of
currency. When inflation is high the
demand for gold also increases and vice
versa, in that case, price of gold will
increase and cause huge demand from
customers. Any changes in the global
movement effects the price of metal in
India.
Keywords- Prediction; Fluctuation; Gold
price; Regression; India;
1 Introduction
The historical data proves that, gold
was utilized as a form of currency in
various countries, and the United States of
America is not an exception. Even today,
gold has managed to retain its value. Gold
is used as a means to assess the country’s
financial strength. India is among those
countries which buys gold and the USA,
South Africa, and Australia are those
countries which sells gold. When
compared to alternate investment options,
gold investment is considered as the safe
investment, by the small investors. As, this
commodity has the capacity to bear the in-
built investment risks. The financial
conditions of a country helps the
government to make governmental
investments in gold, and interest rates.
Because, the financial condition indicates
the country’s economic strength. If the
Global investors predict drastic decline in
the gold rates, then they find other place to
invest. In general, the gold spot rates are
decided two times per day depending on
the supply and demand in the gold market.
Any form of fractional change in the gold
price could turn out as a huge profit or loss
for the investors and the government
banks. Therefore, a daily forecast on rise
and decline of the gold rates, is beneficial
for the investors in deciding when to
purchase or sell the commodity.
1.1 Purpose
The purpose of this document is to
set out the requirements for predicting the
factors which mainly impacts the gold
price fluctuation, in the Indian market.
1.2 Project Scope
The scope of the project is to utilize
the data mining techniques to help in the
prediction of fluctuating gold price.
1.3 Project objectives
The objectives of this project is to
stress on the Data mining techniques like,
classification, clustering, regression
methods, decision tree, to predict the
fluctuation in gold price in Indian market,
for a certain period. Followed by, reading
negative consequences, and to find and
1
prove which other factors could affect the
fluctuation of price. The evidence base
will be presented, by undertaking a regular
search of current reviews.
1.4 Project expectations
This project expects to predict the
gold prices, accurately.
1.5 Project Risks
The risks for the project include
inflation, monetary policy, economic data,
supply and-demand and currency
movements, as these factors fluctuates the
gold price.
2 Literature Review
According to [1], the authors have
proved the importance of gold and its
fluctuating price prediction. Gold is valued
and is utilized as a means to assess the
country’s financial strength. The daily
forecast on rise and decline of the gold
rates, is said to benefit the investors. So, a
prediction models are developed in this
research. This research predicts the future
gold rates depending on 22 market
variables, with the help of machine
learning algorithms. The represented
results denote that the daily gold rates are
predicted accurately. The developed
prediction models are said to beneficial the
investors and the central banks, for
deciding on time to invest in gold. It is
observed that predicting the gold rate is
not an easy task. This study is
comprehensive to date, so the various
countries and companies’ economic indicators
are considered. To the contrary we show
that stock value of a major company has
more influence on the gold rates than US
economy. In future, we intend to improve
our results by using ensemble learning,
and deep learning.
As per [2], Develop a forecasting
model for predicting and forecasting gold
prices based on economic factors such as
inflation, currency price movements and
others. For investing the money, investors
are putting their money into gold because
gold plays an important role as a
stabilizing influence for investment
portfolios. Due to the increase in demand
for gold in India, it is necessary to develop
a model that reflects the structure and
pattern of gold market and forecast
movement of gold price. The most
appropriate approach to the understanding
of gold prices Support vector Regression
and decision tree model. The experimental
result will show the better performance
from these two (Decision tree algorithm
and support vector regression algorithm)
algorithms.
It is stated in [3] that, the global gold
market has recently attracted a lot of
attention and the price of gold is relatively
higher than its historical trend. For mining
companies to mitigate risk and uncertainty
in gold price fluctuations, make hedging,
future investment and evaluation
decisions, depend on forecasting future
price trends. The first section of this paper
reviews the world gold market and the
historical trend of gold prices from January
1968 to December 2008. This is followed
by an investigation into the relationship
between gold price and other key
influencing variables, such as oil price and
global inflation over the last 40 years. The
second section applies a modified
econometric version of the long-term trend
reverting jump and dip diffusion model for
forecasting natural-resource commodity
prices. This method addresses the
deficiencies of previous models, such as
jumps and dips as parameters and unit root
test for long-term trends. The model
proposes that historical data of mineral
commodities have three terms to
2
demonstrate fluctuation of prices: a long-
term trend reversion component, a
diffusion component and a jump or dip
component. The model calculates each
term individually to estimate future prices
of mineral commodities. The study
validates the model and estimates the gold
price for the next 10 years, based on
monthly historical data of nominal gold
price.
According to [4], The time series of
gold price in the Indian market and the
global consumer price index for the period
of January 1985 to June 2013 are analyzed
in terms of the multiracial detruded
fluctuation analysis (MF-DFA).
Multifractal variables, such as the
generalized Hurst exponent, the
multifractal mass exponent, the singularity
spectrum, are extracted for both the series.
Special emphasis is given on the possible
source(s) of correlations in these series.
The multifractal results are fitted to the
generalized binomial multifractal model
consists of only two parameters. Our
analysis show that the multifractal nature
of the Indian gold market time series and
the global consumer price index series is
due to both the long-range temporal
correlation and the fat-tailed probability
density function of the values.
Surprisingly, the series are well described
by the two-parameter binomial multiracial
model used.
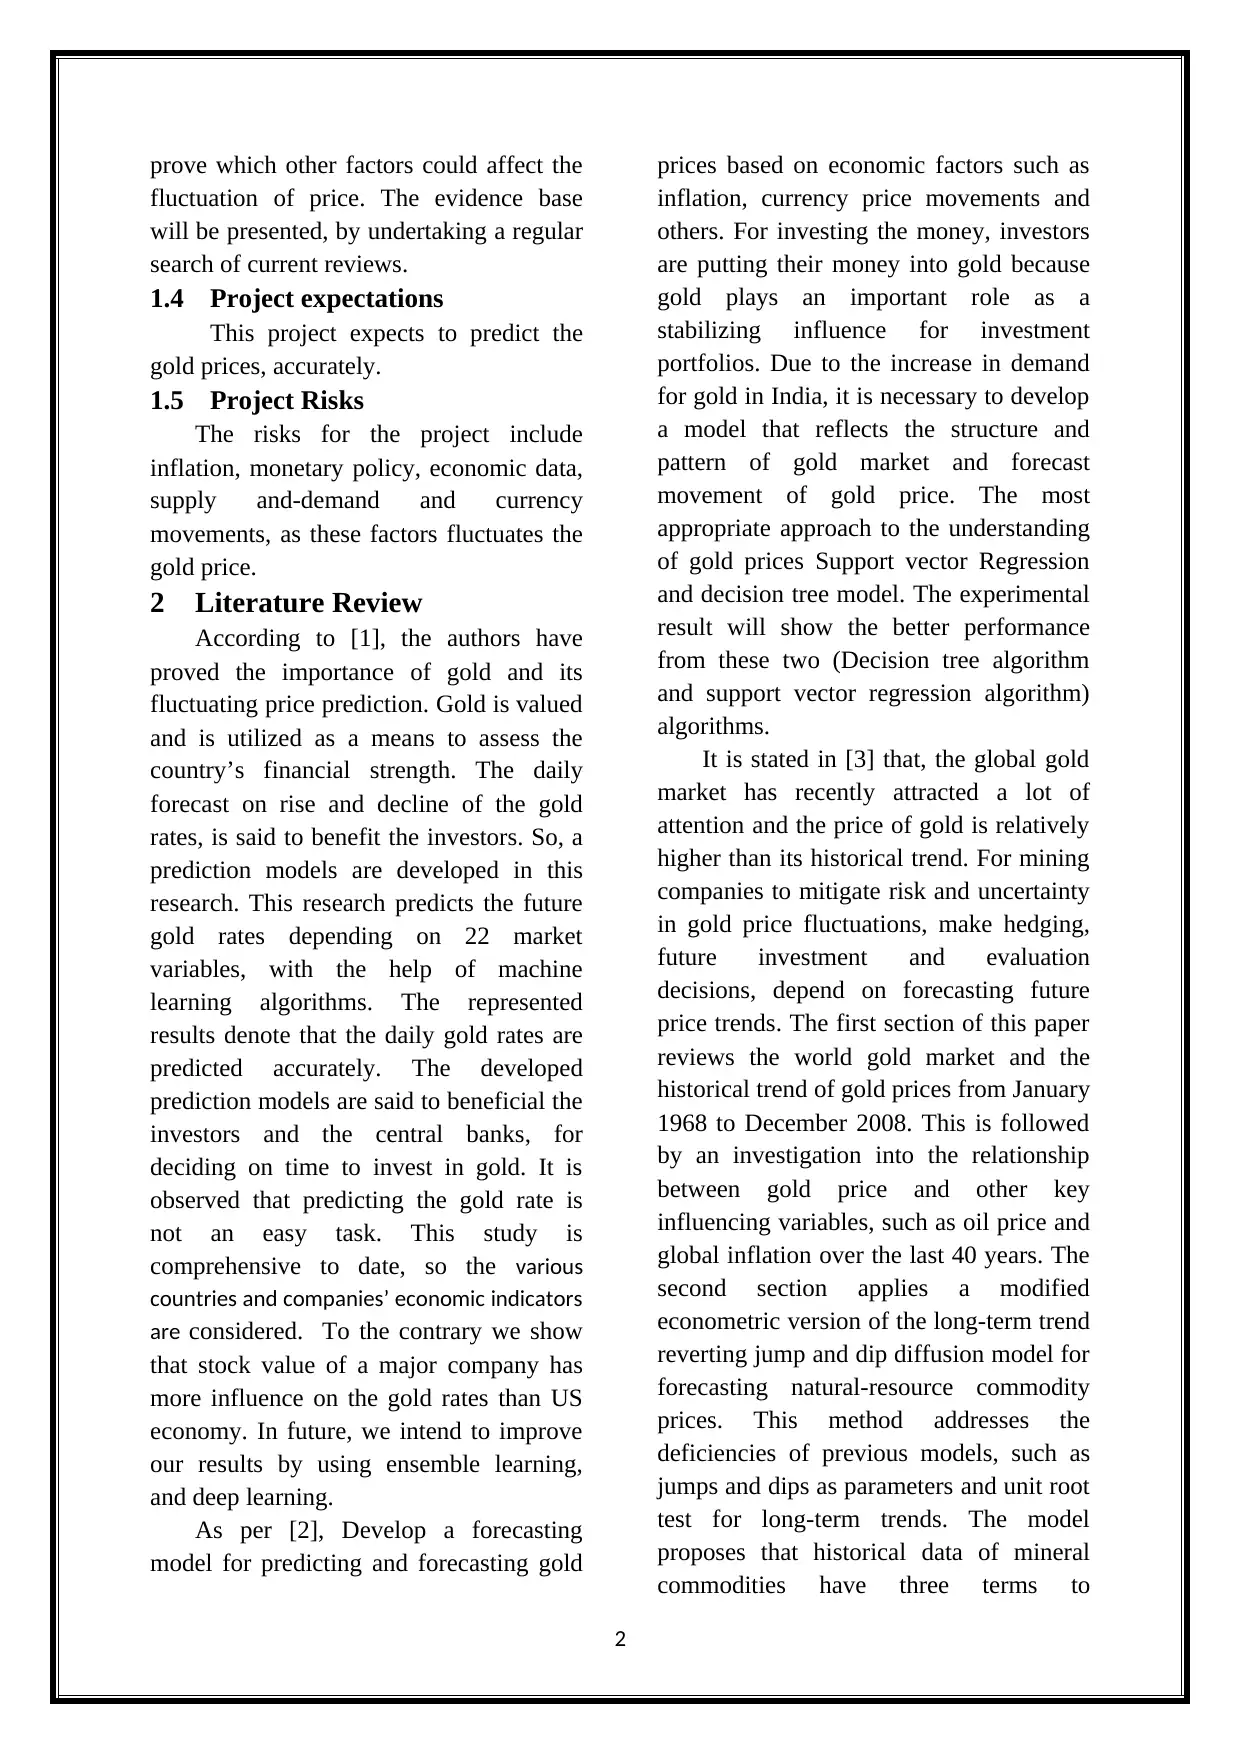
3 Data
The data is gathering from website,
which contains the years and the gold
value in the respective year (in Indian
Currency).
The data collected is represented in the
below figure.
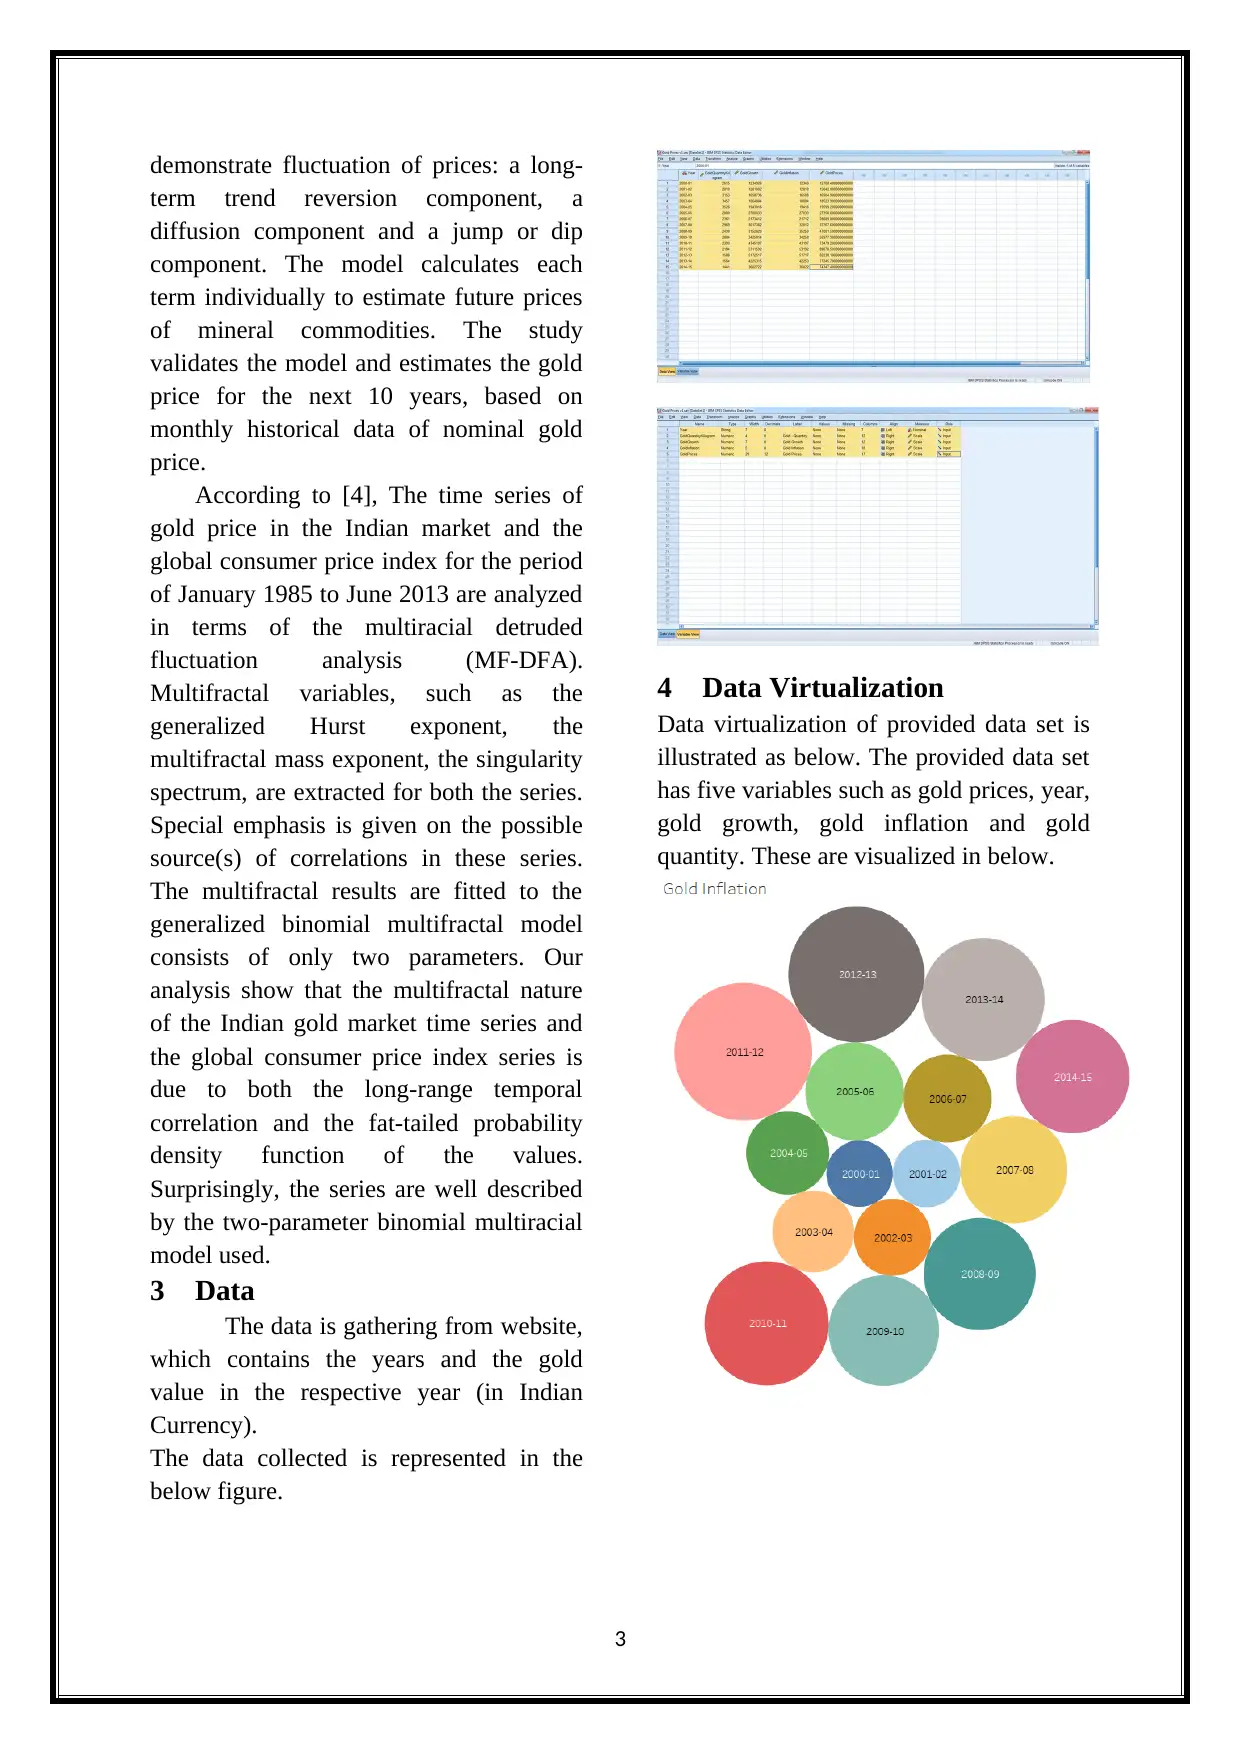
4 Data Virtualization
Data virtualization of provided data set is
illustrated as below. The provided data set
has five variables such as gold prices, year,
gold growth, gold inflation and gold
quantity. These are visualized in below.
3
term trend reversion component, a
diffusion component and a jump or dip
component. The model calculates each
term individually to estimate future prices
of mineral commodities. The study
validates the model and estimates the gold
price for the next 10 years, based on
monthly historical data of nominal gold
price.
According to [4], The time series of
gold price in the Indian market and the
global consumer price index for the period
of January 1985 to June 2013 are analyzed
in terms of the multiracial detruded
fluctuation analysis (MF-DFA).
Multifractal variables, such as the
generalized Hurst exponent, the
multifractal mass exponent, the singularity
spectrum, are extracted for both the series.
Special emphasis is given on the possible
source(s) of correlations in these series.
The multifractal results are fitted to the
generalized binomial multifractal model
consists of only two parameters. Our
analysis show that the multifractal nature
of the Indian gold market time series and
the global consumer price index series is
due to both the long-range temporal
correlation and the fat-tailed probability
density function of the values.
Surprisingly, the series are well described
by the two-parameter binomial multiracial
model used.
3 Data
The data is gathering from website,
which contains the years and the gold
value in the respective year (in Indian
Currency).
The data collected is represented in the
below figure.
4 Data Virtualization
Data virtualization of provided data set is
illustrated as below. The provided data set
has five variables such as gold prices, year,
gold growth, gold inflation and gold
quantity. These are visualized in below.
3
Secure Best Marks with AI Grader
Need help grading? Try our AI Grader for instant feedback on your assignments.
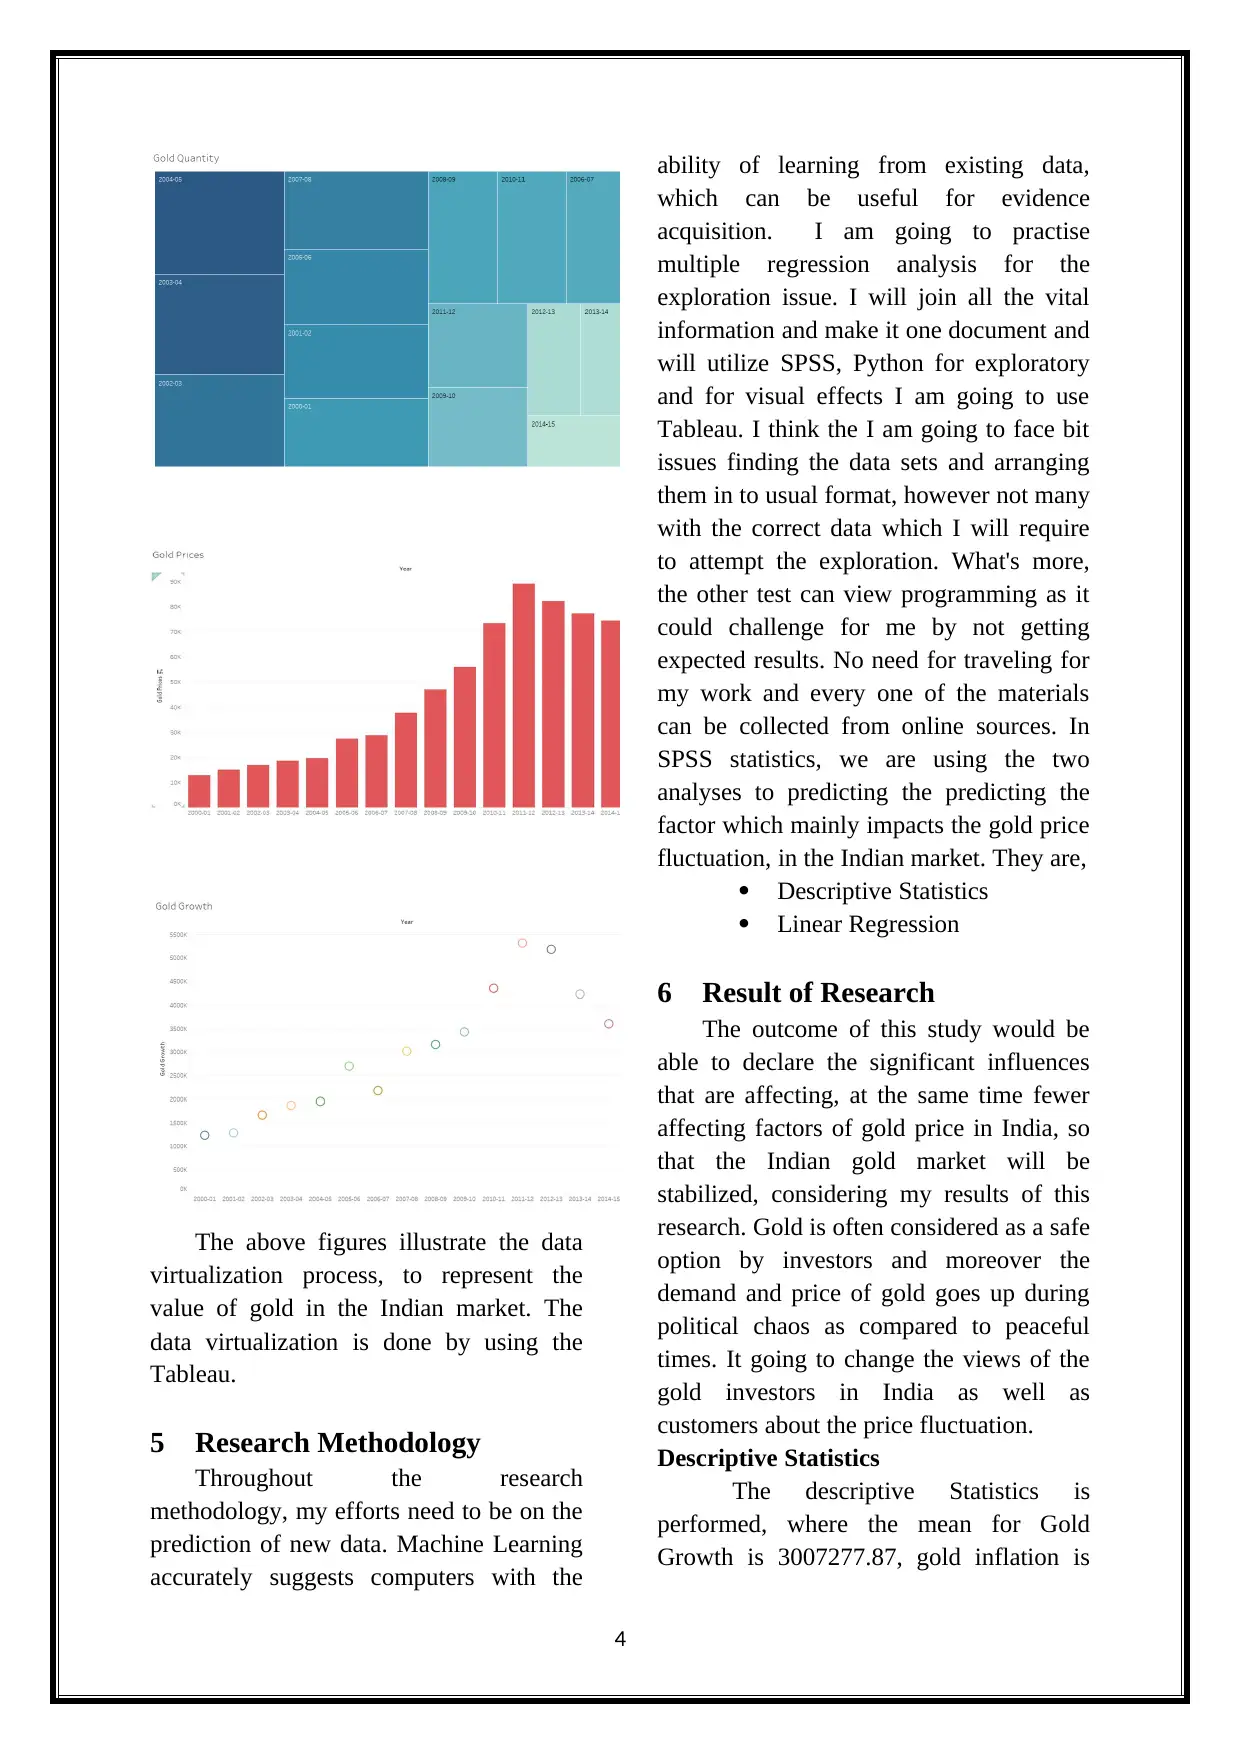
The above figures illustrate the data
virtualization process, to represent the
value of gold in the Indian market. The
data virtualization is done by using the
Tableau.
5 Research Methodology
Throughout the research
methodology, my efforts need to be on the
prediction of new data. Machine Learning
accurately suggests computers with the
ability of learning from existing data,
which can be useful for evidence
acquisition. I am going to practise
multiple regression analysis for the
exploration issue. I will join all the vital
information and make it one document and
will utilize SPSS, Python for exploratory
and for visual effects I am going to use
Tableau. I think the I am going to face bit
issues finding the data sets and arranging
them in to usual format, however not many
with the correct data which I will require
to attempt the exploration. What's more,
the other test can view programming as it
could challenge for me by not getting
expected results. No need for traveling for
my work and every one of the materials
can be collected from online sources. In
SPSS statistics, we are using the two
analyses to predicting the predicting the
factor which mainly impacts the gold price
fluctuation, in the Indian market. They are,
Descriptive Statistics
Linear Regression
6 Result of Research
The outcome of this study would be
able to declare the significant influences
that are affecting, at the same time fewer
affecting factors of gold price in India, so
that the Indian gold market will be
stabilized, considering my results of this
research. Gold is often considered as a safe
option by investors and moreover the
demand and price of gold goes up during
political chaos as compared to peaceful
times. It going to change the views of the
gold investors in India as well as
customers about the price fluctuation.
Descriptive Statistics
The descriptive Statistics is
performed, where the mean for Gold
Growth is 3007277.87, gold inflation is
4
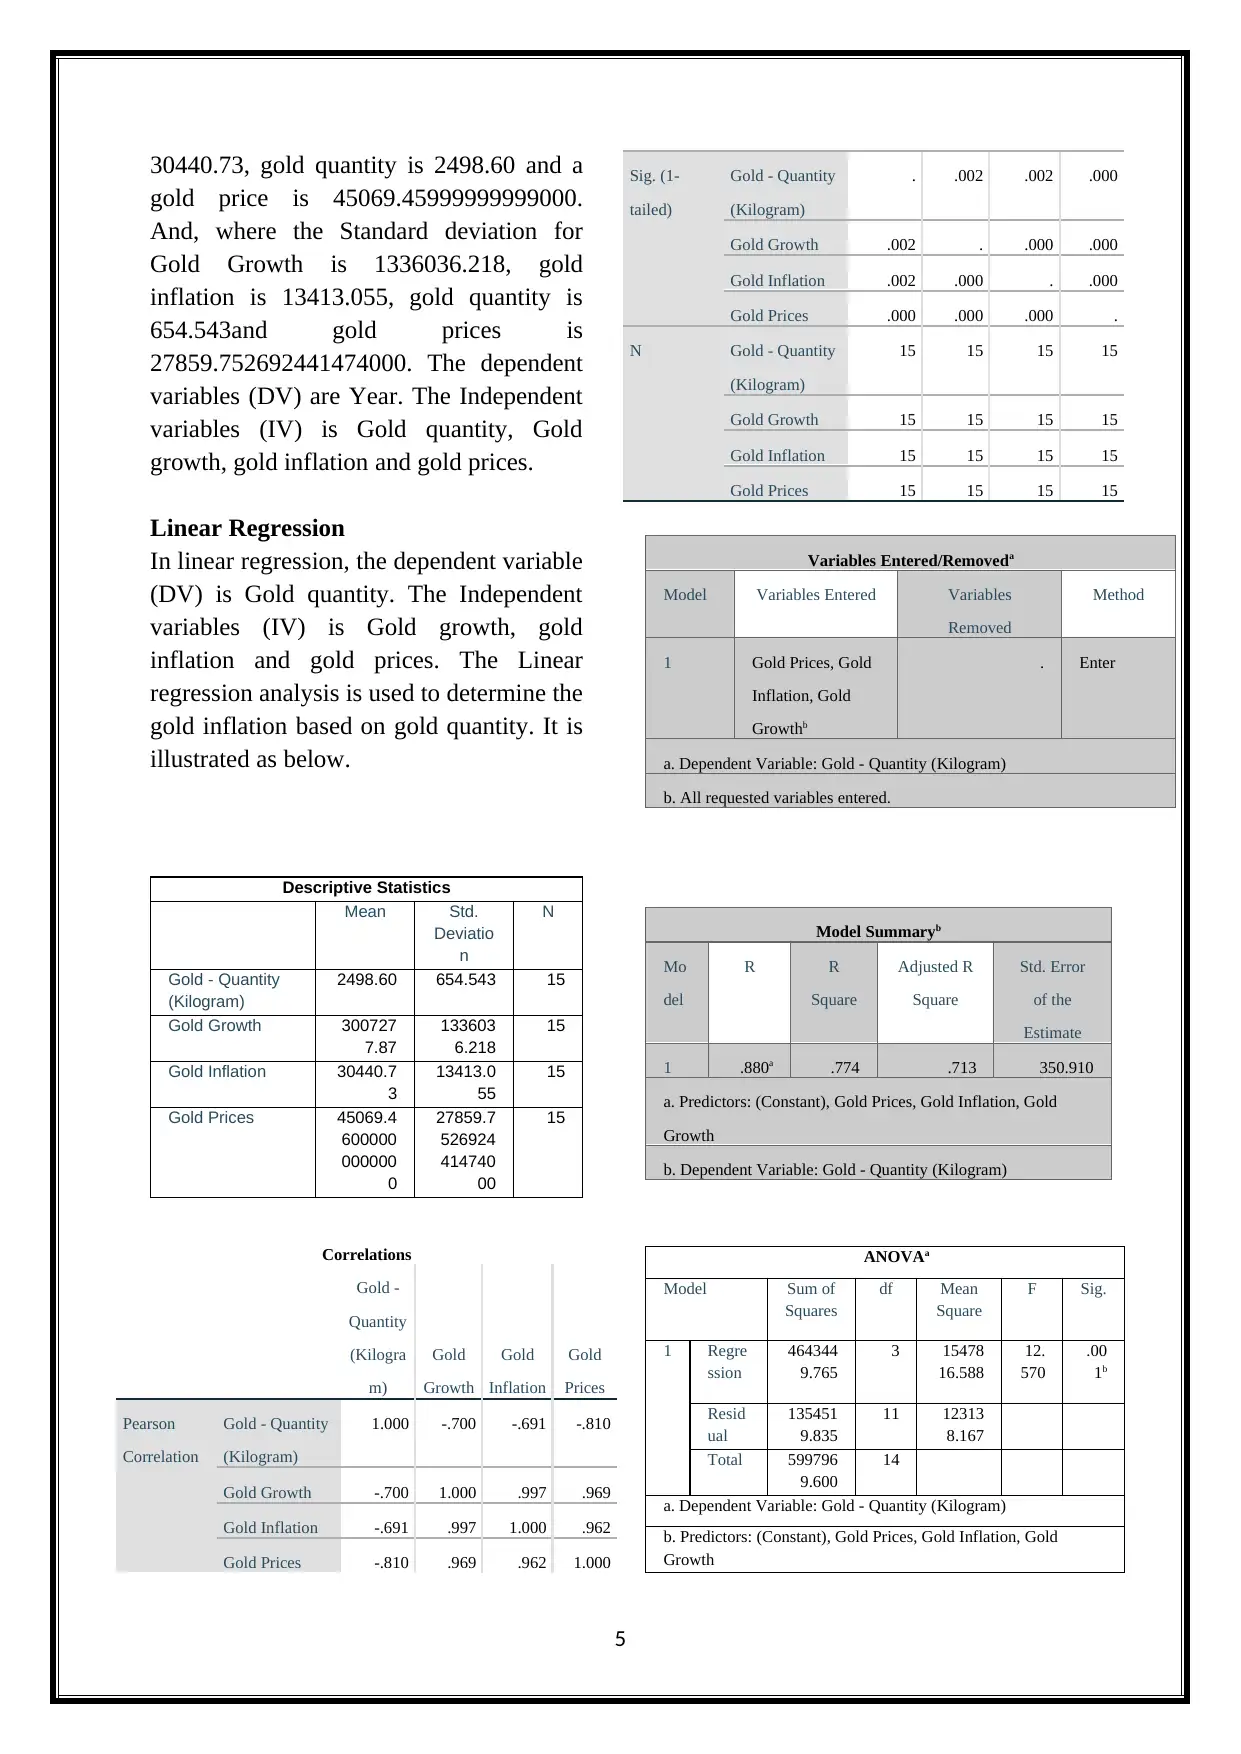
30440.73, gold quantity is 2498.60 and a
gold price is 45069.45999999999000.
And, where the Standard deviation for
Gold Growth is 1336036.218, gold
inflation is 13413.055, gold quantity is
654.543and gold prices is
27859.752692441474000. The dependent
variables (DV) are Year. The Independent
variables (IV) is Gold quantity, Gold
growth, gold inflation and gold prices.
Linear Regression
In linear regression, the dependent variable
(DV) is Gold quantity. The Independent
variables (IV) is Gold growth, gold
inflation and gold prices. The Linear
regression analysis is used to determine the
gold inflation based on gold quantity. It is
illustrated as below.
Descriptive Statistics
Mean Std.
Deviatio
n
N
Gold - Quantity
(Kilogram)
2498.60 654.543 15
Gold Growth 300727
7.87
133603
6.218
15
Gold Inflation 30440.7
3
13413.0
55
15
Gold Prices 45069.4
600000
000000
0
27859.7
526924
414740
00
15
Correlations
Gold -
Quantity
(Kilogra
m)
Gold
Growth
Gold
Inflation
Gold
Prices
Pearson
Correlation
Gold - Quantity
(Kilogram)
1.000 -.700 -.691 -.810
Gold Growth -.700 1.000 .997 .969
Gold Inflation -.691 .997 1.000 .962
Gold Prices -.810 .969 .962 1.000
Sig. (1-
tailed)
Gold - Quantity
(Kilogram)
. .002 .002 .000
Gold Growth .002 . .000 .000
Gold Inflation .002 .000 . .000
Gold Prices .000 .000 .000 .
N Gold - Quantity
(Kilogram)
15 15 15 15
Gold Growth 15 15 15 15
Gold Inflation 15 15 15 15
Gold Prices 15 15 15 15
Variables Entered/Removeda
Model Variables Entered Variables
Removed
Method
1 Gold Prices, Gold
Inflation, Gold
Growthb
. Enter
a. Dependent Variable: Gold - Quantity (Kilogram)
b. All requested variables entered.
Model Summaryb
Mo
del
R R
Square
Adjusted R
Square
Std. Error
of the
Estimate
1 .880a .774 .713 350.910
a. Predictors: (Constant), Gold Prices, Gold Inflation, Gold
Growth
b. Dependent Variable: Gold - Quantity (Kilogram)
ANOVAa
Model Sum of
Squares
df Mean
Square
F Sig.
1 Regre
ssion
464344
9.765
3 15478
16.588
12.
570
.00
1b
Resid
ual
135451
9.835
11 12313
8.167
Total 599796
9.600
14
a. Dependent Variable: Gold - Quantity (Kilogram)
b. Predictors: (Constant), Gold Prices, Gold Inflation, Gold
Growth
5
Coefficientsa
Model Unstandard
ized
Coefficient
s
Sta
nda
rdiz
ed
Coe
ffic
ient
s
t S
i
g
.
95.0%
Confidence
Interval for
B
B St
d.
Err
or
Bet
a
Lo
wer
Bo
und
Up
per
Bo
und
1 (C
ons
tan
t)
27
36.
33
3
31
3.5
24
8
.
7
2
8
.
0
0
0
204
6.2
72
342
6.3
93
Go
ld
Gr
ow
th
.00
1
.00
1
1.5
02
.
7
3
1
.
4
8
0
-.00
1
.00
3
Go
ld
Infl
ati
on
-.0
05
.09
1
-.11
2
-
.
0
6
0
.
9
5
3
-.20
6
.19
6
Go
ld
Pri
ces
-.0
51
.01
4
-
2.1
58
-
3
.
6
6
5
.
0
0
4
-.08
1
-.02
0
a. Dependent Variable: Gold - Quantity (Kilogram)
Residuals Statisticsa
Min
imu
m
Ma
xim
um
Me
an
Std.
Deviati
on
N
Predicted
Value
142
1.8
1
318
9.12
249
8.6
0
575.91
2
15
Residual -
503
.64
5
459.
120
.00
0
311.04
9
15
Std.
Predicted
Value
-
1.8
70
1.19
9
.00
0
1.000 15
Std.
Residual
-
1.4
35
1.30
8
.00
0
.886 15
a. Dependent Variable: Gold - Quantity (Kilogram)
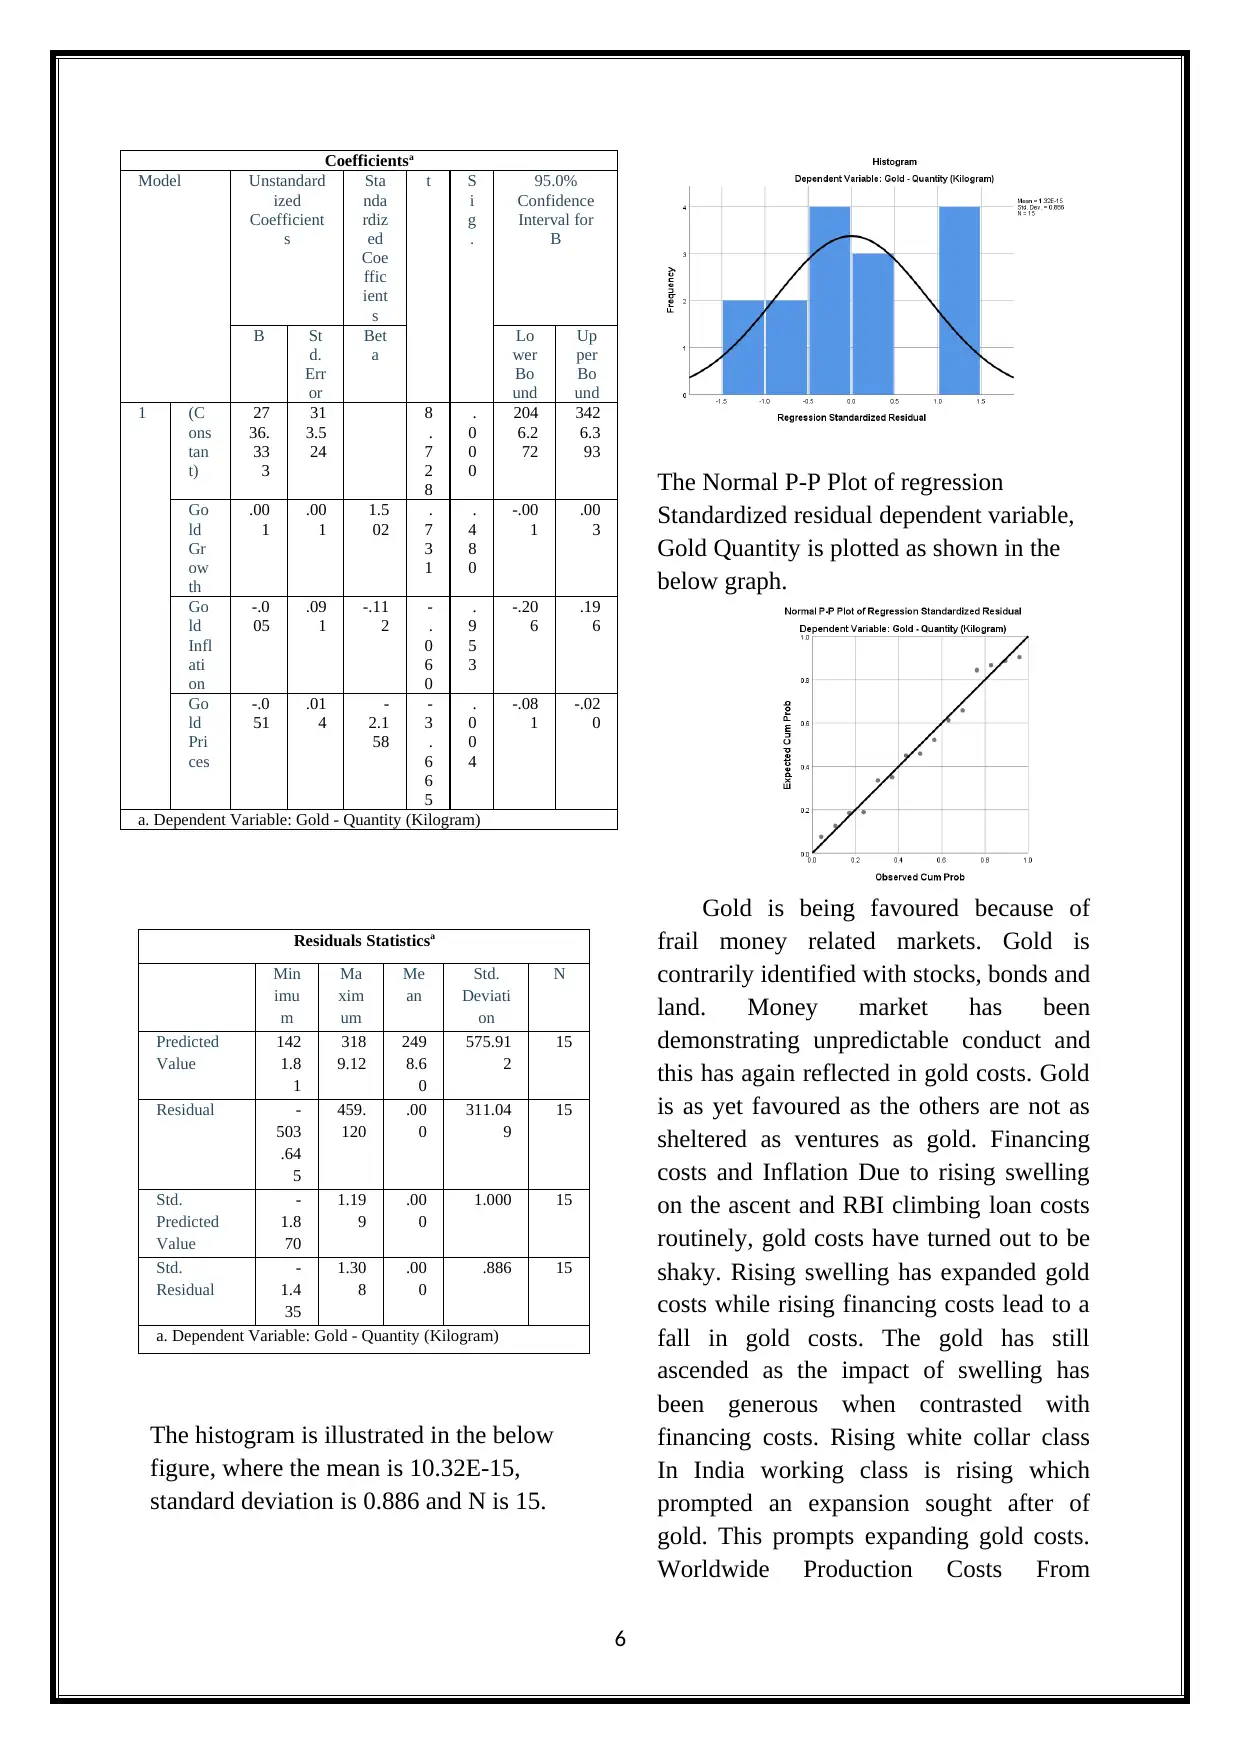
The histogram is illustrated in the below
figure, where the mean is 10.32E-15,
standard deviation is 0.886 and N is 15.
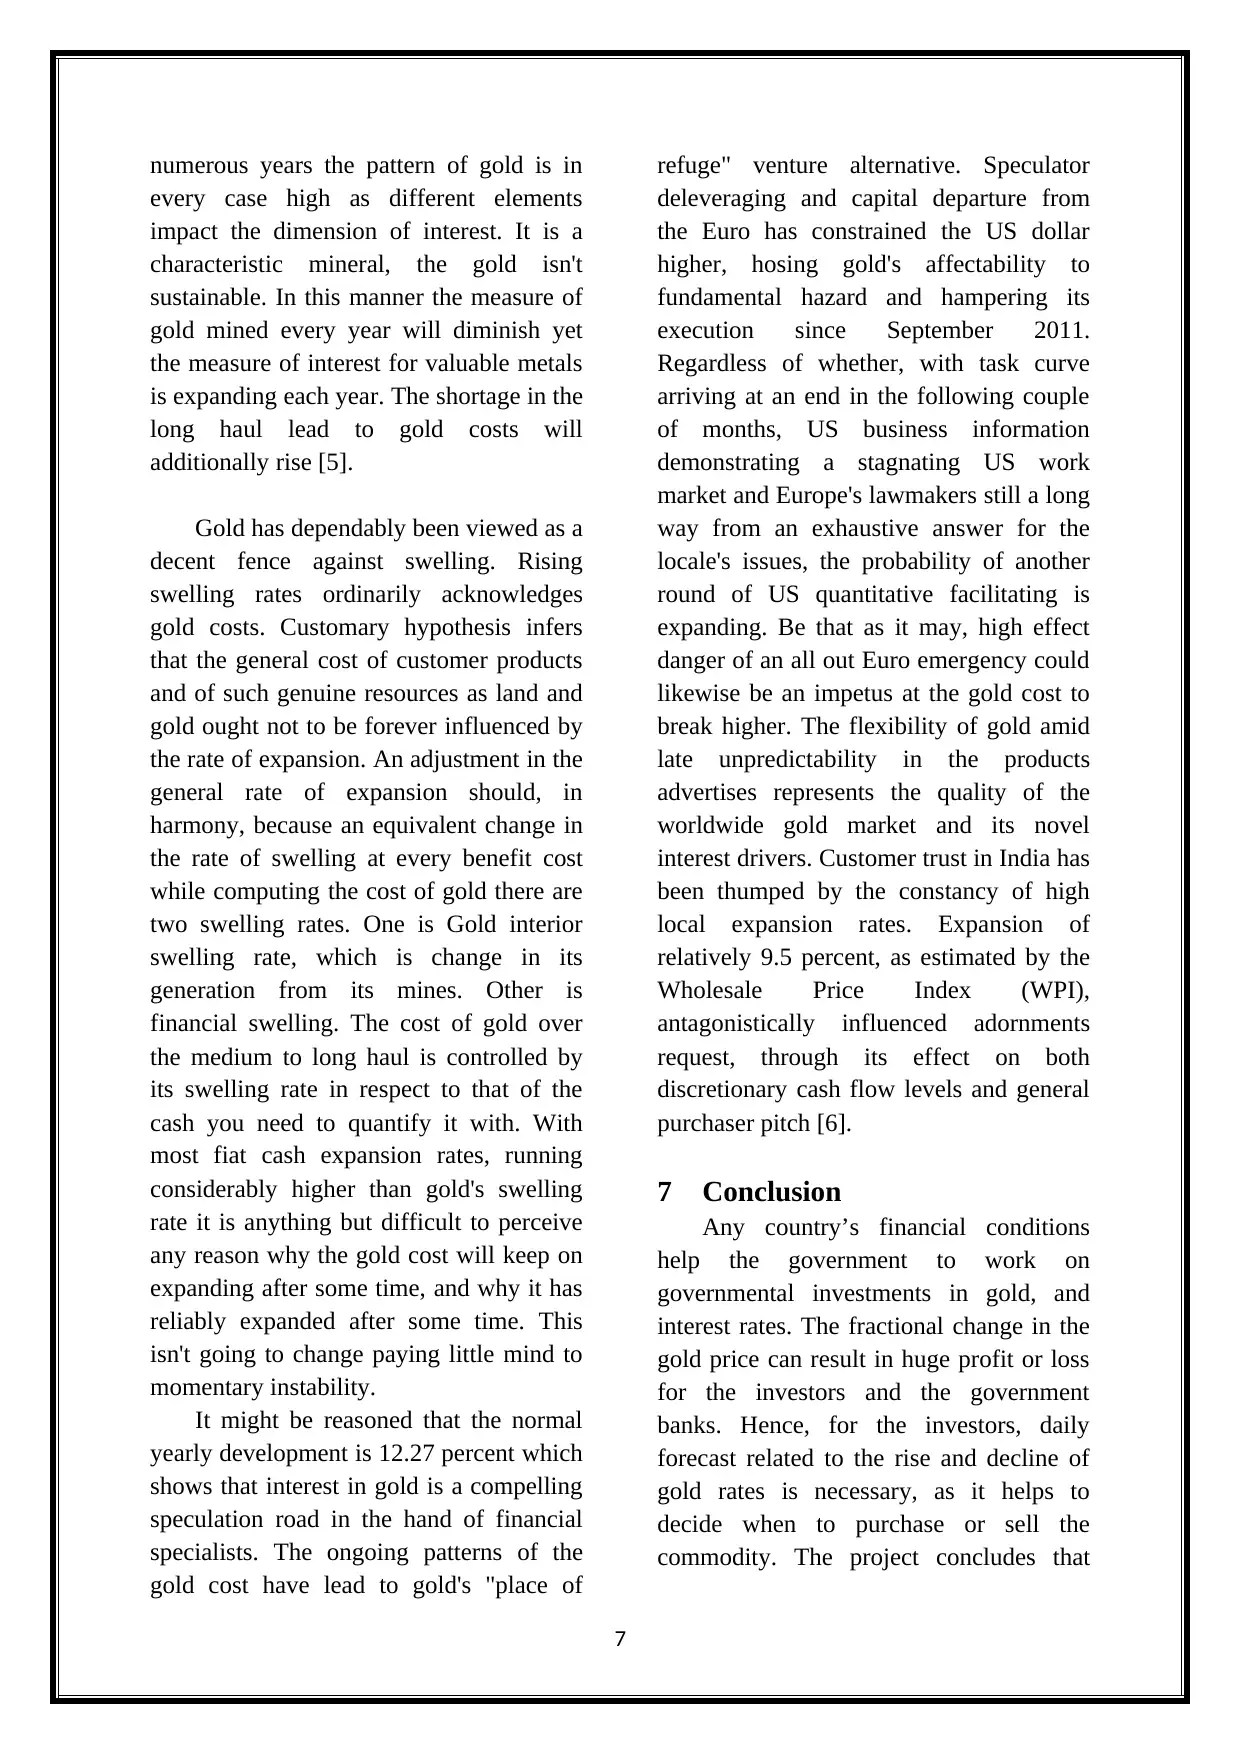
The Normal P-P Plot of regression
Standardized residual dependent variable,
Gold Quantity is plotted as shown in the
below graph.
Gold is being favoured because of
frail money related markets. Gold is
contrarily identified with stocks, bonds and
land. Money market has been
demonstrating unpredictable conduct and
this has again reflected in gold costs. Gold
is as yet favoured as the others are not as
sheltered as ventures as gold. Financing
costs and Inflation Due to rising swelling
on the ascent and RBI climbing loan costs
routinely, gold costs have turned out to be
shaky. Rising swelling has expanded gold
costs while rising financing costs lead to a
fall in gold costs. The gold has still
ascended as the impact of swelling has
been generous when contrasted with
financing costs. Rising white collar class
In India working class is rising which
prompted an expansion sought after of
gold. This prompts expanding gold costs.
Worldwide Production Costs From
6
Model Unstandard
ized
Coefficient
s
Sta
nda
rdiz
ed
Coe
ffic
ient
s
t S
i
g
.
95.0%
Confidence
Interval for
B
B St
d.
Err
or
Bet
a
Lo
wer
Bo
und
Up
per
Bo
und
1 (C
ons
tan
t)
27
36.
33
3
31
3.5
24
8
.
7
2
8
.
0
0
0
204
6.2
72
342
6.3
93
Go
ld
Gr
ow
th
.00
1
.00
1
1.5
02
.
7
3
1
.
4
8
0
-.00
1
.00
3
Go
ld
Infl
ati
on
-.0
05
.09
1
-.11
2
-
.
0
6
0
.
9
5
3
-.20
6
.19
6
Go
ld
Pri
ces
-.0
51
.01
4
-
2.1
58
-
3
.
6
6
5
.
0
0
4
-.08
1
-.02
0
a. Dependent Variable: Gold - Quantity (Kilogram)
Residuals Statisticsa
Min
imu
m
Ma
xim
um
Me
an
Std.
Deviati
on
N
Predicted
Value
142
1.8
1
318
9.12
249
8.6
0
575.91
2
15
Residual -
503
.64
5
459.
120
.00
0
311.04
9
15
Std.
Predicted
Value
-
1.8
70
1.19
9
.00
0
1.000 15
Std.
Residual
-
1.4
35
1.30
8
.00
0
.886 15
a. Dependent Variable: Gold - Quantity (Kilogram)
The histogram is illustrated in the below
figure, where the mean is 10.32E-15,
standard deviation is 0.886 and N is 15.
The Normal P-P Plot of regression
Standardized residual dependent variable,
Gold Quantity is plotted as shown in the
below graph.
Gold is being favoured because of
frail money related markets. Gold is
contrarily identified with stocks, bonds and
land. Money market has been
demonstrating unpredictable conduct and
this has again reflected in gold costs. Gold
is as yet favoured as the others are not as
sheltered as ventures as gold. Financing
costs and Inflation Due to rising swelling
on the ascent and RBI climbing loan costs
routinely, gold costs have turned out to be
shaky. Rising swelling has expanded gold
costs while rising financing costs lead to a
fall in gold costs. The gold has still
ascended as the impact of swelling has
been generous when contrasted with
financing costs. Rising white collar class
In India working class is rising which
prompted an expansion sought after of
gold. This prompts expanding gold costs.
Worldwide Production Costs From
6
Paraphrase This Document
Need a fresh take? Get an instant paraphrase of this document with our AI Paraphraser
numerous years the pattern of gold is in
every case high as different elements
impact the dimension of interest. It is a
characteristic mineral, the gold isn't
sustainable. In this manner the measure of
gold mined every year will diminish yet
the measure of interest for valuable metals
is expanding each year. The shortage in the
long haul lead to gold costs will
additionally rise [5].
Gold has dependably been viewed as a
decent fence against swelling. Rising
swelling rates ordinarily acknowledges
gold costs. Customary hypothesis infers
that the general cost of customer products
and of such genuine resources as land and
gold ought not to be forever influenced by
the rate of expansion. An adjustment in the
general rate of expansion should, in
harmony, because an equivalent change in
the rate of swelling at every benefit cost
while computing the cost of gold there are
two swelling rates. One is Gold interior
swelling rate, which is change in its
generation from its mines. Other is
financial swelling. The cost of gold over
the medium to long haul is controlled by
its swelling rate in respect to that of the
cash you need to quantify it with. With
most fiat cash expansion rates, running
considerably higher than gold's swelling
rate it is anything but difficult to perceive
any reason why the gold cost will keep on
expanding after some time, and why it has
reliably expanded after some time. This
isn't going to change paying little mind to
momentary instability.
It might be reasoned that the normal
yearly development is 12.27 percent which
shows that interest in gold is a compelling
speculation road in the hand of financial
specialists. The ongoing patterns of the
gold cost have lead to gold's "place of
refuge" venture alternative. Speculator
deleveraging and capital departure from
the Euro has constrained the US dollar
higher, hosing gold's affectability to
fundamental hazard and hampering its
execution since September 2011.
Regardless of whether, with task curve
arriving at an end in the following couple
of months, US business information
demonstrating a stagnating US work
market and Europe's lawmakers still a long
way from an exhaustive answer for the
locale's issues, the probability of another
round of US quantitative facilitating is
expanding. Be that as it may, high effect
danger of an all out Euro emergency could
likewise be an impetus at the gold cost to
break higher. The flexibility of gold amid
late unpredictability in the products
advertises represents the quality of the
worldwide gold market and its novel
interest drivers. Customer trust in India has
been thumped by the constancy of high
local expansion rates. Expansion of
relatively 9.5 percent, as estimated by the
Wholesale Price Index (WPI),
antagonistically influenced adornments
request, through its effect on both
discretionary cash flow levels and general
purchaser pitch [6].
7 Conclusion
Any country’s financial conditions
help the government to work on
governmental investments in gold, and
interest rates. The fractional change in the
gold price can result in huge profit or loss
for the investors and the government
banks. Hence, for the investors, daily
forecast related to the rise and decline of
gold rates is necessary, as it helps to
decide when to purchase or sell the
commodity. The project concludes that
7
there exists certain factors which
significantly influences the gold price in
India, for stabilizing the Indian gold
market. The objectives of this project is
met, as the data mining techniques like,
classification, clustering, regression
methods, decision tree, are utilized for
predicting the fluctuation of gold price in
the Indian market, for a certain period.
Then, the reading negative consequences,
and finds the other factors which could
affect the fluctuation of price. The
evidence base is presented. This report
also projects the role played by the
commodity (gold) in the Indian Market.
Gold is always believed to be the safe
option by the investors. Moreover, the
demand and price of gold can increase
during the political chaos, when compared
to the peaceful times, which changes the
gold investors and customers’ views on
India, about the price fluctuation. This
project predict the gold prices, accurately.
It is observed that this project includes
risks like, inflation, monetary policy,
economic data, supply and-demand and
currency movements, as these factors
fluctuates the gold price. Additionally, it is
understood that, the historical data has
proofs which shows that the commodity-
gold was used as a form of currency in
several countries. The country’s financial
strength is assessed by, gold. This
commodity is sold and purchased by some
countries, whereas India is among those
countries which buys gold. It is agreed
that, in contrast to various alternative
investment options, the gold investment is
a safe investment, for the investors, as gold
has the capacity to bear the in-built
investment risks.
References
[1]D. Hankerson, G. Harris and P.
Johnson, Introduction to information
theory and data compression. Boca
Raton, Fla.: Chapman & Hall/CRC
Press, 2010.
[2]D. Dr. Sindhu, "A study on impact of
select factors on the price of
Gold", IOSR Journal of Business and
Management, vol. 8, no. 4, pp. 84-93,
2013.
[3]K. K.S.Nemavathi and D. Dr. V.R
Nedunchezhian, "A Study on Impact
of Price Behaviour of Commodity
Gold and Gold ETF", International
Journal of Scientific Research, vol. 2,
no. 8, pp. 240-241, 2012.
[4]S. Sinha and D. Dutta, "An Assessment
of Impact of Domestic Price of Gold
on NAV of Selected Gold Exchange
Traded Funds", Adhyayan: A Journal
of Management Sciences, vol. 6, no.
1, 2016.
[5]A. Erdoğdu, "The Most Significant
Factors Influencing the Price of Gold:
An Empirical Analysis of the US
Market", Economics World, vol. 5,
no. 5, 2017.
[6]L. Gaspareniene, R. Remeikiene, A.
Sadeckas and R. Ginevicius, "Gold
Investment Incentives: An Empirical
Identification of the Main Gold Price
Determinants and Prognostication of
Gold Price Future
Trends", Economics & Sociology, vol.
11, no. 3, pp. 248-264, 2018.
8

9
1 out of 10
Related Documents


Your All-in-One AI-Powered Toolkit for Academic Success.
+13062052269
info@desklib.com
Available 24*7 on WhatsApp / Email
![[object Object]](/_next/static/media/star-bottom.7253800d.svg)
Unlock your academic potential
© 2024 | Zucol Services PVT LTD | All rights reserved.