Predicting Temperature using Multiple Linear Regression Analysis
VerifiedAdded on 2022/12/27
|17
|3505
|68
Report
AI Summary
This report details a study that aimed to develop a single-point temperature forecast model using Multiple Linear Regression (MLR). The research utilized time series data spanning from April 2006 to September 2016, encompassing 96,453 observational cases. The analysis explored the impact of five key factors: humidity, wind speed, wind bearing, visibility, and pressure on earth’s surface temperature. Results indicated that all five factors significantly influenced temperature, with humidity, wind speed, and pressure exhibiting a negative relationship, and wind bearing and visibility showing a positive correlation. The study employed descriptive statistics, histograms, correlation matrices, scatter plots, covariance analysis, and regression analysis to evaluate the relationships between the variables. The R-squared value of 0.4506 demonstrated that the model explained 45.06% of the variation in temperature. The ANOVA table showed a significant F statistic (p-value = 0.000), indicating the model's overall significance.

Predicting Temperature using linear regression model
Research Methodology
Student Name:
Instructor Name:
Course Number:
5th May 2019
1
Research Methodology
Student Name:
Instructor Name:
Course Number:
5th May 2019
1
Paraphrase This Document
Need a fresh take? Get an instant paraphrase of this document with our AI Paraphraser
ABSTRACT
The main goal of this particular study was to develop a single point temperature forecast model
utilizing Multiple Linear Regression (MLR). Time series data spanning from April 2006 to
September 2016 was utilized. About 96453 observational cases were considered for analysis in
this study. Results showed that all the five factors considered significantly impacted on the
earth’s surface temperature. Three of the factors considered had negative relationship with the
dependent variable (temperature). The factors that had inverse relationship with the dependent
variable (temperature) include humidity, wind speed and pressure. The other two factors (wind
bearing and visibility) had positive relationship with dependent variable (temperature).
INTRODUCTION
Our day to day lives (including those of other living creatures/organisms) are greatly influenced
by the weather and climate. Especially temperature has significant effect on our lives. Thousands
of lives all over the world are taken away every year more so during summer. More than five
hundred thousand chickens died in Georgia alone amid a two-day time span at the pinnacle of the
summer heat (Donald, 2011).
Estimation of timely and accurate temperature is necessary in helping to take prudent steps
(Christoph, et al., 2009). Precise count of what the atmosphere will do in the coming days is
quite challenging based on the fact that the atmospheric environment is dynamic in influencing
the observed of the earth surface (Shengpan, et al., 2012). The goal of this investigation is to
create single point temperature forecast model utilizing Multiple Linear Regression (MLR).
Academic Community has over the past recommended numerous both linear and no-linear
2
techniques of predicting temperature, yet at the same time MLR has always been chosen based
on the fact that linear models frequently produce preferable estimates over non-linear models
notwithstanding when the given data is non-linear (Chatfield, 2009) and furthermore factual
plans require little calculation time to make a prediction (Dhawal & Mishra, 2016).
METHODOLOGY
A time series data was collected to enable answer the research question. Multiple linear
regression (MLR) was employed to try and predict the temperature using factors such as
humidity, wind speed, wind bearing, visibility and pressure.
Other statistical measures performed include the Pearson correlation test between the variables.
The following regression equation model was estimated.
y=β0 + β1 x1 + β2 x2 + β3 x3 + β4 x4 + β5 x5 +ε
Where we have the variables as follows;
y=Temperature , x1 =humidity , x2=wind speed ( km
h ), x3=wind bearing ( degrees ) , x4 =visibility ( km )∧x5= pressur
β0=Intercpt coefficient , β1=coefficient for the humidity , β2=coefficient for the wind speed , β3=coefficient for win
DATA
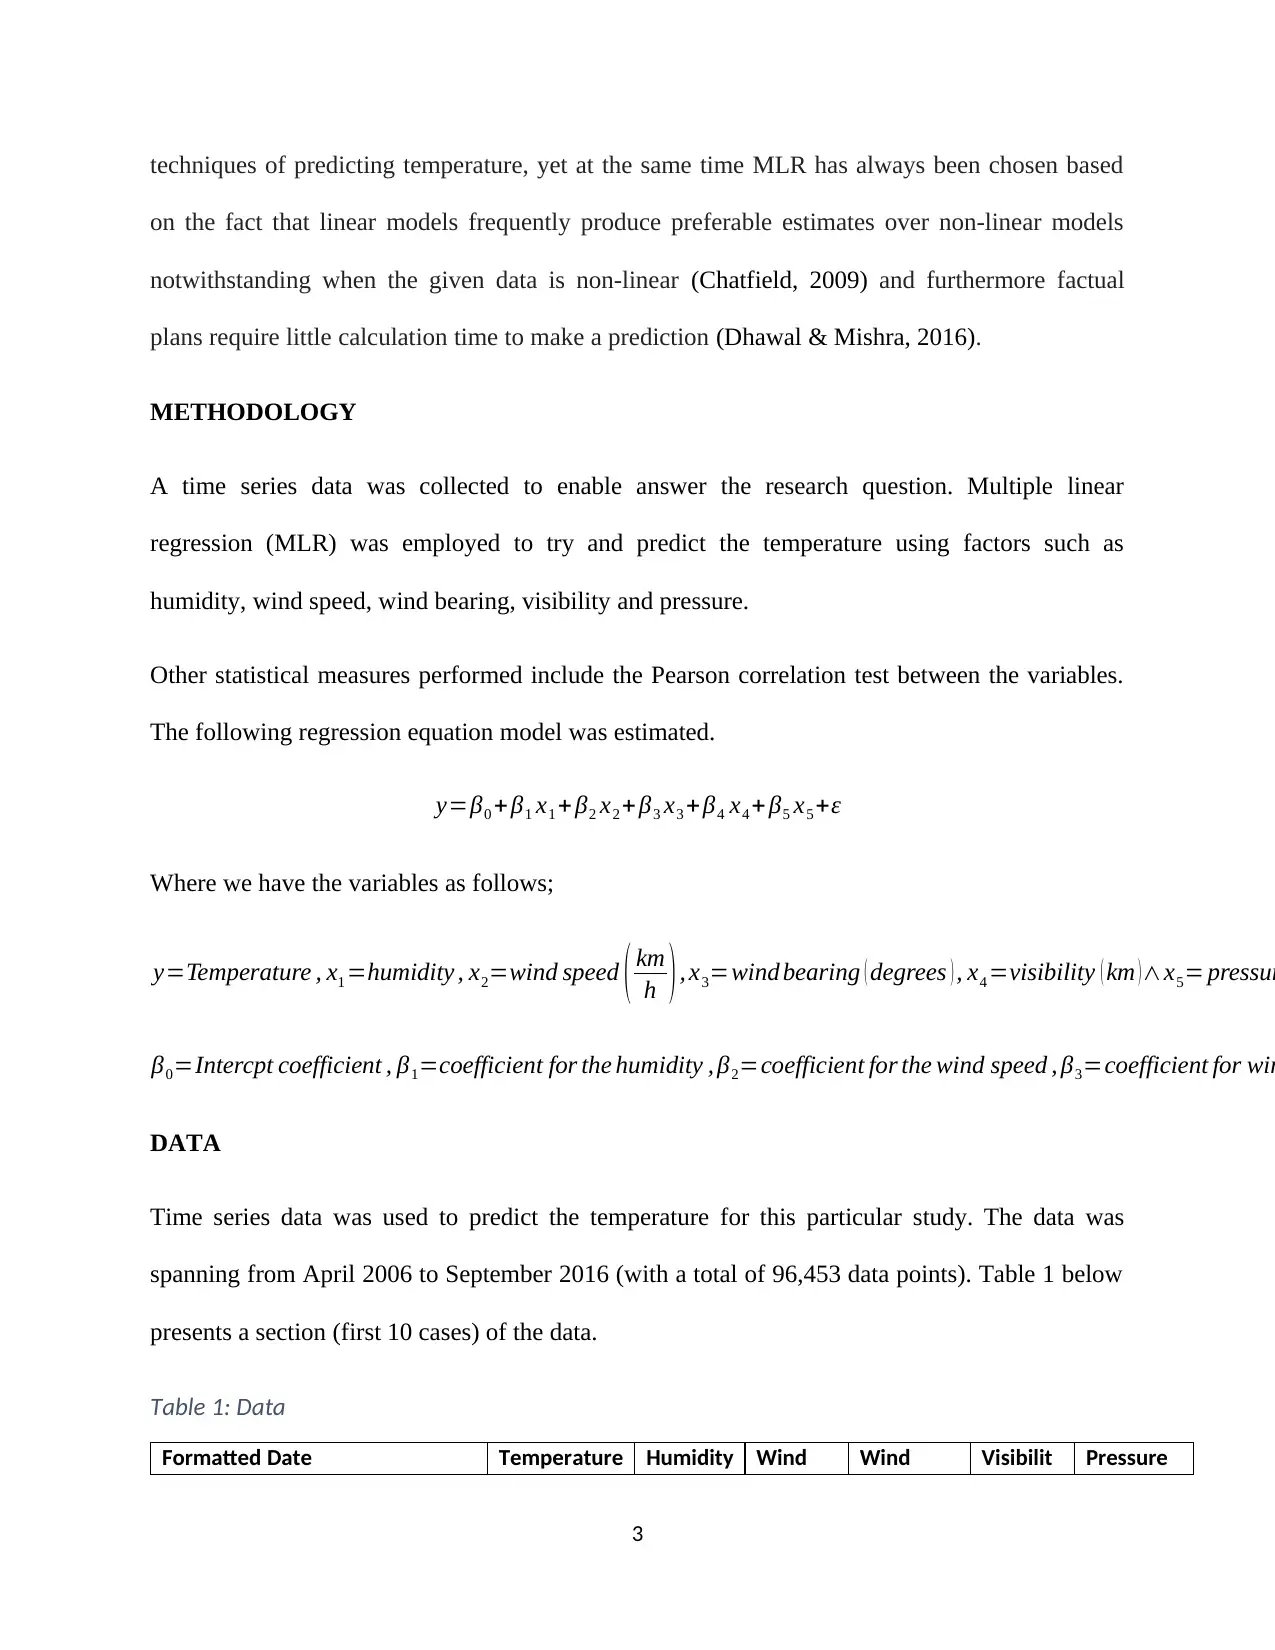
Time series data was used to predict the temperature for this particular study. The data was
spanning from April 2006 to September 2016 (with a total of 96,453 data points). Table 1 below
presents a section (first 10 cases) of the data.
Table 1: Data
Formatted Date Temperature Humidity Wind Wind Visibilit Pressure
3
on the fact that linear models frequently produce preferable estimates over non-linear models
notwithstanding when the given data is non-linear (Chatfield, 2009) and furthermore factual
plans require little calculation time to make a prediction (Dhawal & Mishra, 2016).
METHODOLOGY
A time series data was collected to enable answer the research question. Multiple linear
regression (MLR) was employed to try and predict the temperature using factors such as
humidity, wind speed, wind bearing, visibility and pressure.
Other statistical measures performed include the Pearson correlation test between the variables.
The following regression equation model was estimated.
y=β0 + β1 x1 + β2 x2 + β3 x3 + β4 x4 + β5 x5 +ε
Where we have the variables as follows;
y=Temperature , x1 =humidity , x2=wind speed ( km
h ), x3=wind bearing ( degrees ) , x4 =visibility ( km )∧x5= pressur
β0=Intercpt coefficient , β1=coefficient for the humidity , β2=coefficient for the wind speed , β3=coefficient for win
DATA
Time series data was used to predict the temperature for this particular study. The data was
spanning from April 2006 to September 2016 (with a total of 96,453 data points). Table 1 below
presents a section (first 10 cases) of the data.
Table 1: Data
Formatted Date Temperature Humidity Wind Wind Visibilit Pressure
3
⊘ This is a preview!⊘
Do you want full access?
Subscribe today to unlock all pages.
Trusted by 1+ million students worldwide
(C) Speed
(km/h)
Bearing
(degrees)
y (km) (millibars)
2006-04-01 00:00:00.000 +0200 9.472222 0.89 14.1197 251 15.8263 1015.13
2006-04-01 01:00:00.000 +0200 9.355556 0.86 14.2646 259 15.8263 1015.63
2006-04-01 02:00:00.000 +0200 9.377778 0.89 3.9284 204 14.9569 1015.94
2006-04-01 03:00:00.000 +0200 8.288889 0.83 14.1036 269 15.8263 1016.41
2006-04-01 04:00:00.000 +0200 8.755556 0.83 11.0446 259 15.8263 1016.51
2006-04-01 05:00:00.000 +0200 9.222222 0.85 13.9587 258 14.9569 1016.66
2006-04-01 06:00:00.000 +0200 7.733333 0.95 12.3648 259 9.982 1016.72
2006-04-01 07:00:00.000 +0200 8.772222 0.89 14.1519 260 9.982 1016.84
2006-04-01 08:00:00.000 +0200 10.82222 0.82 11.3183 259 9.982 1017.37
2006-04-01 09:00:00.000 +0200 13.77222 0.72 12.5258 279 9.982 1017.22
STATISTICAL DATA ANALYSIS:
Descriptive Statistics
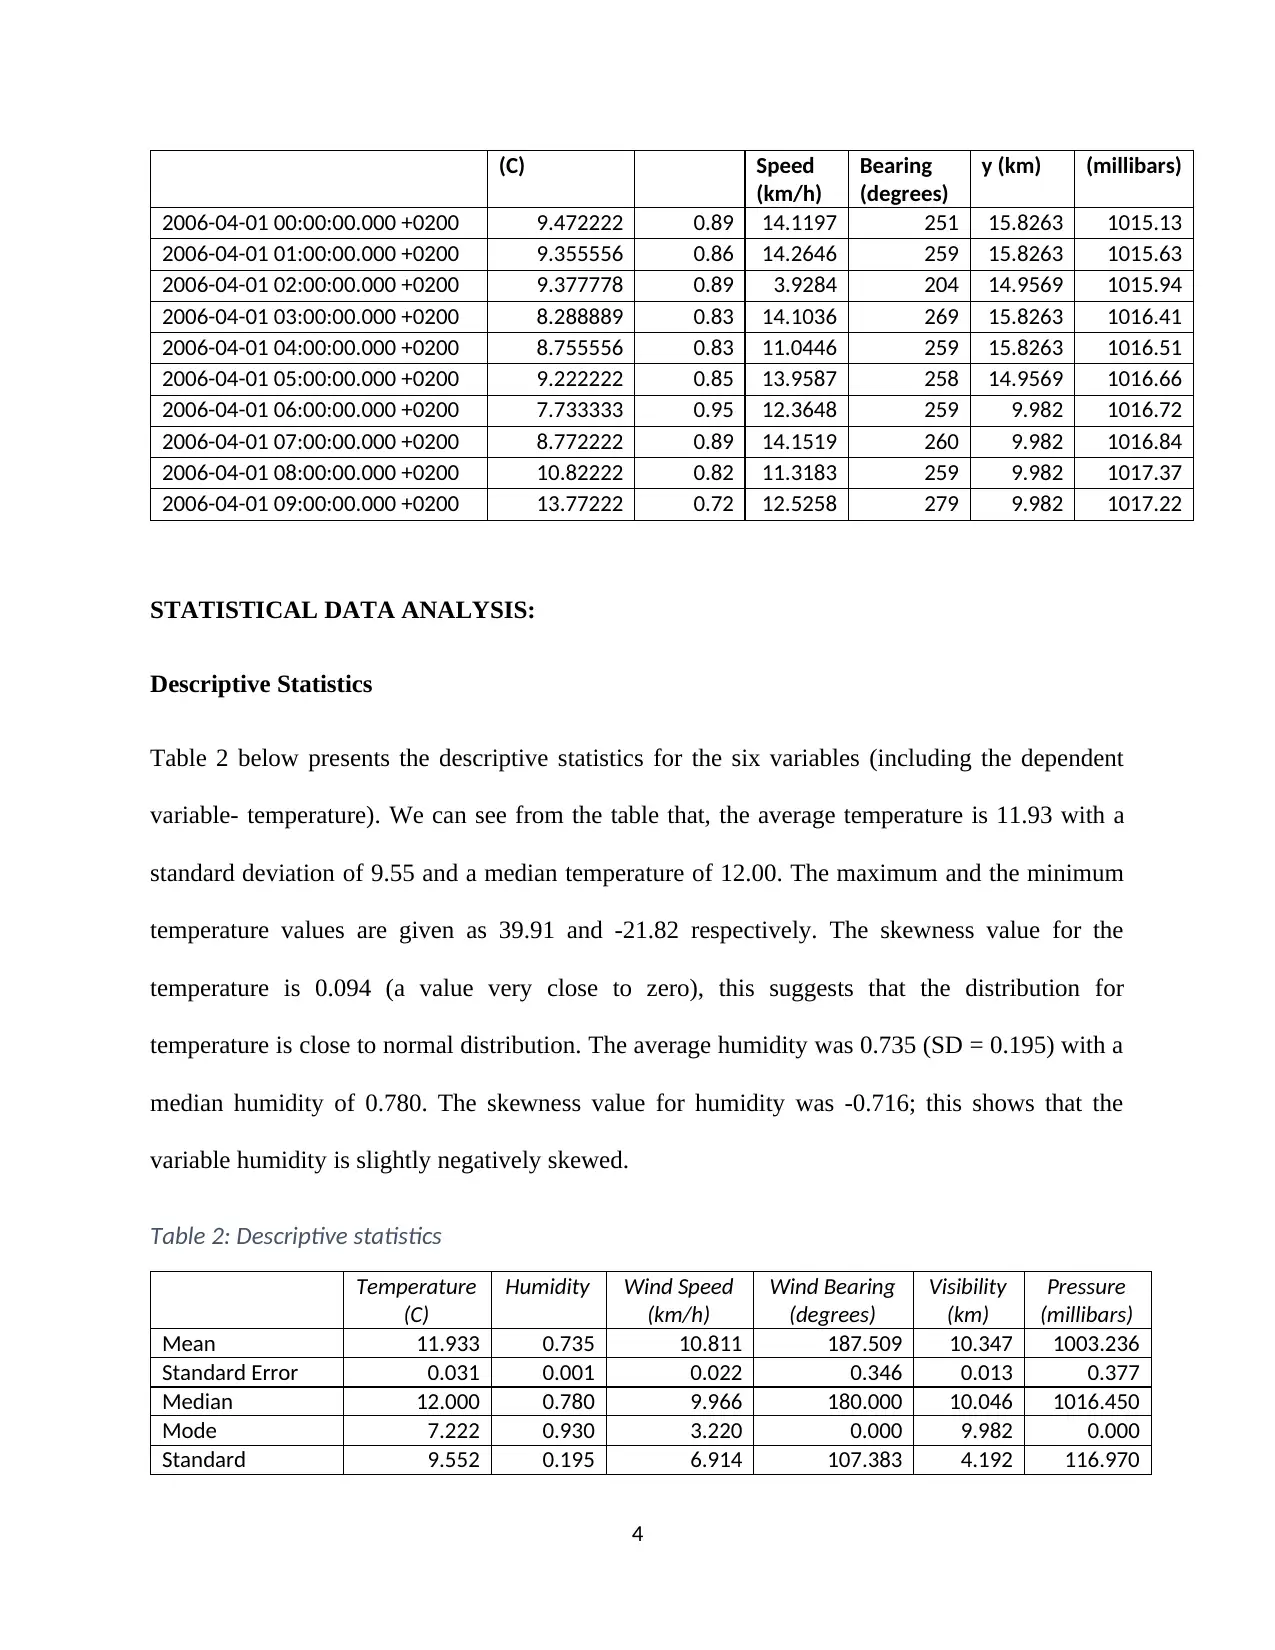
Table 2 below presents the descriptive statistics for the six variables (including the dependent
variable- temperature). We can see from the table that, the average temperature is 11.93 with a
standard deviation of 9.55 and a median temperature of 12.00. The maximum and the minimum
temperature values are given as 39.91 and -21.82 respectively. The skewness value for the
temperature is 0.094 (a value very close to zero), this suggests that the distribution for
temperature is close to normal distribution. The average humidity was 0.735 (SD = 0.195) with a
median humidity of 0.780. The skewness value for humidity was -0.716; this shows that the
variable humidity is slightly negatively skewed.
Table 2: Descriptive statistics
Temperature
(C)
Humidity Wind Speed
(km/h)
Wind Bearing
(degrees)
Visibility
(km)
Pressure
(millibars)
Mean 11.933 0.735 10.811 187.509 10.347 1003.236
Standard Error 0.031 0.001 0.022 0.346 0.013 0.377
Median 12.000 0.780 9.966 180.000 10.046 1016.450
Mode 7.222 0.930 3.220 0.000 9.982 0.000
Standard 9.552 0.195 6.914 107.383 4.192 116.970
4
(km/h)
Bearing
(degrees)
y (km) (millibars)
2006-04-01 00:00:00.000 +0200 9.472222 0.89 14.1197 251 15.8263 1015.13
2006-04-01 01:00:00.000 +0200 9.355556 0.86 14.2646 259 15.8263 1015.63
2006-04-01 02:00:00.000 +0200 9.377778 0.89 3.9284 204 14.9569 1015.94
2006-04-01 03:00:00.000 +0200 8.288889 0.83 14.1036 269 15.8263 1016.41
2006-04-01 04:00:00.000 +0200 8.755556 0.83 11.0446 259 15.8263 1016.51
2006-04-01 05:00:00.000 +0200 9.222222 0.85 13.9587 258 14.9569 1016.66
2006-04-01 06:00:00.000 +0200 7.733333 0.95 12.3648 259 9.982 1016.72
2006-04-01 07:00:00.000 +0200 8.772222 0.89 14.1519 260 9.982 1016.84
2006-04-01 08:00:00.000 +0200 10.82222 0.82 11.3183 259 9.982 1017.37
2006-04-01 09:00:00.000 +0200 13.77222 0.72 12.5258 279 9.982 1017.22
STATISTICAL DATA ANALYSIS:
Descriptive Statistics
Table 2 below presents the descriptive statistics for the six variables (including the dependent
variable- temperature). We can see from the table that, the average temperature is 11.93 with a
standard deviation of 9.55 and a median temperature of 12.00. The maximum and the minimum
temperature values are given as 39.91 and -21.82 respectively. The skewness value for the
temperature is 0.094 (a value very close to zero), this suggests that the distribution for
temperature is close to normal distribution. The average humidity was 0.735 (SD = 0.195) with a
median humidity of 0.780. The skewness value for humidity was -0.716; this shows that the
variable humidity is slightly negatively skewed.
Table 2: Descriptive statistics
Temperature
(C)
Humidity Wind Speed
(km/h)
Wind Bearing
(degrees)
Visibility
(km)
Pressure
(millibars)
Mean 11.933 0.735 10.811 187.509 10.347 1003.236
Standard Error 0.031 0.001 0.022 0.346 0.013 0.377
Median 12.000 0.780 9.966 180.000 10.046 1016.450
Mode 7.222 0.930 3.220 0.000 9.982 0.000
Standard 9.552 0.195 6.914 107.383 4.192 116.970
4
Paraphrase This Document
Need a fresh take? Get an instant paraphrase of this document with our AI Paraphraser
Deviation
Sample Variance 91.232 0.038 47.797 11531.201 17.574 13681.959
Kurtosis -0.567 -0.462 1.769 -1.132 -0.260 69.269
Skewness 0.094 -0.716 1.113 -0.155 -0.499 -8.423
Range 61.728 1.000 63.853 359.000 16.100 1046.380
Minimum -21.822 0.000 0.000 0.000 0.000 0.000
Maximum 39.906 1.000 63.853 359.000 16.100 1046.380
Sum 1150943 70883.21 1042719 18085828 998030.5 96765118
Count 96453 96453 96453 96453 96453 96453
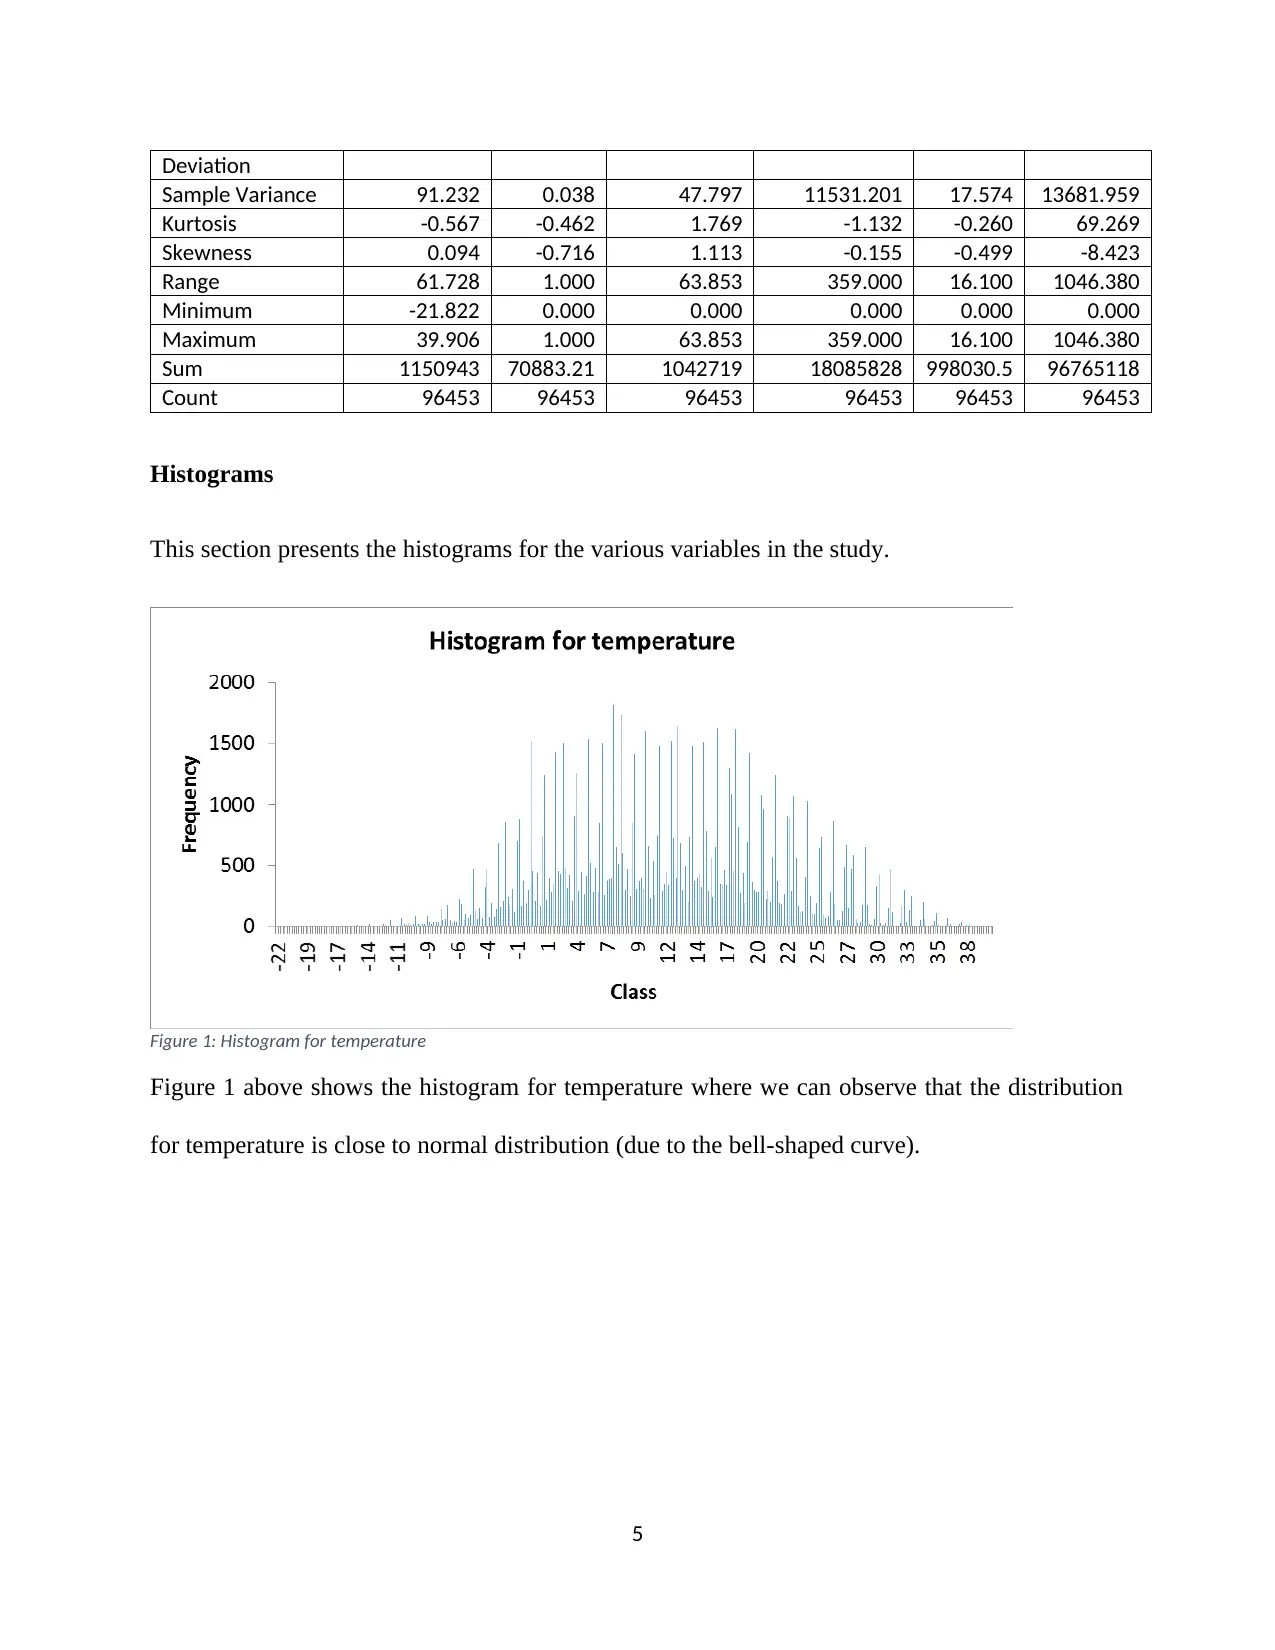
Histograms
This section presents the histograms for the various variables in the study.
Figure 1: Histogram for temperature
Figure 1 above shows the histogram for temperature where we can observe that the distribution
for temperature is close to normal distribution (due to the bell-shaped curve).
5
Sample Variance 91.232 0.038 47.797 11531.201 17.574 13681.959
Kurtosis -0.567 -0.462 1.769 -1.132 -0.260 69.269
Skewness 0.094 -0.716 1.113 -0.155 -0.499 -8.423
Range 61.728 1.000 63.853 359.000 16.100 1046.380
Minimum -21.822 0.000 0.000 0.000 0.000 0.000
Maximum 39.906 1.000 63.853 359.000 16.100 1046.380
Sum 1150943 70883.21 1042719 18085828 998030.5 96765118
Count 96453 96453 96453 96453 96453 96453
Histograms
This section presents the histograms for the various variables in the study.
Figure 1: Histogram for temperature
Figure 1 above shows the histogram for temperature where we can observe that the distribution
for temperature is close to normal distribution (due to the bell-shaped curve).
5
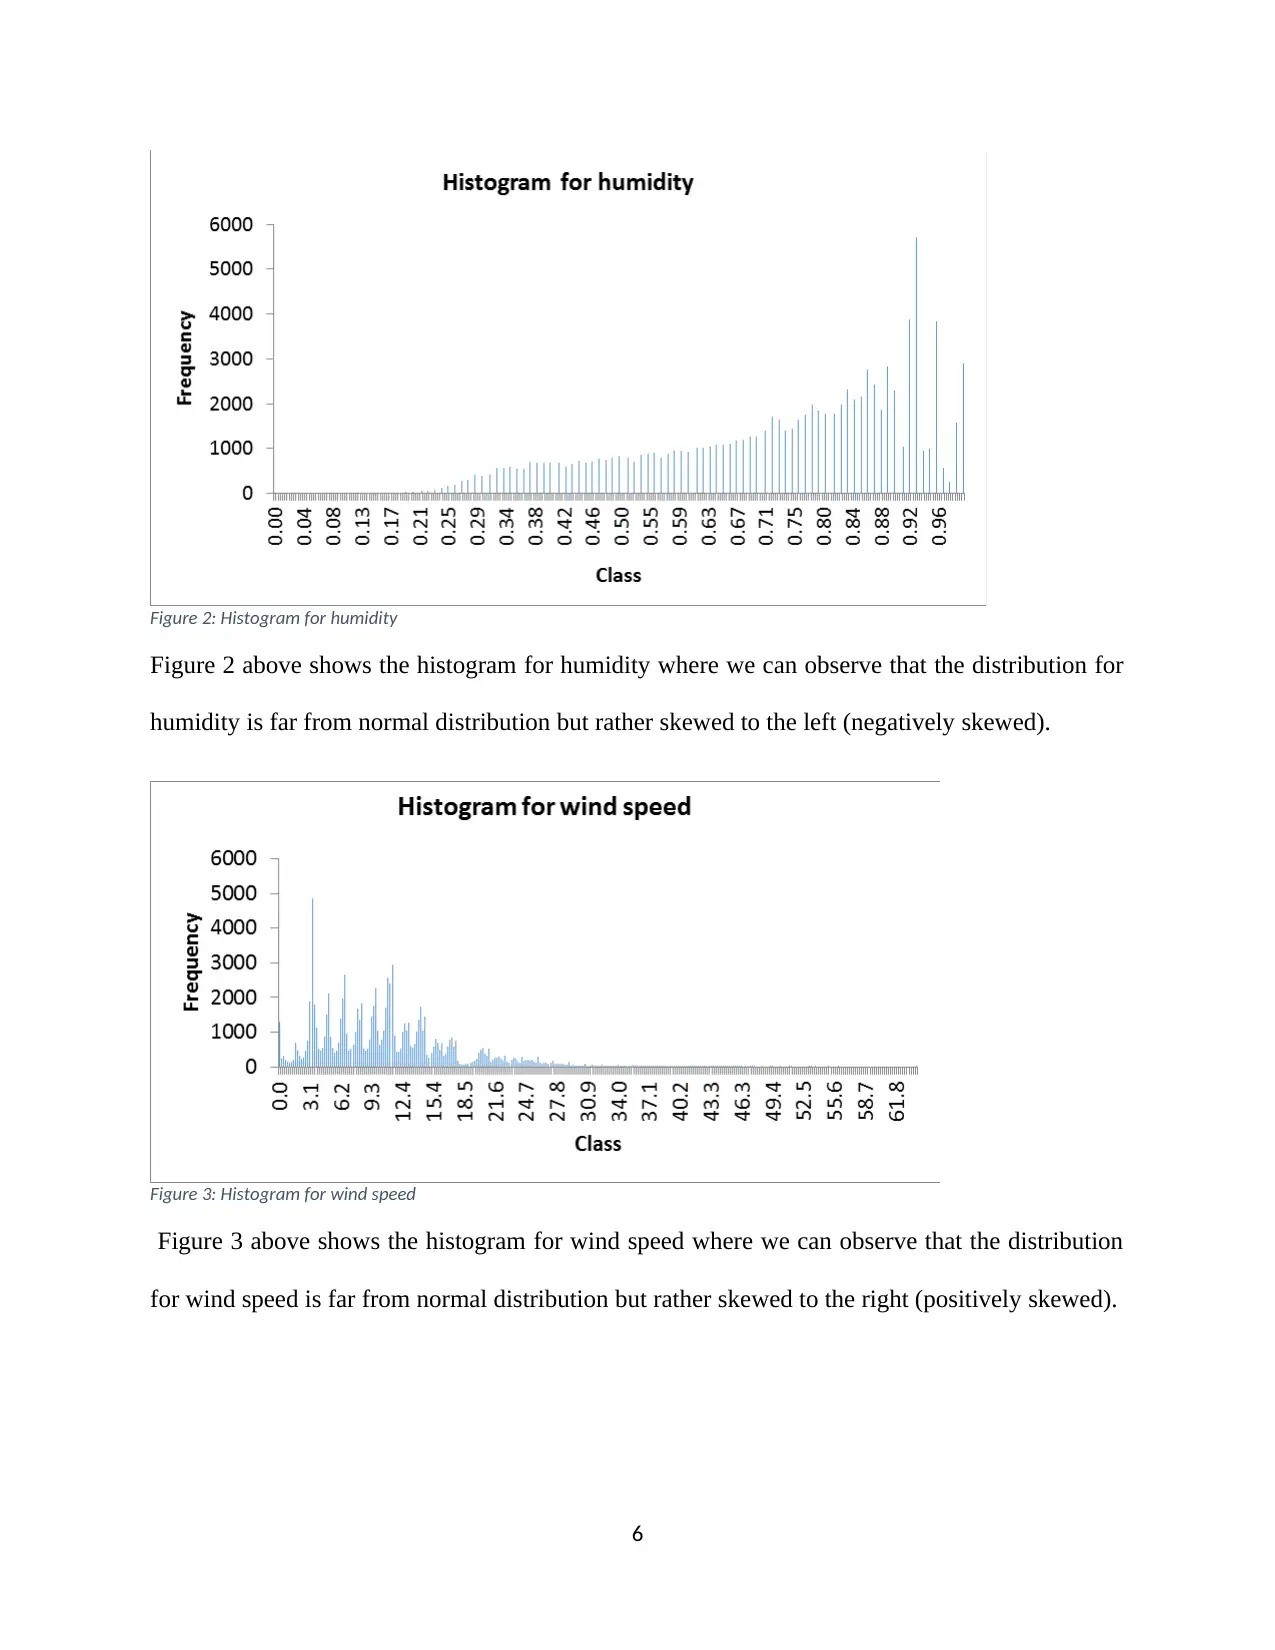
Figure 2: Histogram for humidity
Figure 2 above shows the histogram for humidity where we can observe that the distribution for
humidity is far from normal distribution but rather skewed to the left (negatively skewed).
Figure 3: Histogram for wind speed
Figure 3 above shows the histogram for wind speed where we can observe that the distribution
for wind speed is far from normal distribution but rather skewed to the right (positively skewed).
6
⊘ This is a preview!⊘
Do you want full access?
Subscribe today to unlock all pages.
Trusted by 1+ million students worldwide
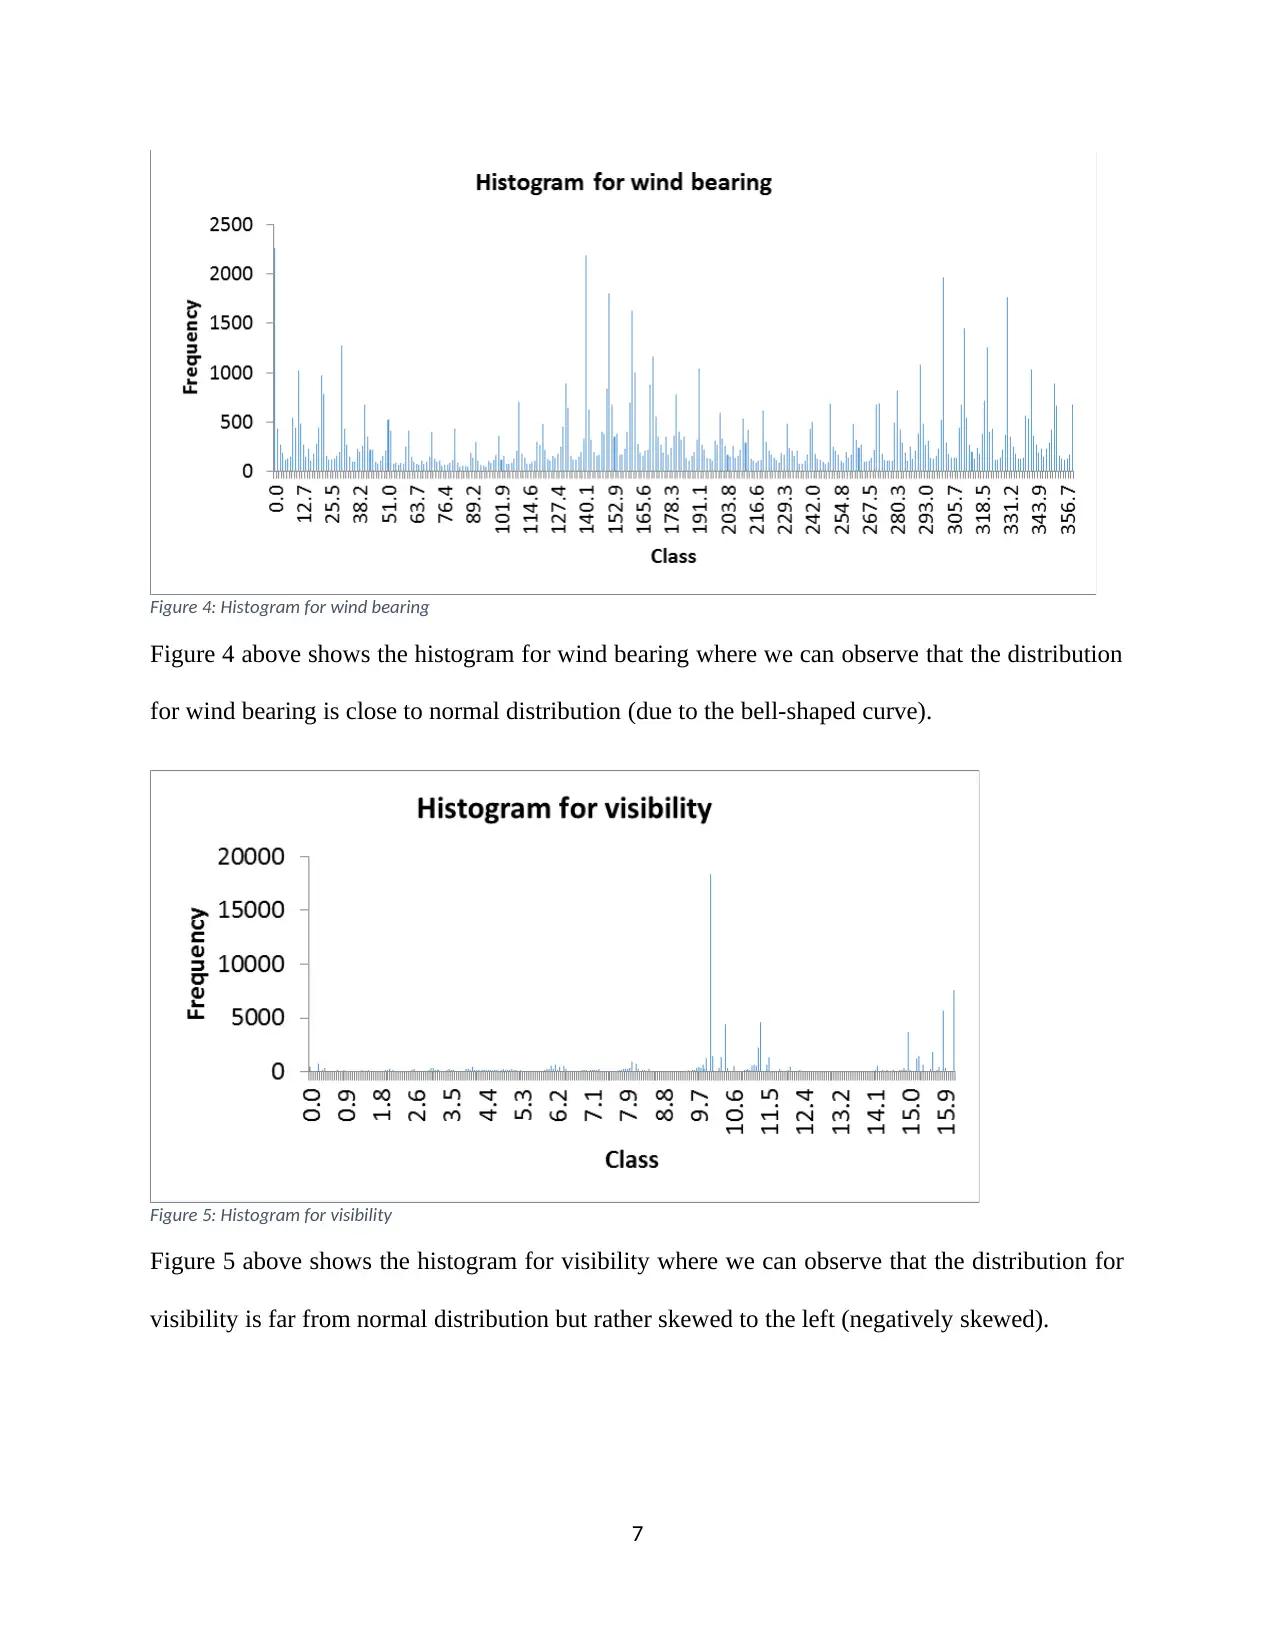
Figure 4: Histogram for wind bearing
Figure 4 above shows the histogram for wind bearing where we can observe that the distribution
for wind bearing is close to normal distribution (due to the bell-shaped curve).
Figure 5: Histogram for visibility
Figure 5 above shows the histogram for visibility where we can observe that the distribution for
visibility is far from normal distribution but rather skewed to the left (negatively skewed).
7
Paraphrase This Document
Need a fresh take? Get an instant paraphrase of this document with our AI Paraphraser
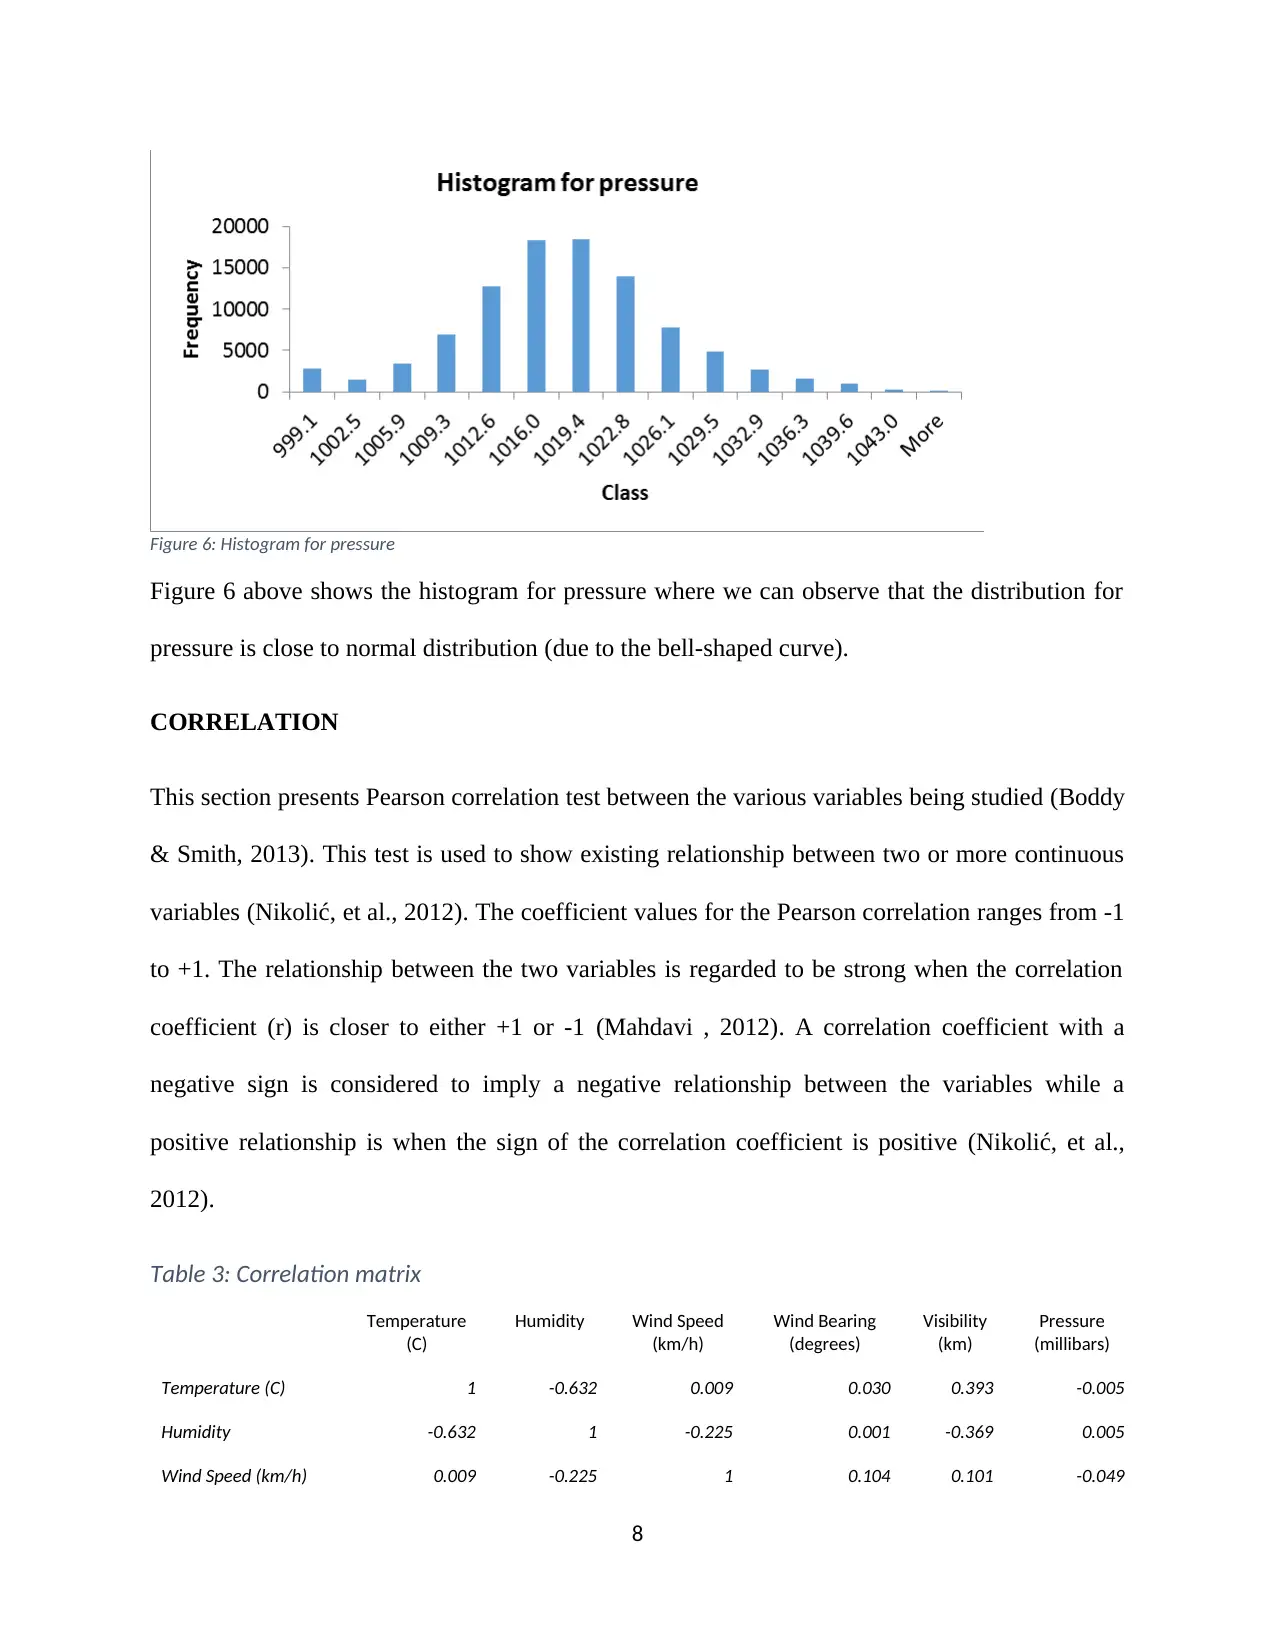
Figure 6: Histogram for pressure
Figure 6 above shows the histogram for pressure where we can observe that the distribution for
pressure is close to normal distribution (due to the bell-shaped curve).
CORRELATION
This section presents Pearson correlation test between the various variables being studied (Boddy
& Smith, 2013). This test is used to show existing relationship between two or more continuous
variables (Nikolić, et al., 2012). The coefficient values for the Pearson correlation ranges from -1
to +1. The relationship between the two variables is regarded to be strong when the correlation
coefficient (r) is closer to either +1 or -1 (Mahdavi , 2012). A correlation coefficient with a
negative sign is considered to imply a negative relationship between the variables while a
positive relationship is when the sign of the correlation coefficient is positive (Nikolić, et al.,
2012).
Table 3: Correlation matrix
Temperature
(C)
Humidity Wind Speed
(km/h)
Wind Bearing
(degrees)
Visibility
(km)
Pressure
(millibars)
Temperature (C) 1 -0.632 0.009 0.030 0.393 -0.005
Humidity -0.632 1 -0.225 0.001 -0.369 0.005
Wind Speed (km/h) 0.009 -0.225 1 0.104 0.101 -0.049
8
Wind Bearing
(degrees)
0.030 0.001 0.104 1 0.048 -0.012
Visibility (km) 0.393 -0.369 0.101 0.048 1 0.060
Pressure (millibars) -0.005 0.005 -0.049 -0.012 0.060 1
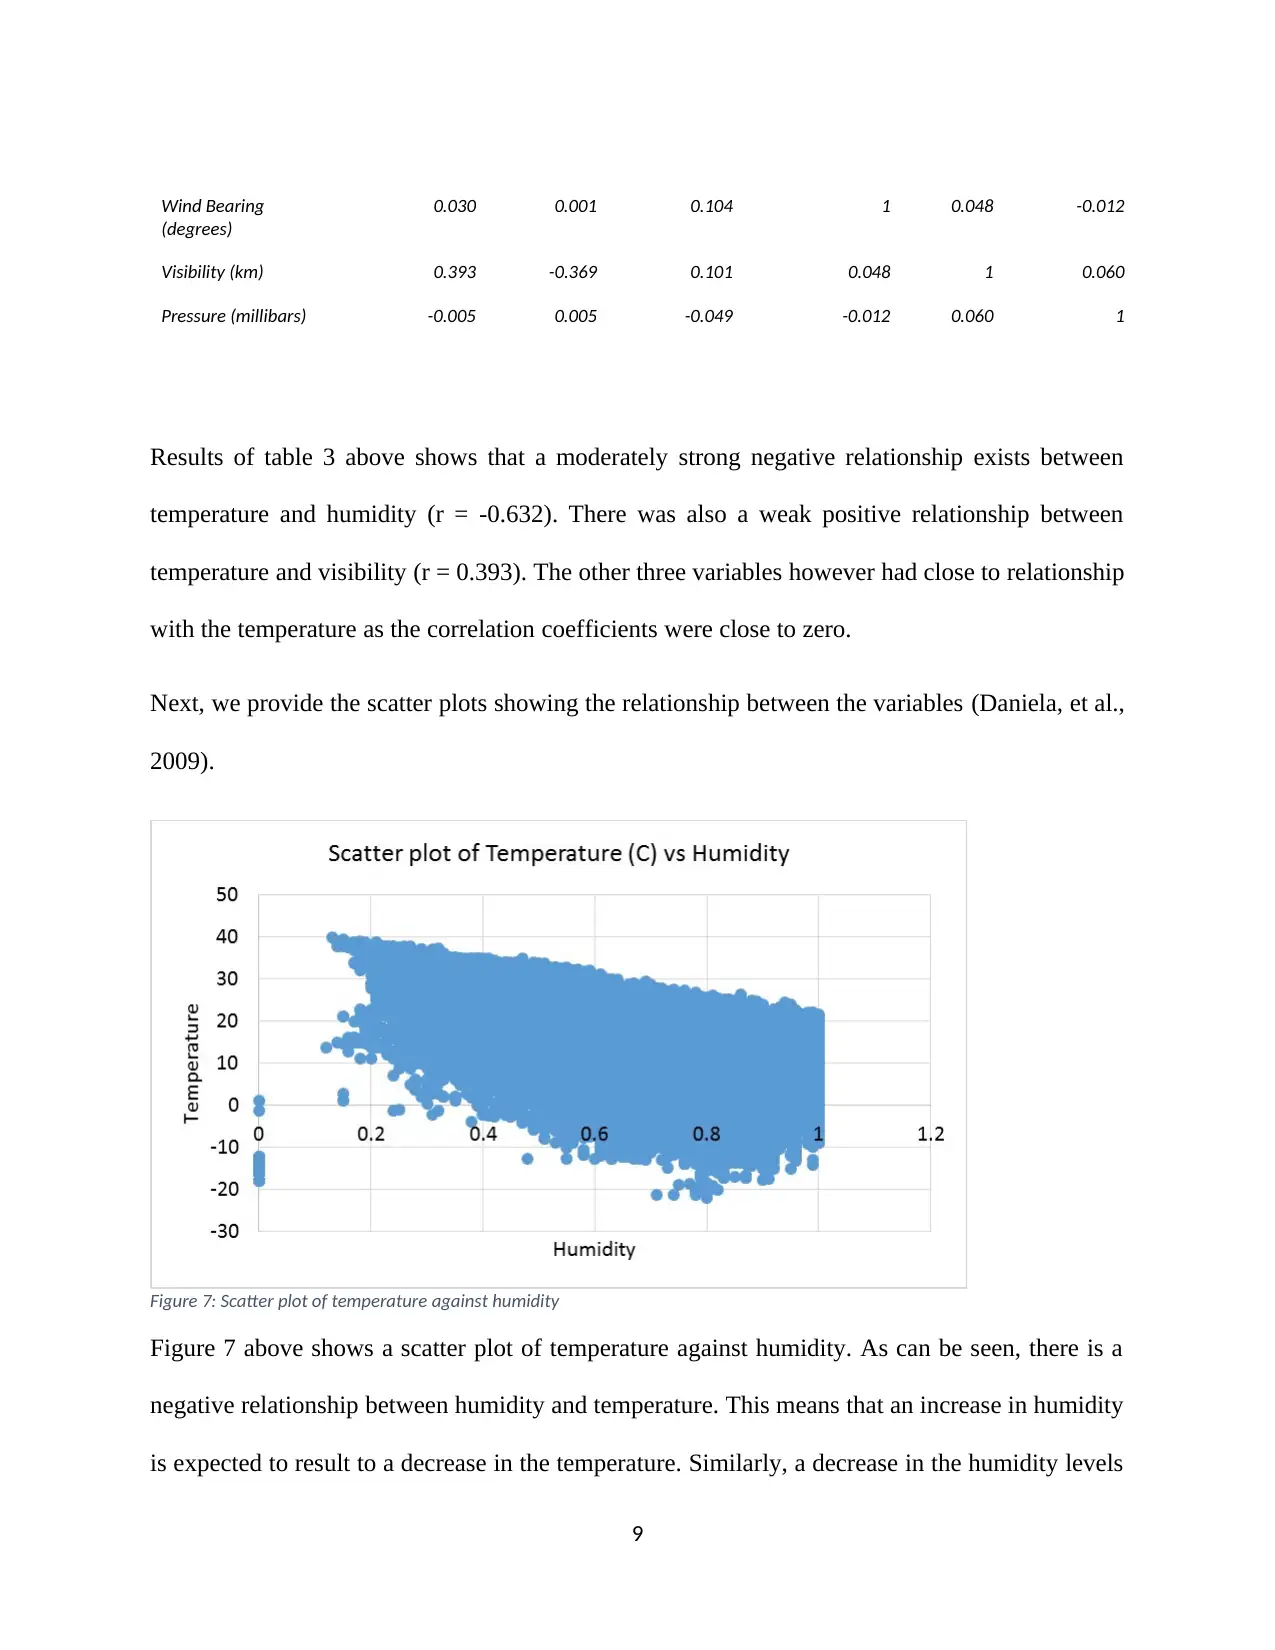
Results of table 3 above shows that a moderately strong negative relationship exists between
temperature and humidity (r = -0.632). There was also a weak positive relationship between
temperature and visibility (r = 0.393). The other three variables however had close to relationship
with the temperature as the correlation coefficients were close to zero.
Next, we provide the scatter plots showing the relationship between the variables (Daniela, et al.,
2009).
Figure 7: Scatter plot of temperature against humidity
Figure 7 above shows a scatter plot of temperature against humidity. As can be seen, there is a
negative relationship between humidity and temperature. This means that an increase in humidity
is expected to result to a decrease in the temperature. Similarly, a decrease in the humidity levels
9
(degrees)
0.030 0.001 0.104 1 0.048 -0.012
Visibility (km) 0.393 -0.369 0.101 0.048 1 0.060
Pressure (millibars) -0.005 0.005 -0.049 -0.012 0.060 1
Results of table 3 above shows that a moderately strong negative relationship exists between
temperature and humidity (r = -0.632). There was also a weak positive relationship between
temperature and visibility (r = 0.393). The other three variables however had close to relationship
with the temperature as the correlation coefficients were close to zero.
Next, we provide the scatter plots showing the relationship between the variables (Daniela, et al.,
2009).
Figure 7: Scatter plot of temperature against humidity
Figure 7 above shows a scatter plot of temperature against humidity. As can be seen, there is a
negative relationship between humidity and temperature. This means that an increase in humidity
is expected to result to a decrease in the temperature. Similarly, a decrease in the humidity levels
9
⊘ This is a preview!⊘
Do you want full access?
Subscribe today to unlock all pages.
Trusted by 1+ million students worldwide
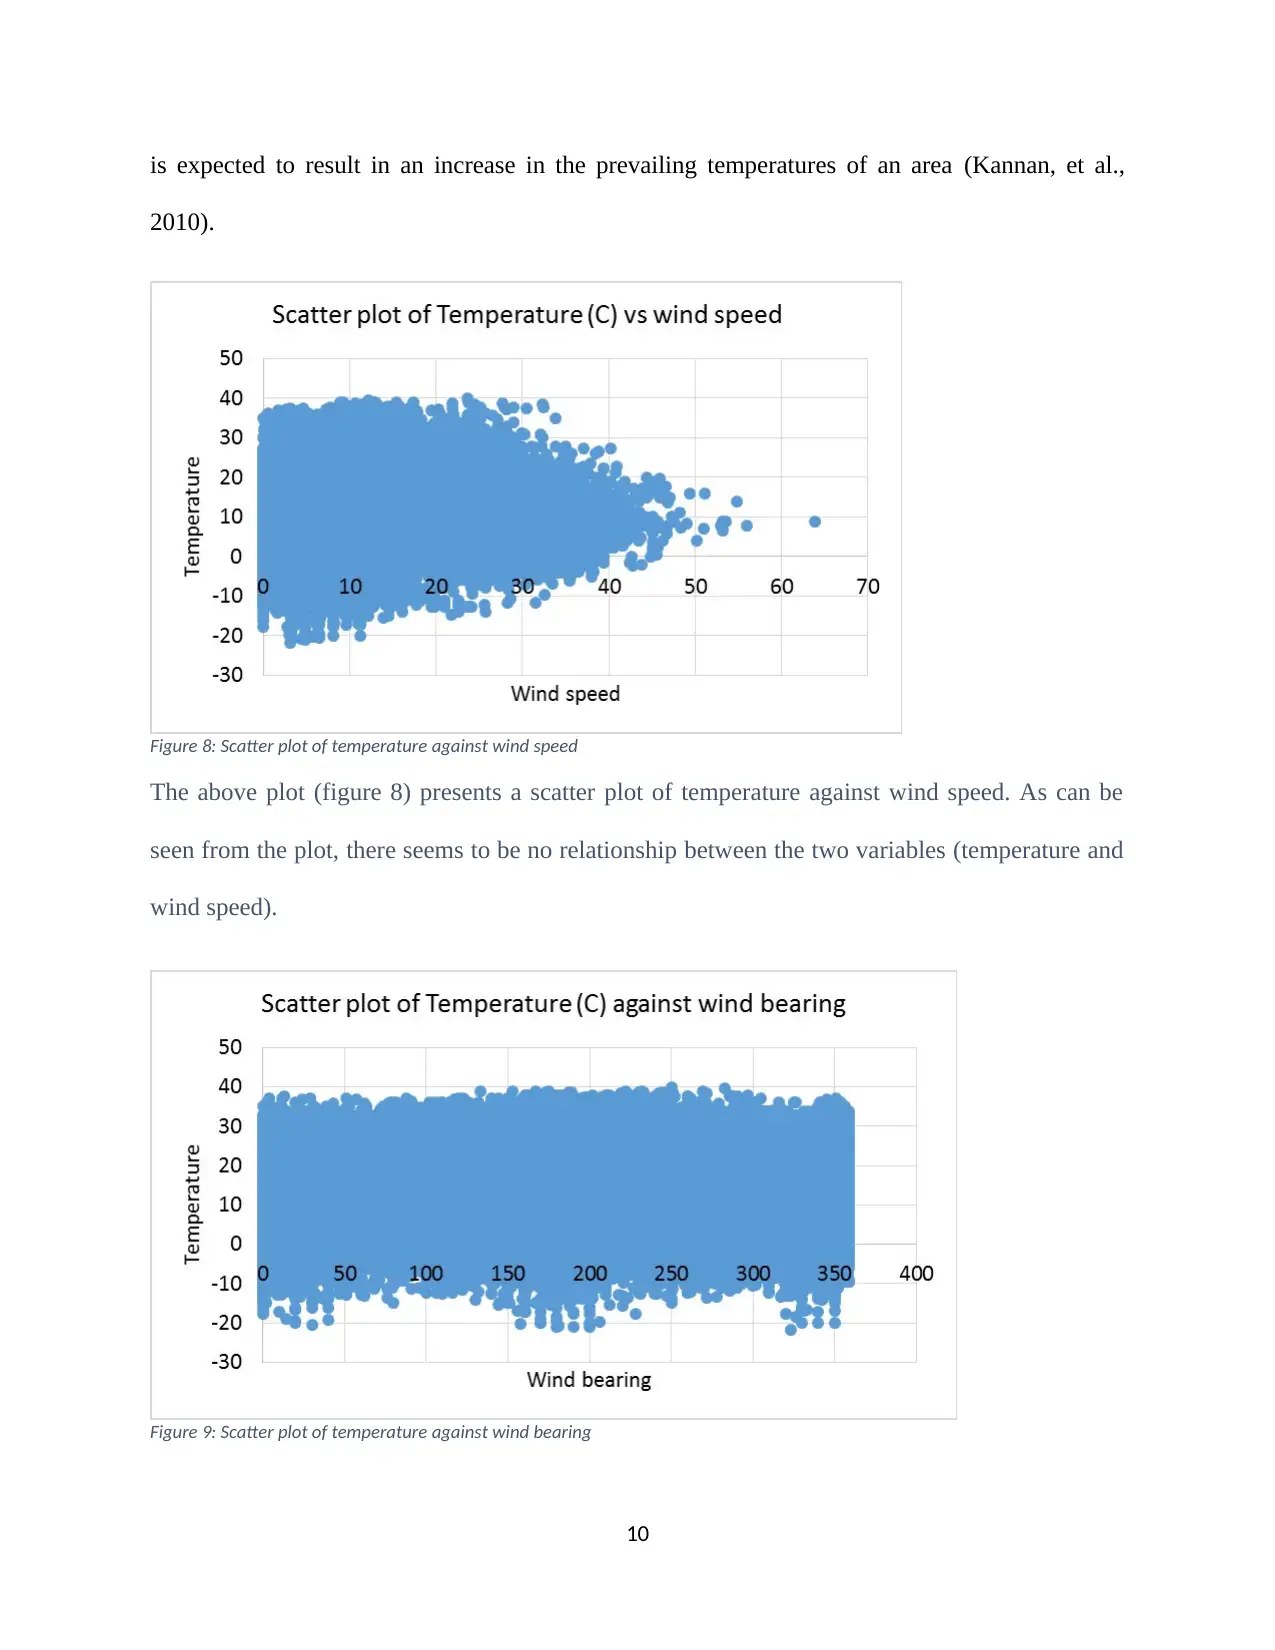
is expected to result in an increase in the prevailing temperatures of an area (Kannan, et al.,
2010).
Figure 8: Scatter plot of temperature against wind speed
The above plot (figure 8) presents a scatter plot of temperature against wind speed. As can be
seen from the plot, there seems to be no relationship between the two variables (temperature and
wind speed).
Figure 9: Scatter plot of temperature against wind bearing
10
Paraphrase This Document
Need a fresh take? Get an instant paraphrase of this document with our AI Paraphraser
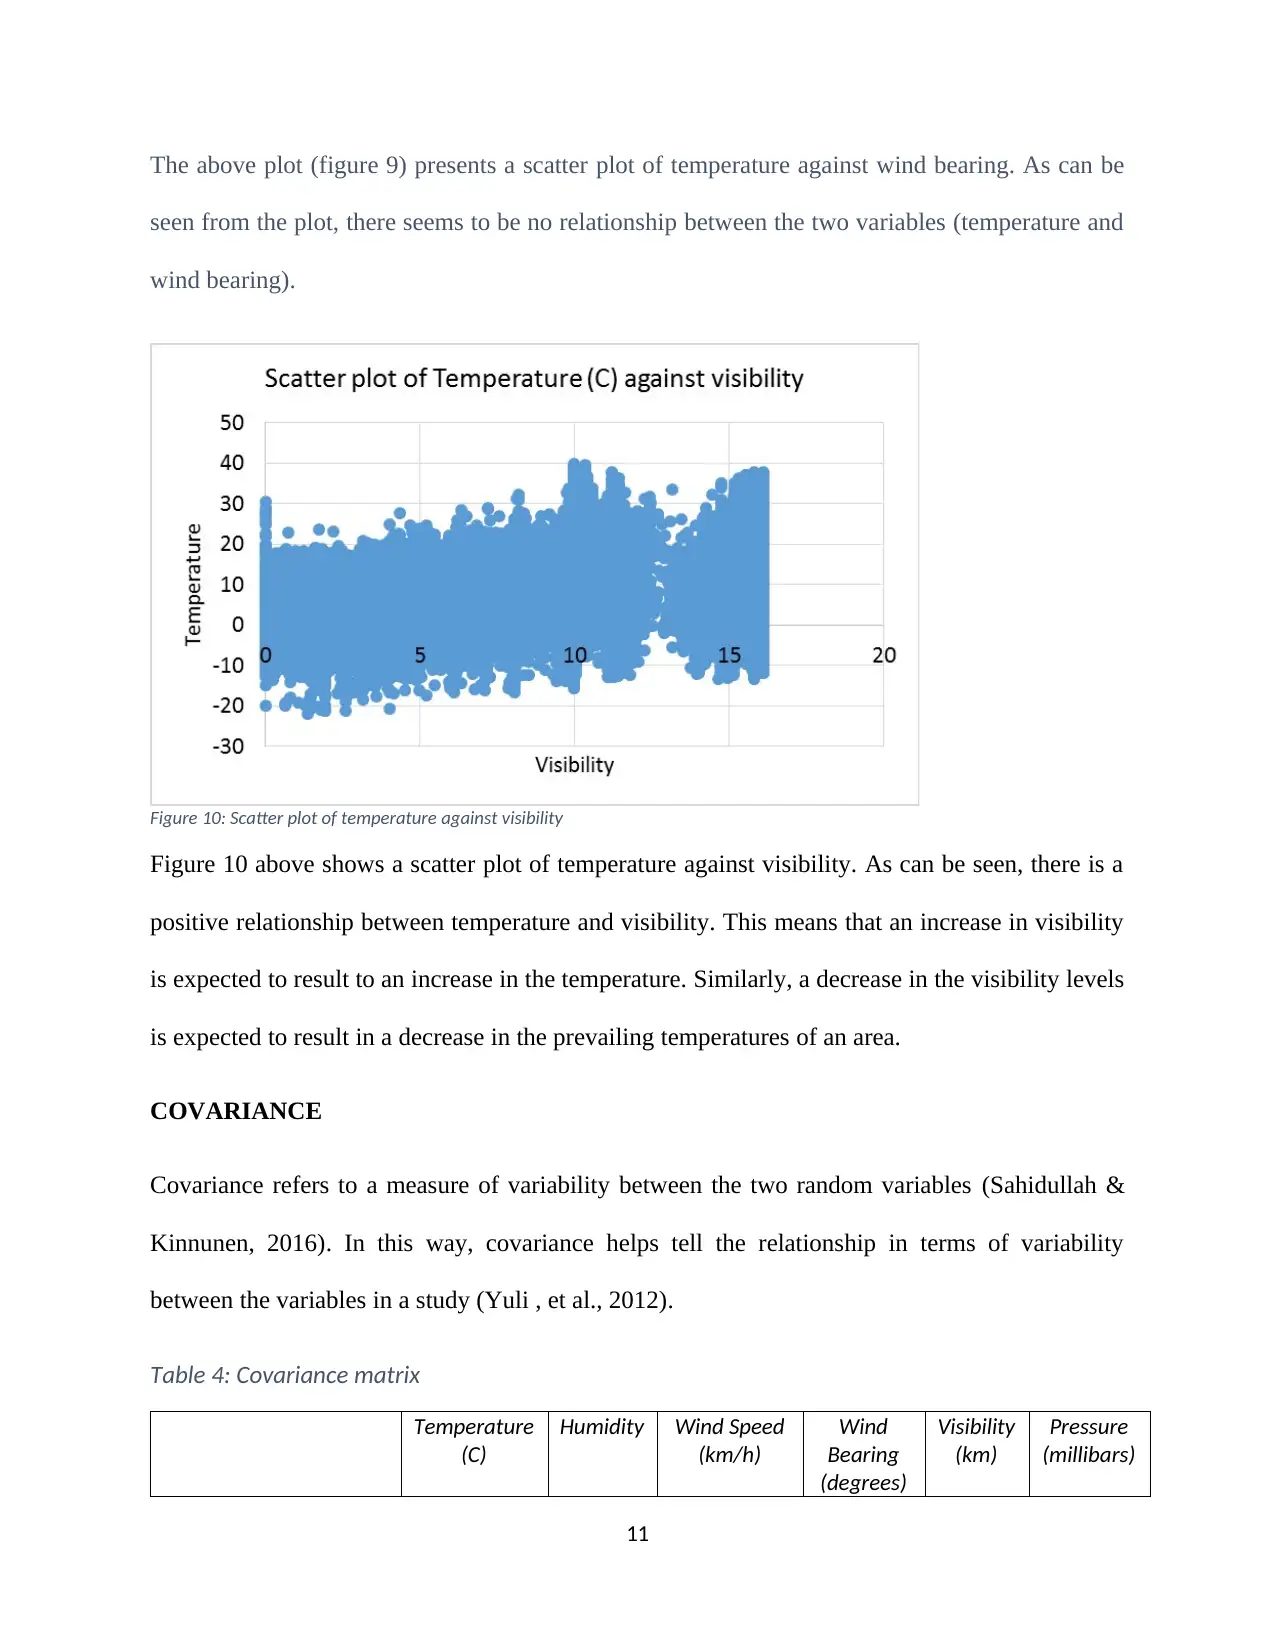
The above plot (figure 9) presents a scatter plot of temperature against wind bearing. As can be
seen from the plot, there seems to be no relationship between the two variables (temperature and
wind bearing).
Figure 10: Scatter plot of temperature against visibility
Figure 10 above shows a scatter plot of temperature against visibility. As can be seen, there is a
positive relationship between temperature and visibility. This means that an increase in visibility
is expected to result to an increase in the temperature. Similarly, a decrease in the visibility levels
is expected to result in a decrease in the prevailing temperatures of an area.
COVARIANCE
Covariance refers to a measure of variability between the two random variables (Sahidullah &
Kinnunen, 2016). In this way, covariance helps tell the relationship in terms of variability
between the variables in a study (Yuli , et al., 2012).
Table 4: Covariance matrix
Temperature
(C)
Humidity Wind Speed
(km/h)
Wind
Bearing
(degrees)
Visibility
(km)
Pressure
(millibars)
11
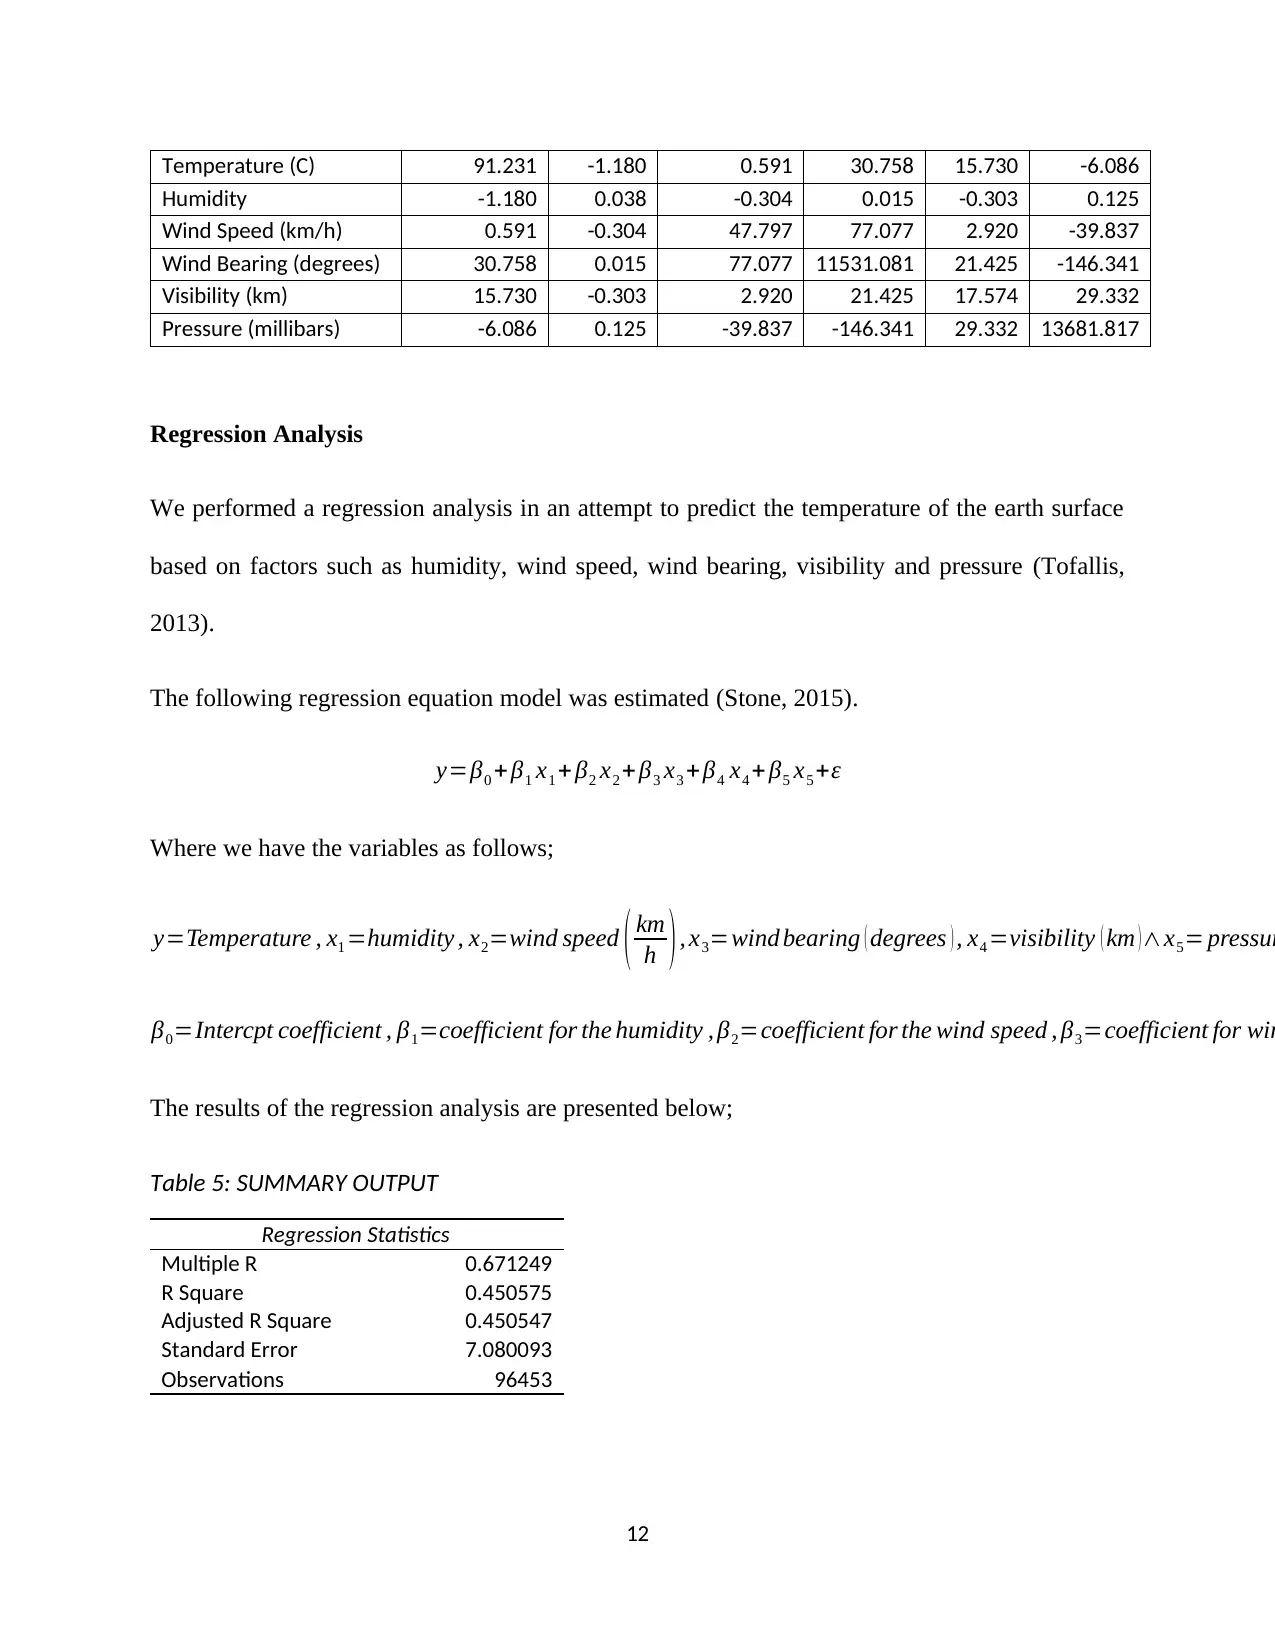
Temperature (C) 91.231 -1.180 0.591 30.758 15.730 -6.086
Humidity -1.180 0.038 -0.304 0.015 -0.303 0.125
Wind Speed (km/h) 0.591 -0.304 47.797 77.077 2.920 -39.837
Wind Bearing (degrees) 30.758 0.015 77.077 11531.081 21.425 -146.341
Visibility (km) 15.730 -0.303 2.920 21.425 17.574 29.332
Pressure (millibars) -6.086 0.125 -39.837 -146.341 29.332 13681.817
Regression Analysis
We performed a regression analysis in an attempt to predict the temperature of the earth surface
based on factors such as humidity, wind speed, wind bearing, visibility and pressure (Tofallis,
2013).
The following regression equation model was estimated (Stone, 2015).
y=β0 + β1 x1 + β2 x2 + β3 x3 + β4 x4 + β5 x5 +ε
Where we have the variables as follows;
y=Temperature , x1 =humidity , x2=wind speed ( km
h ), x3=wind bearing ( degrees ) , x4 =visibility ( km )∧x5= pressur
β0=Intercpt coefficient , β1=coefficient for the humidity , β2=coefficient for the wind speed , β3=coefficient for win
The results of the regression analysis are presented below;
Table 5: SUMMARY OUTPUT
Regression Statistics
Multiple R 0.671249
R Square 0.450575
Adjusted R Square 0.450547
Standard Error 7.080093
Observations 96453
12
⊘ This is a preview!⊘
Do you want full access?
Subscribe today to unlock all pages.
Trusted by 1+ million students worldwide
1 out of 17

Your All-in-One AI-Powered Toolkit for Academic Success.
+13062052269
info@desklib.com
Available 24*7 on WhatsApp / Email
![[object Object]](/_next/static/media/star-bottom.7253800d.svg)
Unlock your academic potential
Copyright © 2020–2026 A2Z Services. All Rights Reserved. Developed and managed by ZUCOL.