Analyzing Customer Segmentation and Marketing Strategies
VerifiedAdded on 2020/04/29
|14
|2198
|40
AI Summary
In this assignment, students will delve into market basket analysis by using the Apriori algorithm within R to explore customer purchase behaviors. The task involves analyzing a provided dataset of transactions to discover meaningful associations between different products that are frequently bought together. Key objectives include calculating support and confidence values for identified rules and determining the lift value to assess the significance of these associations. Students will interpret these results to suggest strategic product bundling and promotional opportunities, focusing on rules with the highest lift value. Through this exercise, learners will gain insights into enhancing marketing strategies by leveraging data-driven product associations.
Chapter: 1 Predictive analysis
1.1 Introduction
This research is aimed to help the national veteran’s organisation in decision making process,
so that the organisation can better target the donors. If the organisation is able to identify the
most likely donors then it can only target such group and save money and effort on targeting
the whole group. As per the given information, organisation has data base of more than 3.5
million individuals. In this research the identification of the probable donors will be on the
basis of their previous behaviours. Through the analysis a certain group of individuals will be
targeted who have donated recently (12 and 24 months ago).
1.2 Part A: Build decision tree and Regression based predictive models and
predict the donors who should be solicited for donations.
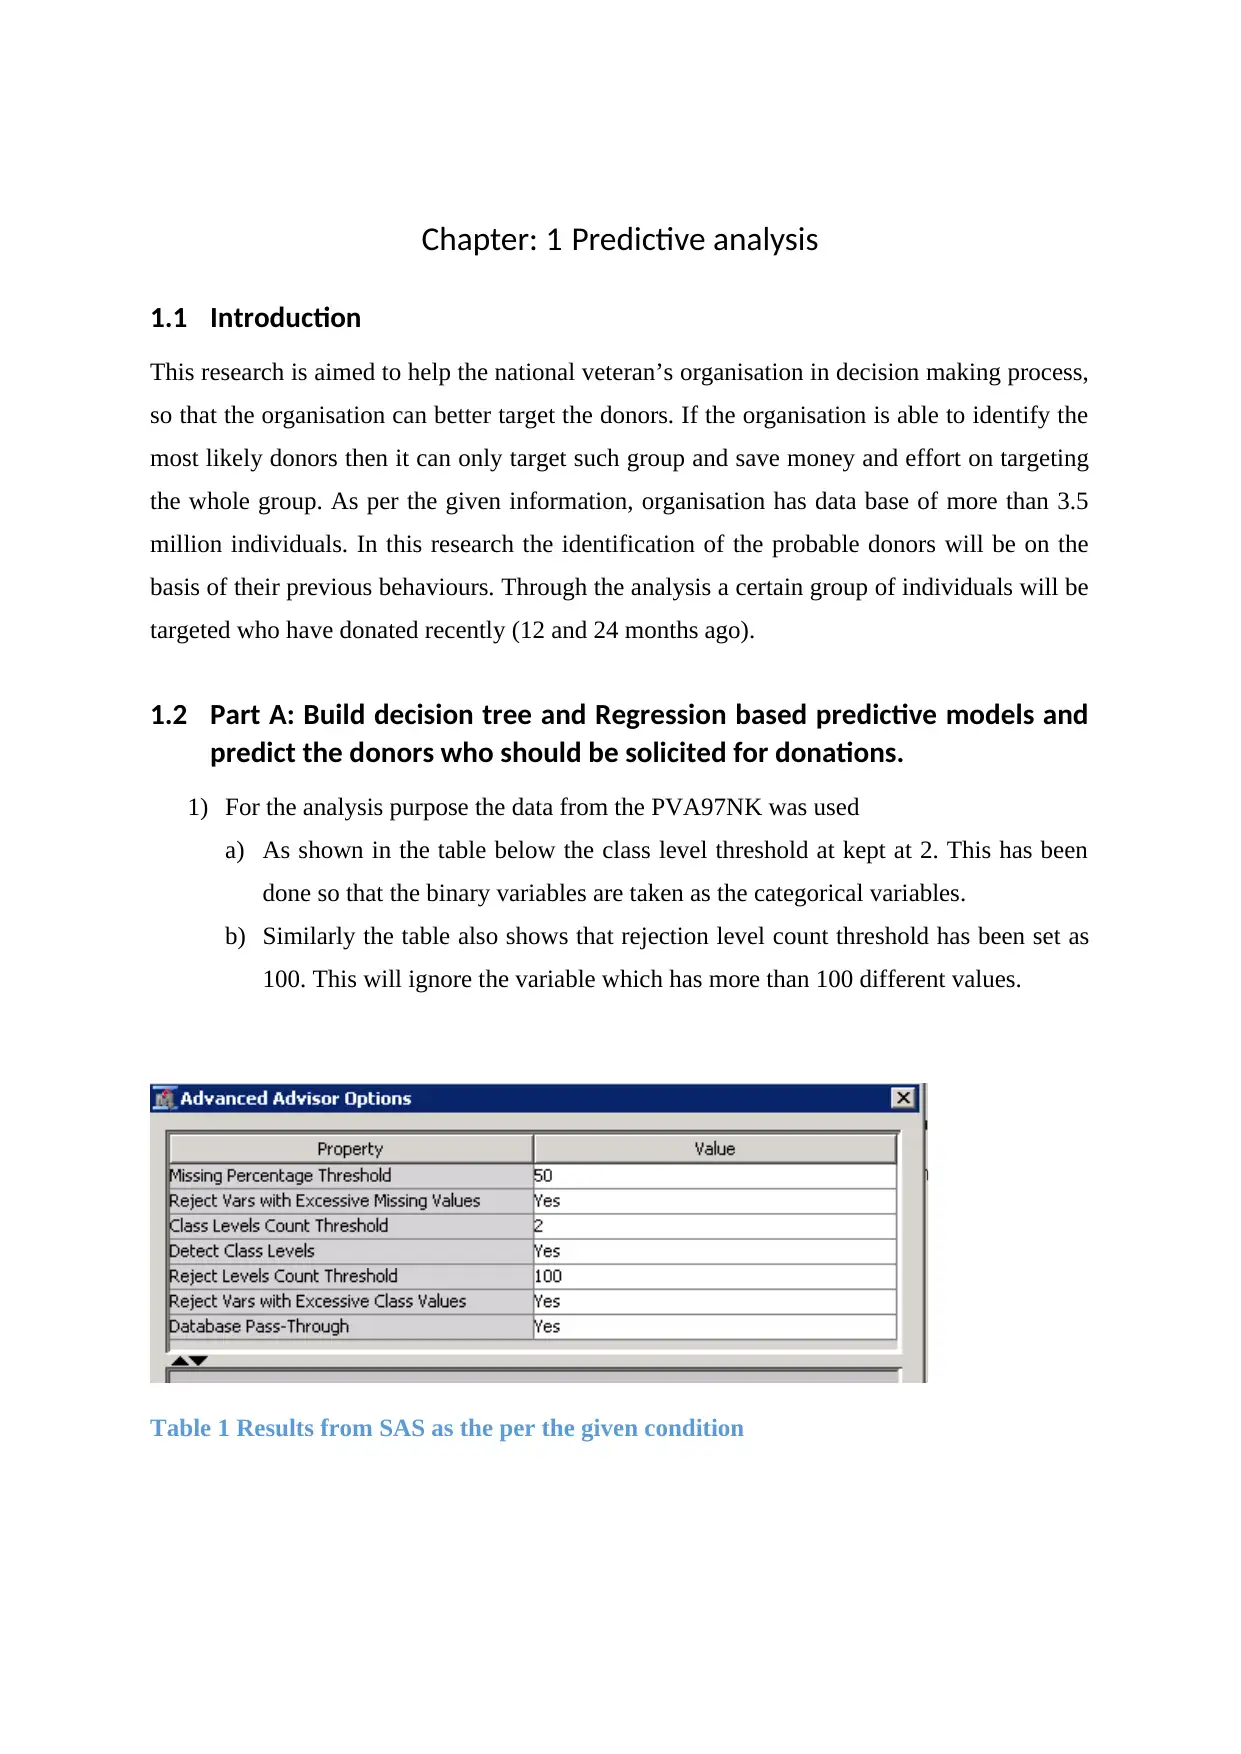
1) For the analysis purpose the data from the PVA97NK was used
a) As shown in the table below the class level threshold at kept at 2. This has been
done so that the binary variables are taken as the categorical variables.
b) Similarly the table also shows that rejection level count threshold has been set as
100. This will ignore the variable which has more than 100 different values.
Table 1 Results from SAS as the per the given condition
1.1 Introduction
This research is aimed to help the national veteran’s organisation in decision making process,
so that the organisation can better target the donors. If the organisation is able to identify the
most likely donors then it can only target such group and save money and effort on targeting
the whole group. As per the given information, organisation has data base of more than 3.5
million individuals. In this research the identification of the probable donors will be on the
basis of their previous behaviours. Through the analysis a certain group of individuals will be
targeted who have donated recently (12 and 24 months ago).
1.2 Part A: Build decision tree and Regression based predictive models and
predict the donors who should be solicited for donations.
1) For the analysis purpose the data from the PVA97NK was used
a) As shown in the table below the class level threshold at kept at 2. This has been
done so that the binary variables are taken as the categorical variables.
b) Similarly the table also shows that rejection level count threshold has been set as
100. This will ignore the variable which has more than 100 different values.
Table 1 Results from SAS as the per the given condition
Paraphrase This Document
Need a fresh take? Get an instant paraphrase of this document with our AI Paraphraser
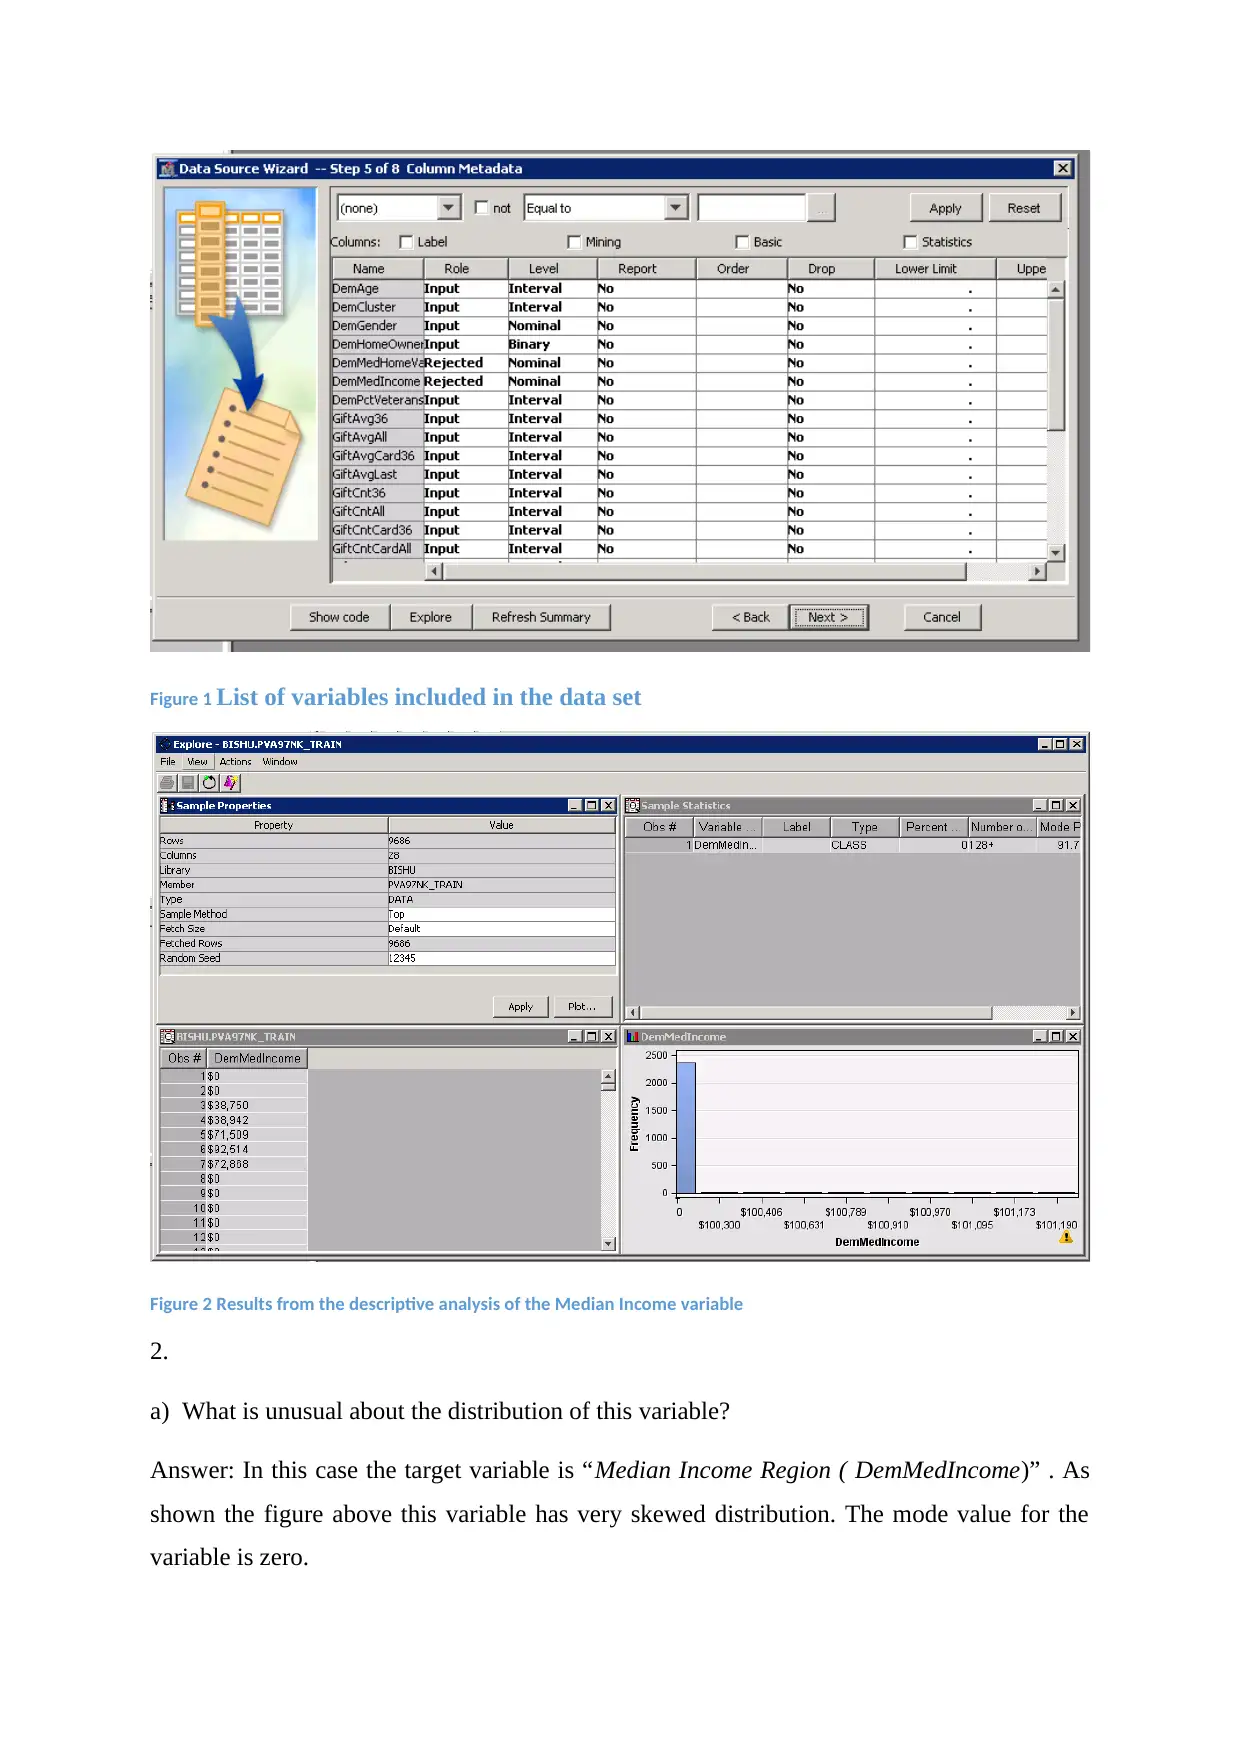
Figure 1 List of variables included in the data set
Figure 2 Results from the descriptive analysis of the Median Income variable
2.
a) What is unusual about the distribution of this variable?
Answer: In this case the target variable is “Median Income Region ( DemMedIncome)” . As
shown the figure above this variable has very skewed distribution. The mode value for the
variable is zero.
b) What could cause this anomaly to occur?
Answer: As discussed in the previous section the median income is zero. However the
median income cannot be zero as the median value is the middle value of the entire data set.
Since the data is related to the probable donors the income of the individuals are expected to
be higher than the average income of the people. So there might be some issues while
collecting the data(Kara 2013).
c) What do you think should be done to rectify the situation?
Answer: Firstly, the sanity check should be done to understand whether the data collection
was done properly or not. In case the zeros are some code for the people, it should be clearly
stated so that it should not confuse the analyst.
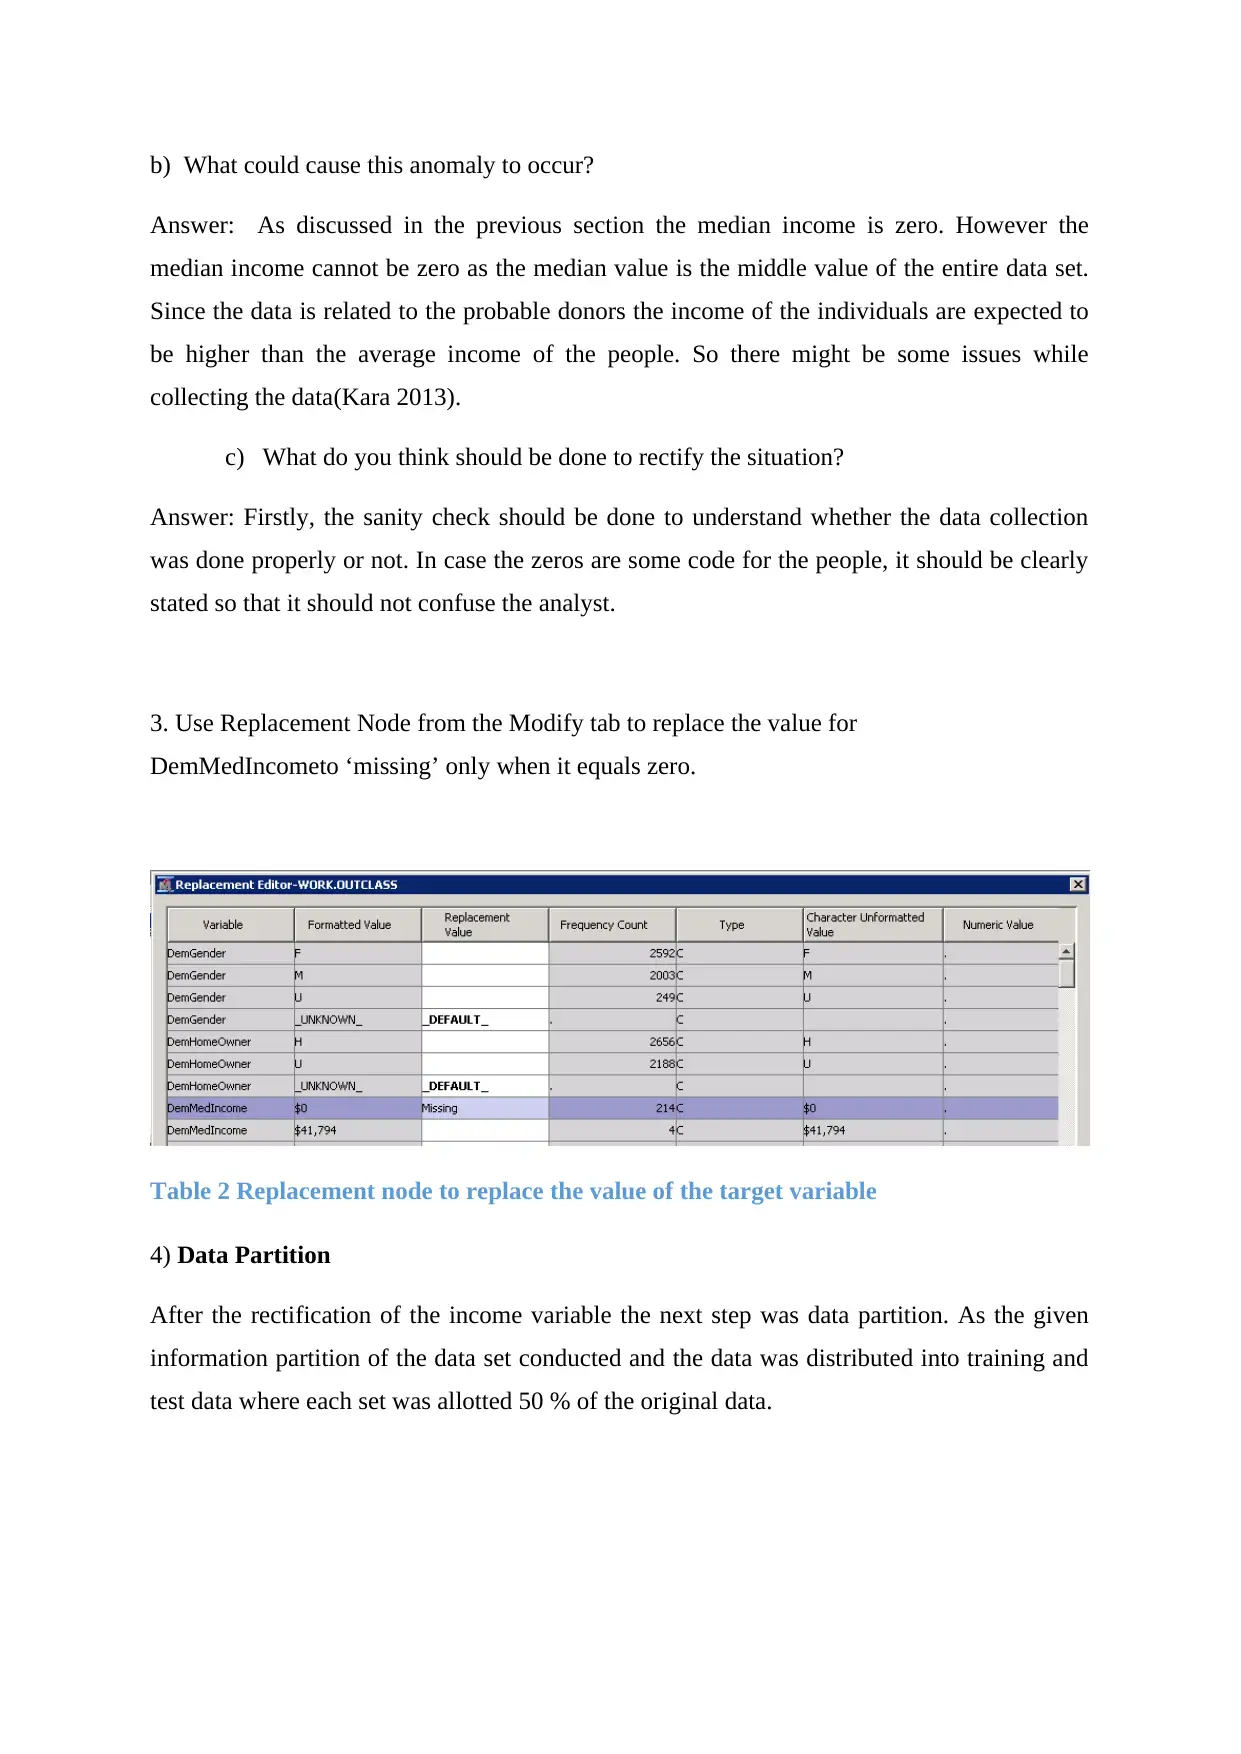
3. Use Replacement Node from the Modify tab to replace the value for
DemMedIncometo ‘missing’ only when it equals zero.
Table 2 Replacement node to replace the value of the target variable
4) Data Partition
After the rectification of the income variable the next step was data partition. As the given
information partition of the data set conducted and the data was distributed into training and
test data where each set was allotted 50 % of the original data.
Answer: As discussed in the previous section the median income is zero. However the
median income cannot be zero as the median value is the middle value of the entire data set.
Since the data is related to the probable donors the income of the individuals are expected to
be higher than the average income of the people. So there might be some issues while
collecting the data(Kara 2013).
c) What do you think should be done to rectify the situation?
Answer: Firstly, the sanity check should be done to understand whether the data collection
was done properly or not. In case the zeros are some code for the people, it should be clearly
stated so that it should not confuse the analyst.
3. Use Replacement Node from the Modify tab to replace the value for
DemMedIncometo ‘missing’ only when it equals zero.
Table 2 Replacement node to replace the value of the target variable
4) Data Partition
After the rectification of the income variable the next step was data partition. As the given
information partition of the data set conducted and the data was distributed into training and
test data where each set was allotted 50 % of the original data.
⊘ This is a preview!⊘
Do you want full access?
Subscribe today to unlock all pages.
Trusted by 1+ million students worldwide
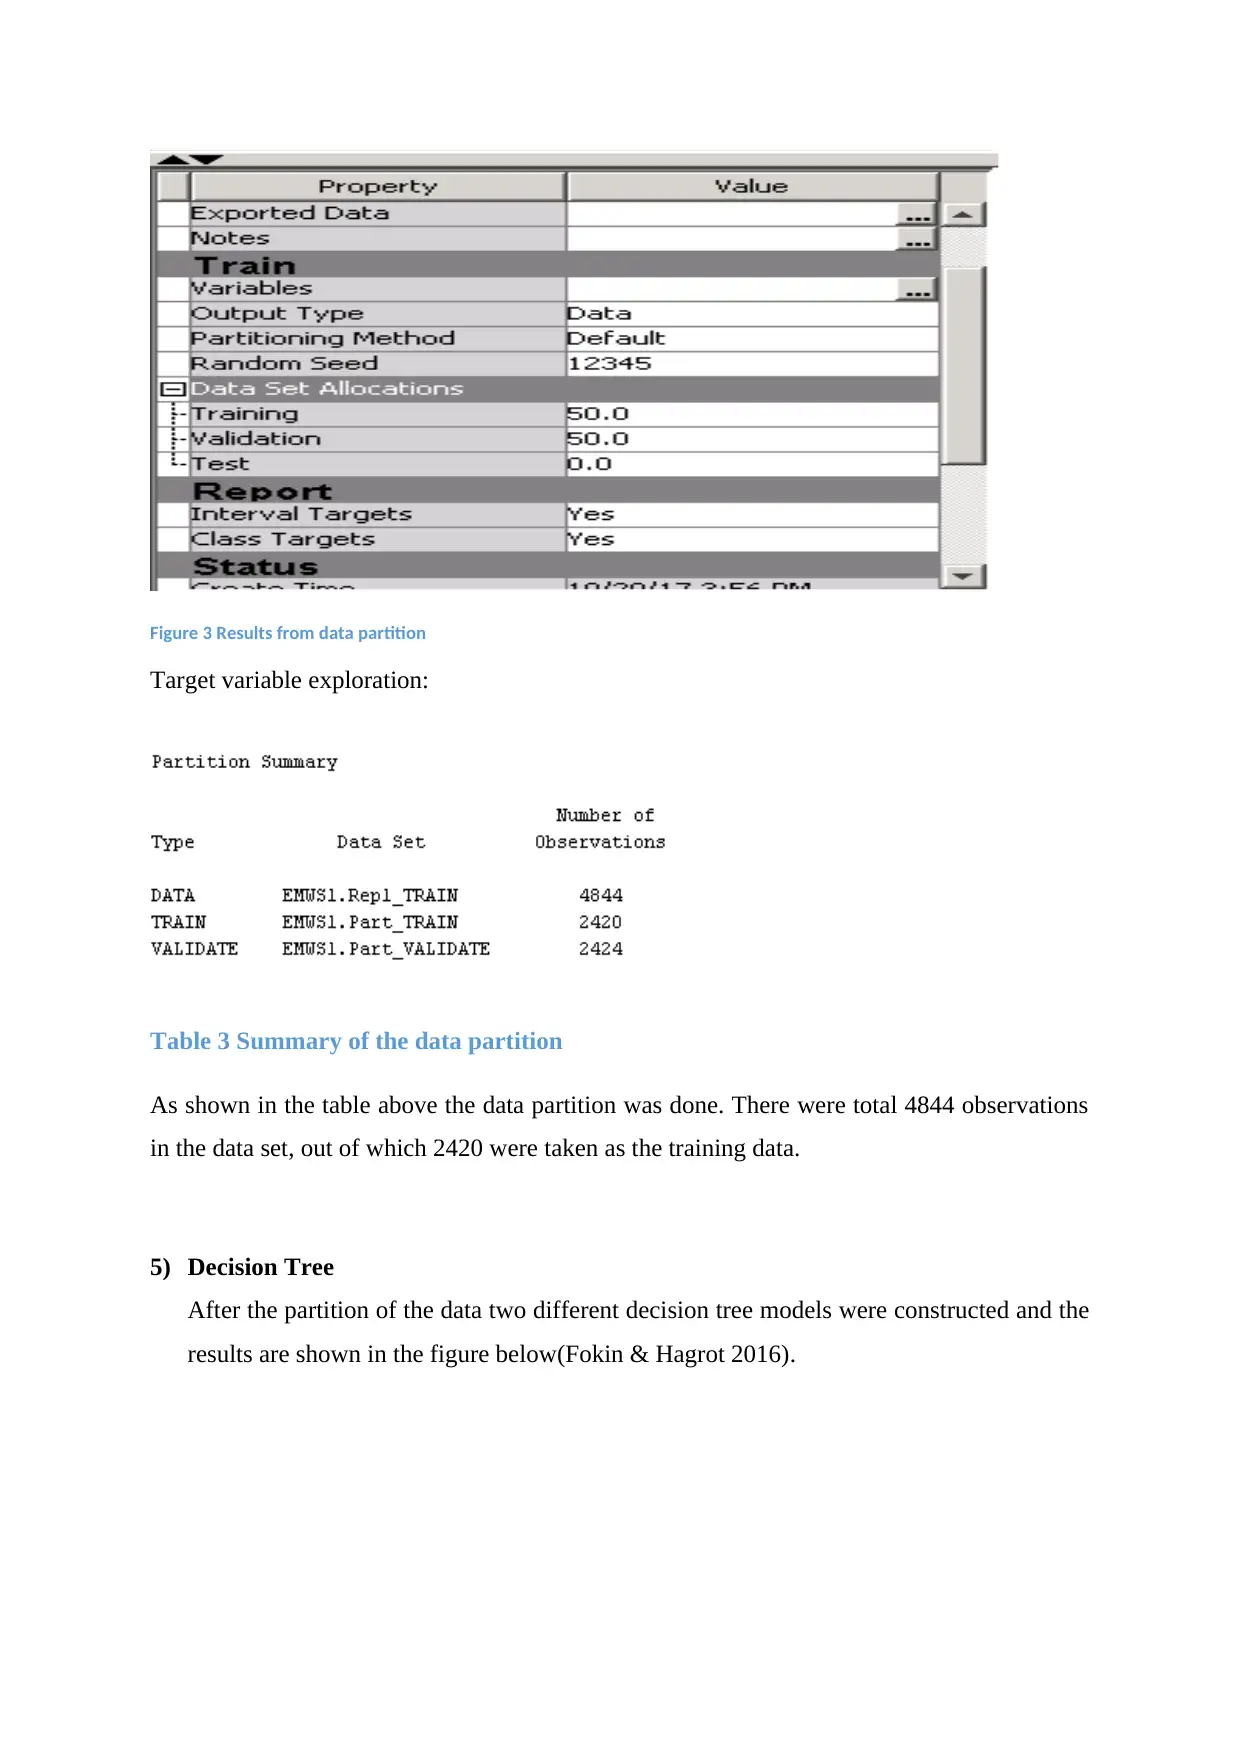
Figure 3 Results from data partition
Target variable exploration:
Table 3 Summary of the data partition
As shown in the table above the data partition was done. There were total 4844 observations
in the data set, out of which 2420 were taken as the training data.
5) Decision Tree
After the partition of the data two different decision tree models were constructed and the
results are shown in the figure below(Fokin & Hagrot 2016).
Paraphrase This Document
Need a fresh take? Get an instant paraphrase of this document with our AI Paraphraser
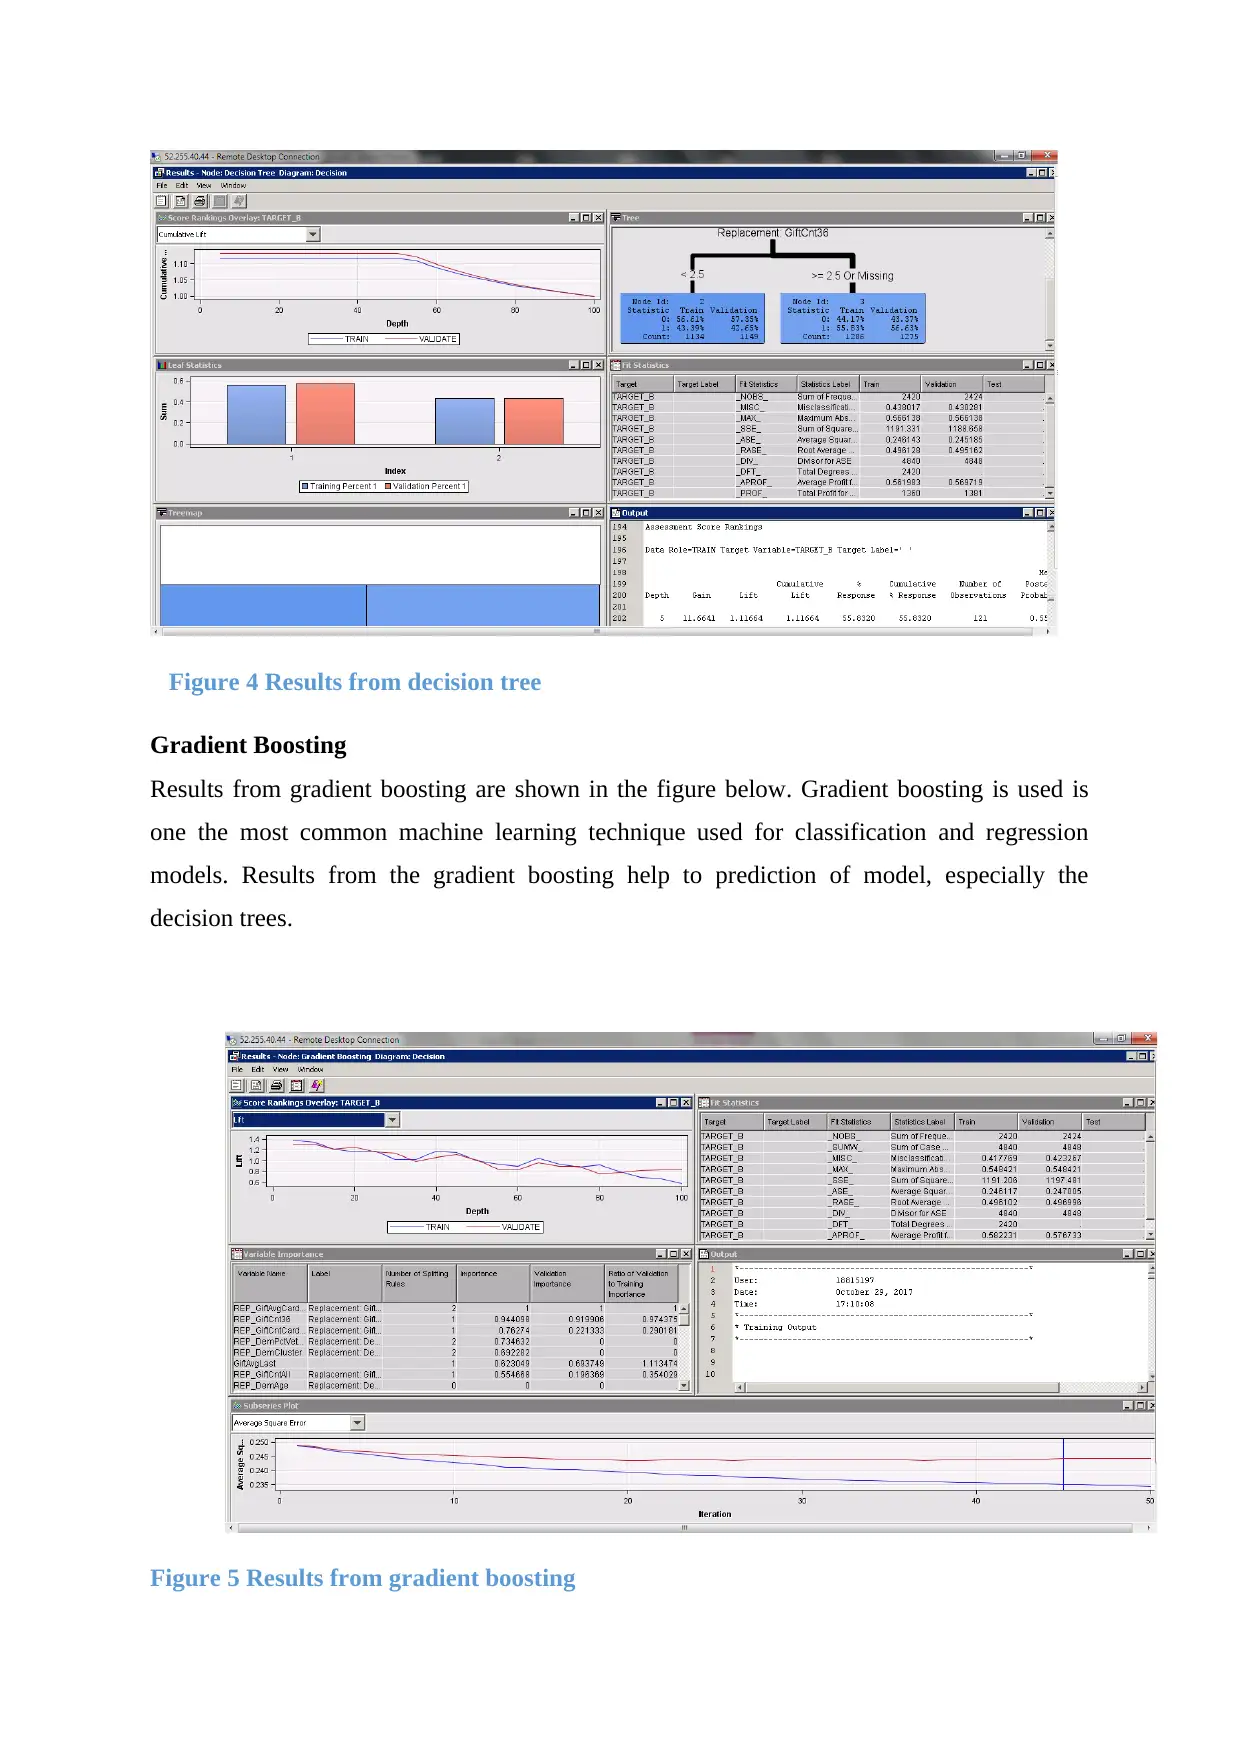
Figure 4 Results from decision tree
Gradient Boosting
Results from gradient boosting are shown in the figure below. Gradient boosting is used is
one the most common machine learning technique used for classification and regression
models. Results from the gradient boosting help to prediction of model, especially the
decision trees.
Figure 5 Results from gradient boosting
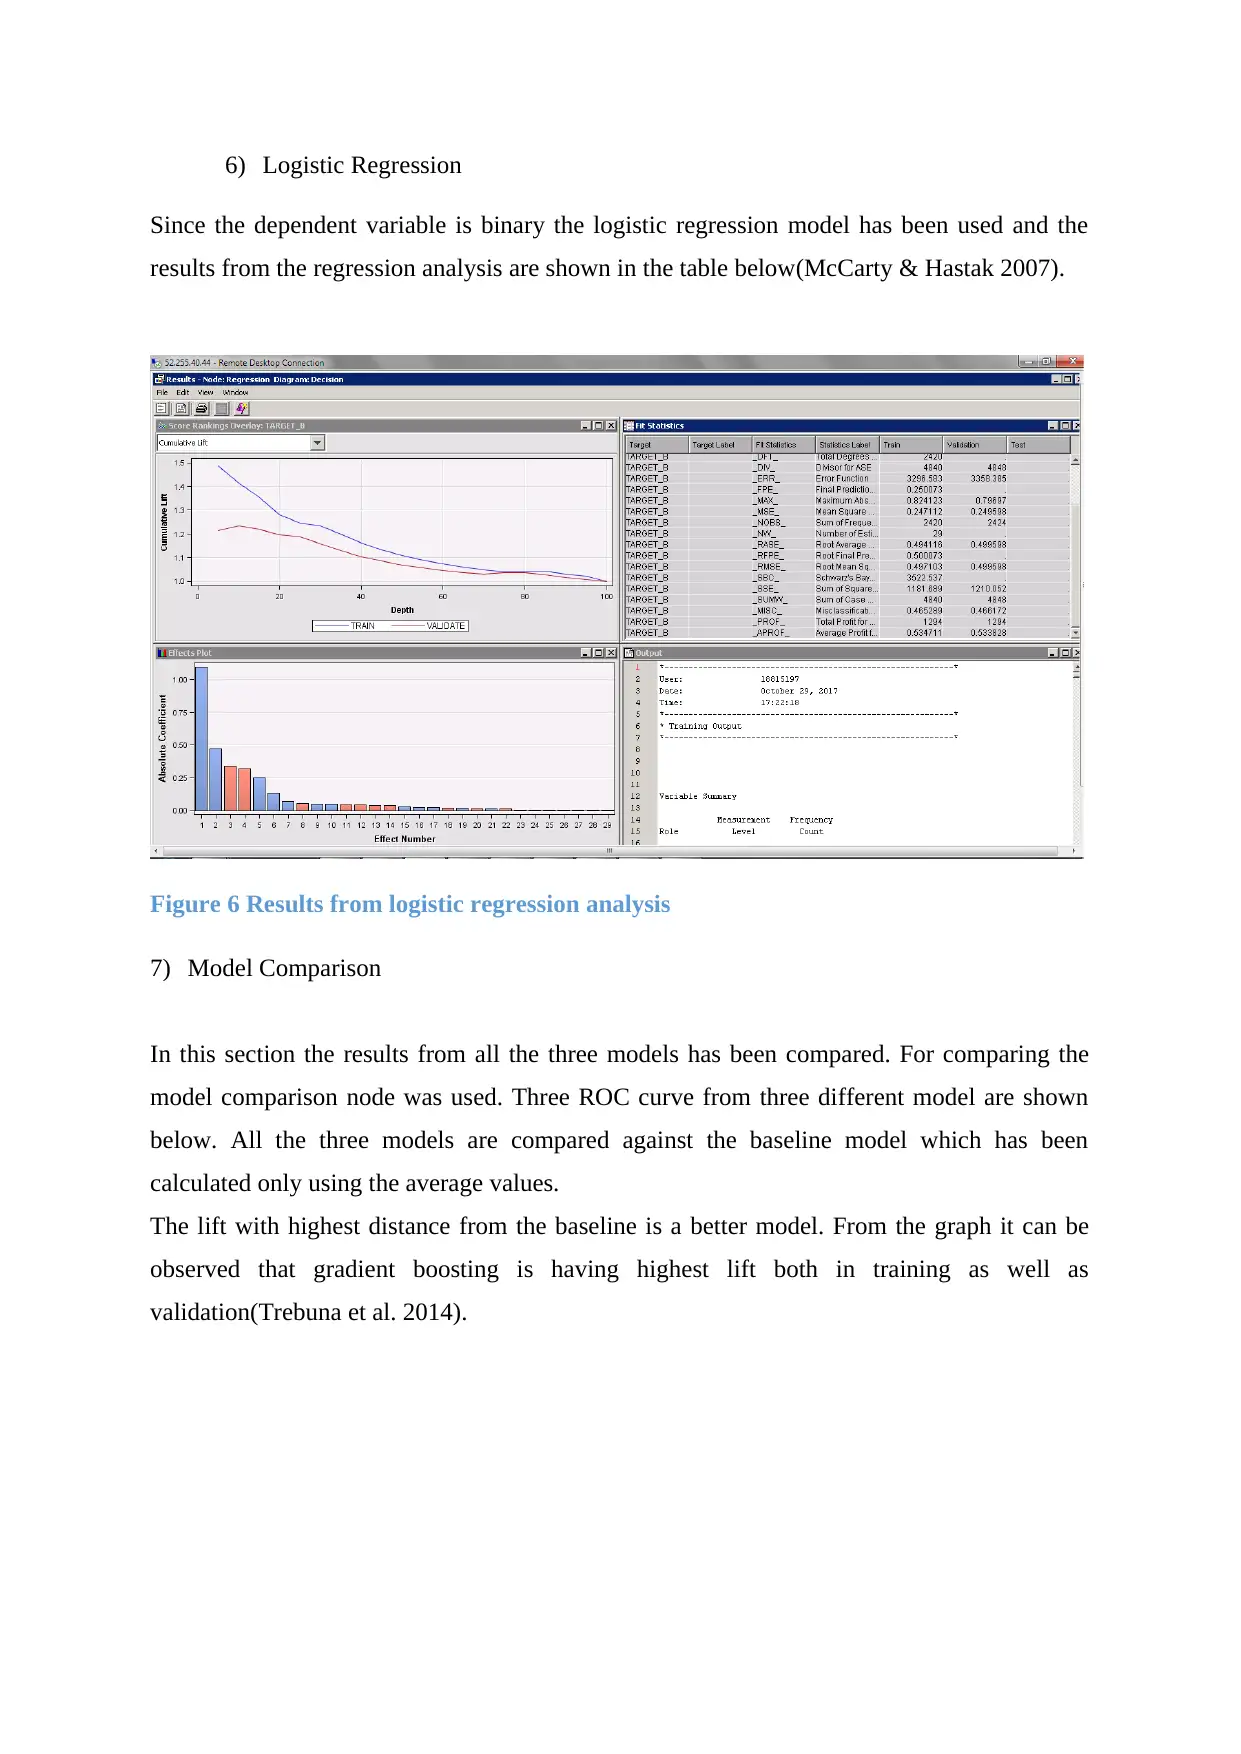
6) Logistic Regression
Since the dependent variable is binary the logistic regression model has been used and the
results from the regression analysis are shown in the table below(McCarty & Hastak 2007).
Figure 6 Results from logistic regression analysis
7) Model Comparison
In this section the results from all the three models has been compared. For comparing the
model comparison node was used. Three ROC curve from three different model are shown
below. All the three models are compared against the baseline model which has been
calculated only using the average values.
The lift with highest distance from the baseline is a better model. From the graph it can be
observed that gradient boosting is having highest lift both in training as well as
validation(Trebuna et al. 2014).
⊘ This is a preview!⊘
Do you want full access?
Subscribe today to unlock all pages.
Trusted by 1+ million students worldwide
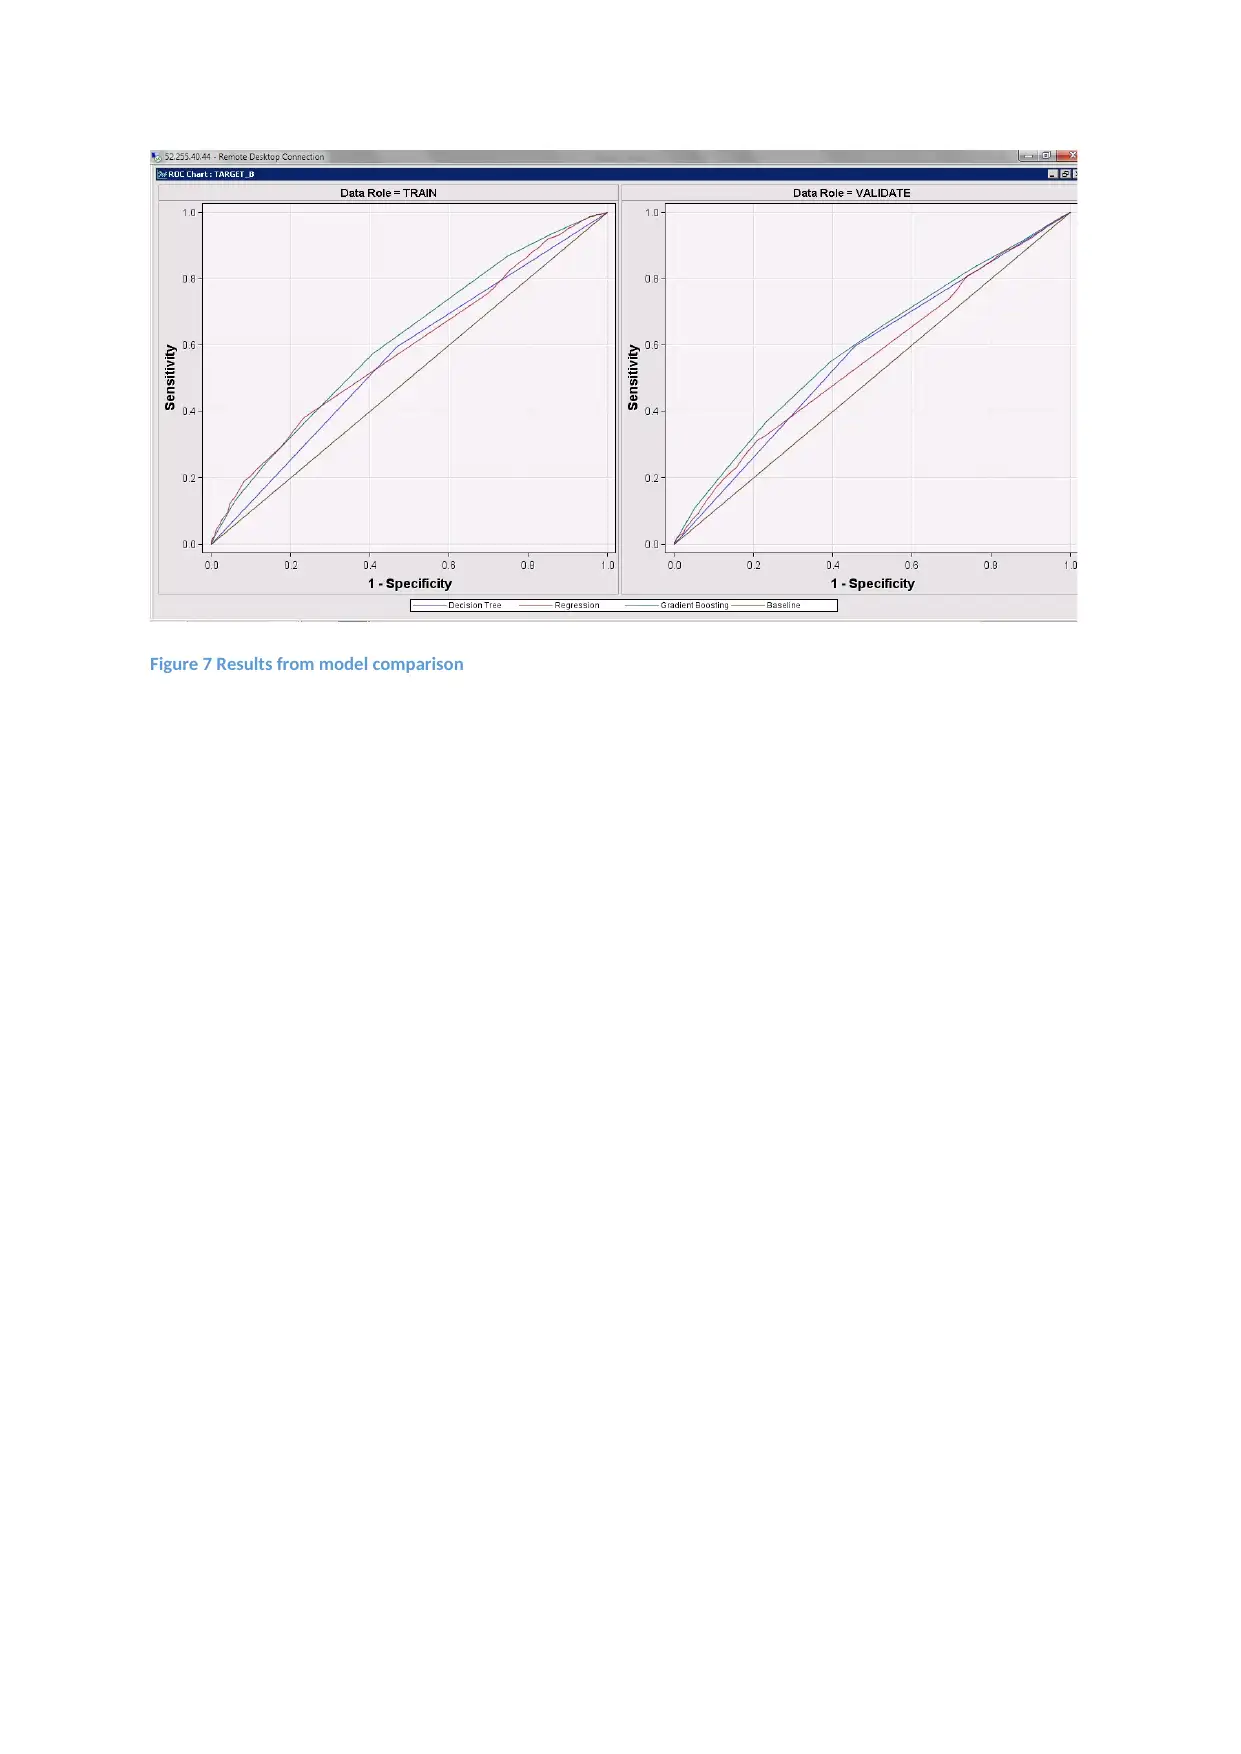
Figure 7 Results from model comparison
Paraphrase This Document
Need a fresh take? Get an instant paraphrase of this document with our AI Paraphraser
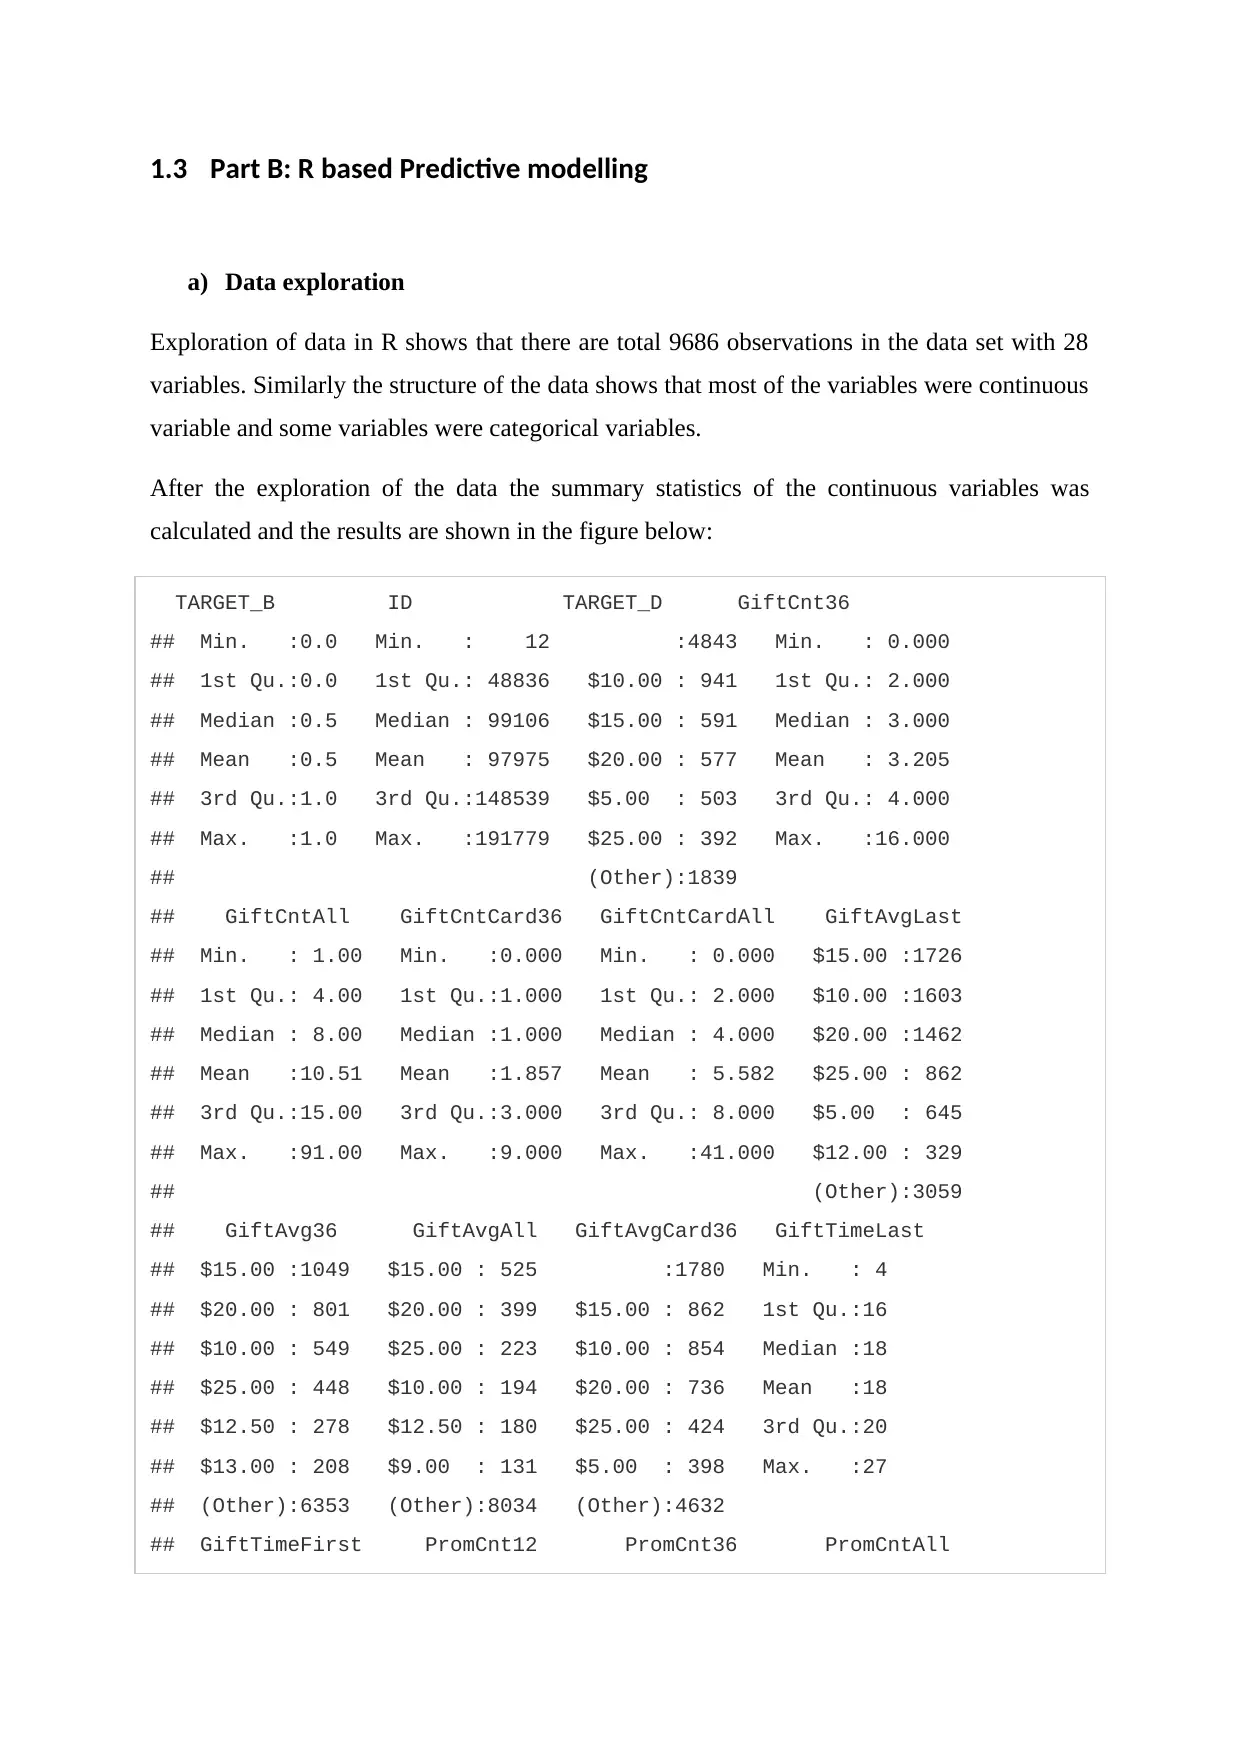
1.3 Part B: R based Predictive modelling
a) Data exploration
Exploration of data in R shows that there are total 9686 observations in the data set with 28
variables. Similarly the structure of the data shows that most of the variables were continuous
variable and some variables were categorical variables.
After the exploration of the data the summary statistics of the continuous variables was
calculated and the results are shown in the figure below:
TARGET_B ID TARGET_D GiftCnt36
## Min. :0.0 Min. : 12 :4843 Min. : 0.000
## 1st Qu.:0.0 1st Qu.: 48836 $10.00 : 941 1st Qu.: 2.000
## Median :0.5 Median : 99106 $15.00 : 591 Median : 3.000
## Mean :0.5 Mean : 97975 $20.00 : 577 Mean : 3.205
## 3rd Qu.:1.0 3rd Qu.:148539 $5.00 : 503 3rd Qu.: 4.000
## Max. :1.0 Max. :191779 $25.00 : 392 Max. :16.000
## (Other):1839
## GiftCntAll GiftCntCard36 GiftCntCardAll GiftAvgLast
## Min. : 1.00 Min. :0.000 Min. : 0.000 $15.00 :1726
## 1st Qu.: 4.00 1st Qu.:1.000 1st Qu.: 2.000 $10.00 :1603
## Median : 8.00 Median :1.000 Median : 4.000 $20.00 :1462
## Mean :10.51 Mean :1.857 Mean : 5.582 $25.00 : 862
## 3rd Qu.:15.00 3rd Qu.:3.000 3rd Qu.: 8.000 $5.00 : 645
## Max. :91.00 Max. :9.000 Max. :41.000 $12.00 : 329
## (Other):3059
## GiftAvg36 GiftAvgAll GiftAvgCard36 GiftTimeLast
## $15.00 :1049 $15.00 : 525 :1780 Min. : 4
## $20.00 : 801 $20.00 : 399 $15.00 : 862 1st Qu.:16
## $10.00 : 549 $25.00 : 223 $10.00 : 854 Median :18
## $25.00 : 448 $10.00 : 194 $20.00 : 736 Mean :18
## $12.50 : 278 $12.50 : 180 $25.00 : 424 3rd Qu.:20
## $13.00 : 208 $9.00 : 131 $5.00 : 398 Max. :27
## (Other):6353 (Other):8034 (Other):4632
## GiftTimeFirst PromCnt12 PromCnt36 PromCntAll
## Min. : 15.0 Min. : 2.00 Min. : 4.00 Min. : 5.00
## 1st Qu.: 36.0 1st Qu.:11.00 1st Qu.:25.00 1st Qu.: 29.00
## Median : 68.0 Median :12.00 Median :31.00 Median : 48.00
## Mean : 71.1 Mean :12.99 Mean :29.35 Mean : 48.48
## 3rd Qu.:105.0 3rd Qu.:13.00 3rd Qu.:33.00 3rd Qu.: 65.00
## Max. :260.0 Max. :59.00 Max. :78.00 Max. :174.00
##
## PromCntCard12 PromCntCard36 PromCntCardAll StatusCat96NK
## Min. : 0.000 Min. : 2.00 Min. : 2.00 A:5826
## 1st Qu.: 5.000 1st Qu.: 7.00 1st Qu.:12.00 E: 227
## Median : 6.000 Median :13.00 Median :19.00 F: 660
## Mean : 5.392 Mean :11.95 Mean :19.01 L: 34
## 3rd Qu.: 6.000 3rd Qu.:16.00 3rd Qu.:26.00 N: 574
## Max. :17.000 Max. :28.00 Max. :56.00 S:2365
##
## StatusCatStarAll DemCluster DemAge DemGender DemHomeOwner
## Min. :0.0000 Min. : 0.00 Min. : 0.00 F:5223 H:5377
## 1st Qu.:0.0000 1st Qu.:14.00 1st Qu.:47.00 M:3925 U:4309
## Median :1.0000 Median :27.00 Median :60.00 U: 538
## Mean :0.5406 Mean :27.15 Mean :59.15
## 3rd Qu.:1.0000 3rd Qu.:40.00 3rd Qu.:73.00
## Max. :1.0000 Max. :53.00 Max. :87.00
## NA's :2407
## DemMedHomeValue DemPctVeterans DemMedIncome
## $0 : 103 Min. : 0.0 $0 :2357
## $67,500: 30 1st Qu.:25.0 $43,100: 10
## $55,000: 24 Median :31.0 $46,250: 8
## $87,500: 21 Mean :30.6 $48,772: 8
## $41,900: 20 3rd Qu.:37.0 $72,339: 8
## $57,500: 20 Max. :85.0 $40,054: 7
## (Other):9468 (Other):7288
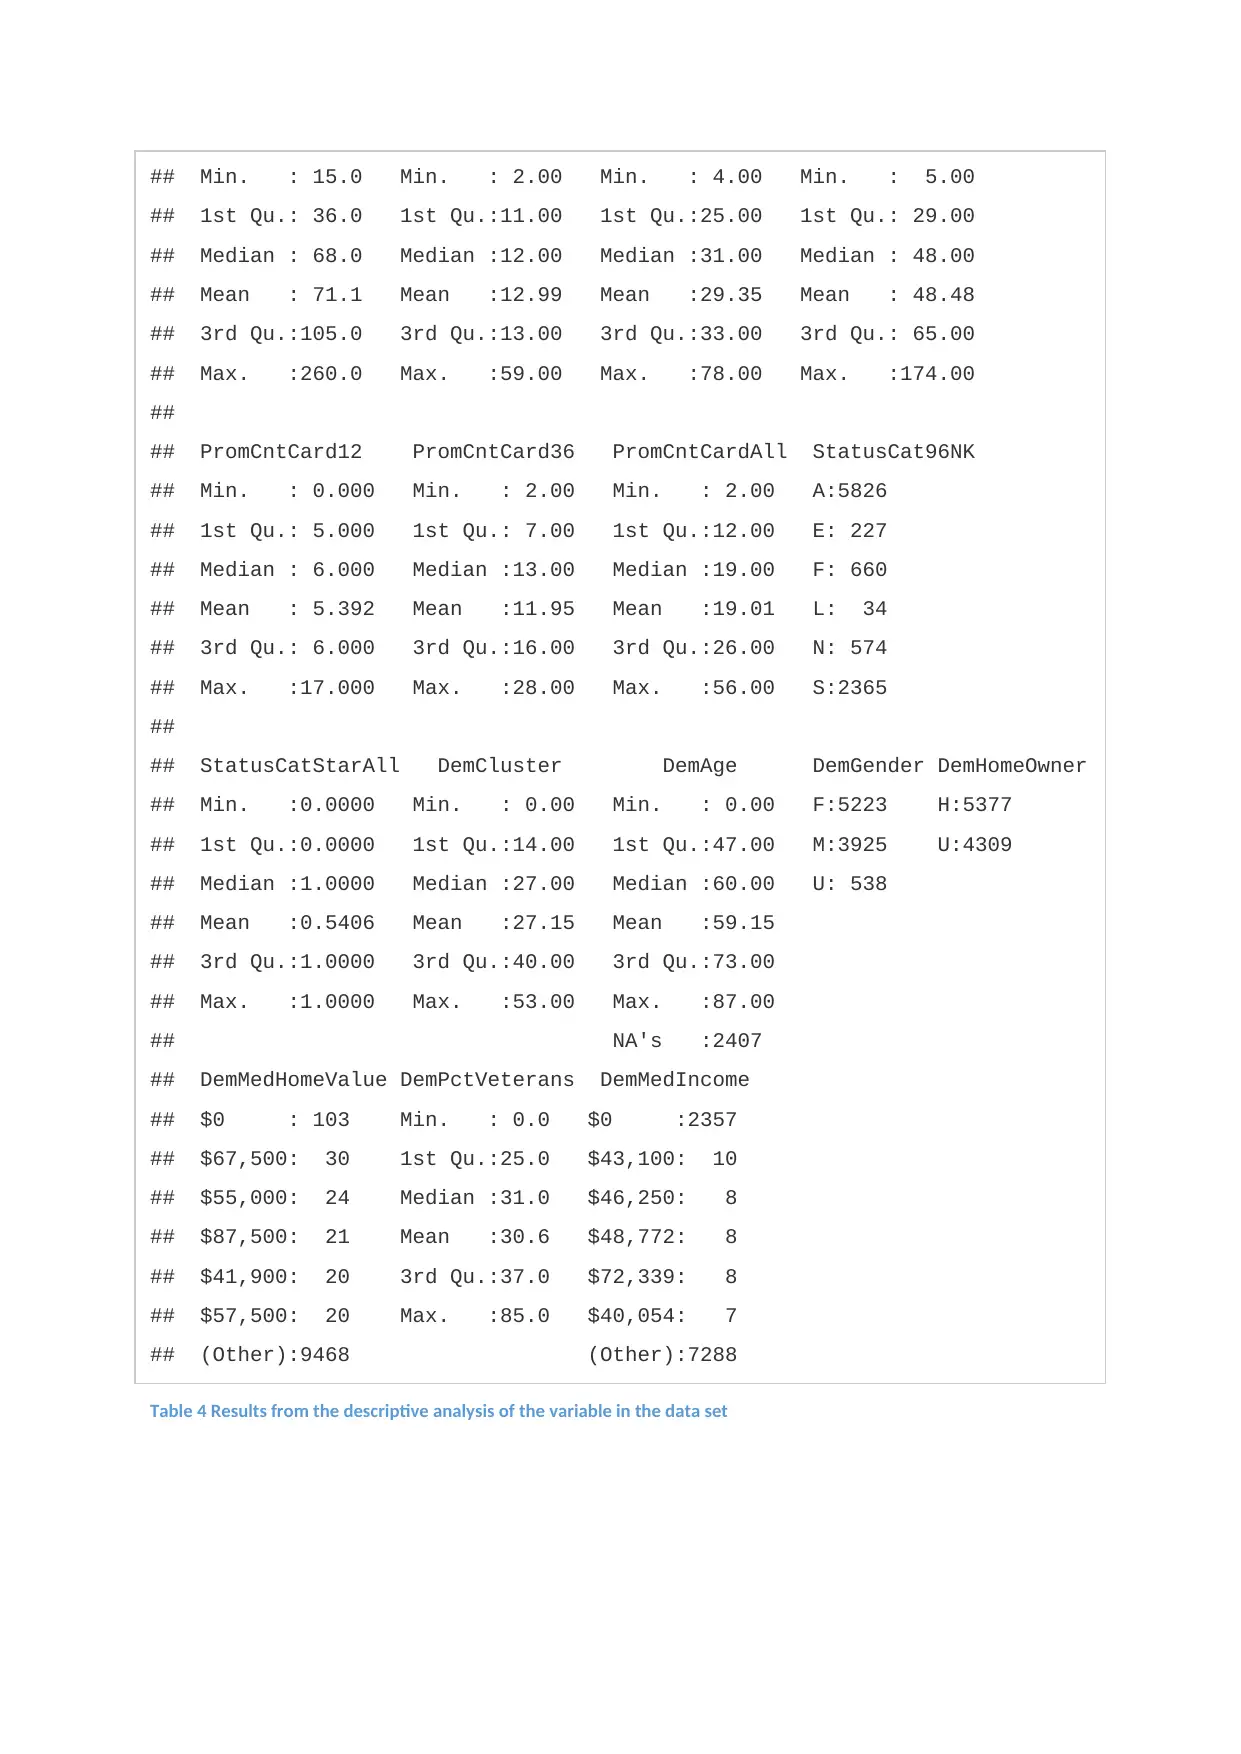
Table 4 Results from the descriptive analysis of the variable in the data set
## 1st Qu.: 36.0 1st Qu.:11.00 1st Qu.:25.00 1st Qu.: 29.00
## Median : 68.0 Median :12.00 Median :31.00 Median : 48.00
## Mean : 71.1 Mean :12.99 Mean :29.35 Mean : 48.48
## 3rd Qu.:105.0 3rd Qu.:13.00 3rd Qu.:33.00 3rd Qu.: 65.00
## Max. :260.0 Max. :59.00 Max. :78.00 Max. :174.00
##
## PromCntCard12 PromCntCard36 PromCntCardAll StatusCat96NK
## Min. : 0.000 Min. : 2.00 Min. : 2.00 A:5826
## 1st Qu.: 5.000 1st Qu.: 7.00 1st Qu.:12.00 E: 227
## Median : 6.000 Median :13.00 Median :19.00 F: 660
## Mean : 5.392 Mean :11.95 Mean :19.01 L: 34
## 3rd Qu.: 6.000 3rd Qu.:16.00 3rd Qu.:26.00 N: 574
## Max. :17.000 Max. :28.00 Max. :56.00 S:2365
##
## StatusCatStarAll DemCluster DemAge DemGender DemHomeOwner
## Min. :0.0000 Min. : 0.00 Min. : 0.00 F:5223 H:5377
## 1st Qu.:0.0000 1st Qu.:14.00 1st Qu.:47.00 M:3925 U:4309
## Median :1.0000 Median :27.00 Median :60.00 U: 538
## Mean :0.5406 Mean :27.15 Mean :59.15
## 3rd Qu.:1.0000 3rd Qu.:40.00 3rd Qu.:73.00
## Max. :1.0000 Max. :53.00 Max. :87.00
## NA's :2407
## DemMedHomeValue DemPctVeterans DemMedIncome
## $0 : 103 Min. : 0.0 $0 :2357
## $67,500: 30 1st Qu.:25.0 $43,100: 10
## $55,000: 24 Median :31.0 $46,250: 8
## $87,500: 21 Mean :30.6 $48,772: 8
## $41,900: 20 3rd Qu.:37.0 $72,339: 8
## $57,500: 20 Max. :85.0 $40,054: 7
## (Other):9468 (Other):7288
Table 4 Results from the descriptive analysis of the variable in the data set
⊘ This is a preview!⊘
Do you want full access?
Subscribe today to unlock all pages.
Trusted by 1+ million students worldwide
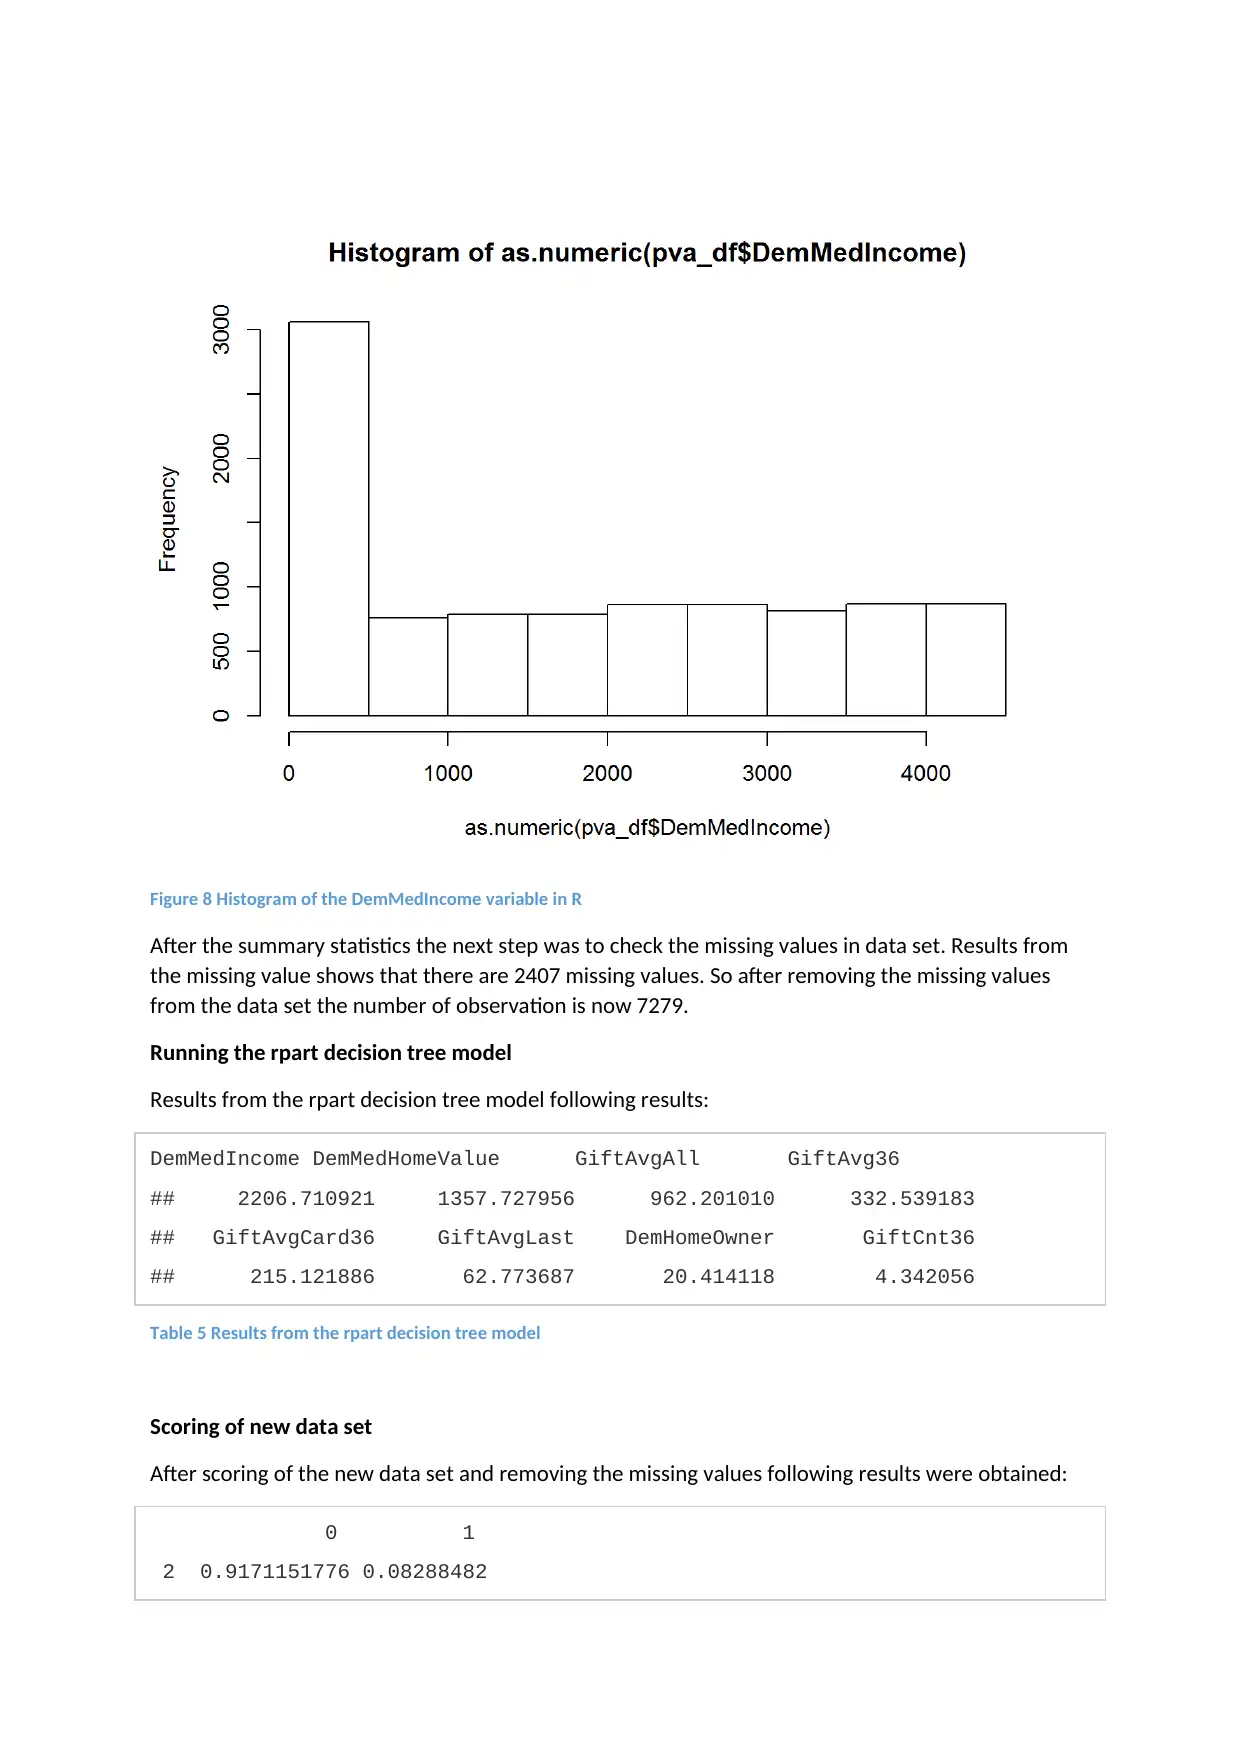
Figure 8 Histogram of the DemMedIncome variable in R
After the summary statistics the next step was to check the missing values in data set. Results from
the missing value shows that there are 2407 missing values. So after removing the missing values
from the data set the number of observation is now 7279.
Running the rpart decision tree model
Results from the rpart decision tree model following results:
DemMedIncome DemMedHomeValue GiftAvgAll GiftAvg36
## 2206.710921 1357.727956 962.201010 332.539183
## GiftAvgCard36 GiftAvgLast DemHomeOwner GiftCnt36
## 215.121886 62.773687 20.414118 4.342056
Table 5 Results from the rpart decision tree model
Scoring of new data set
After scoring of the new data set and removing the missing values following results were obtained:
0 1
2 0.9171151776 0.08288482
Paraphrase This Document
Need a fresh take? Get an instant paraphrase of this document with our AI Paraphraser

5 0.9672897196 0.03271028
6 0.0004545455 0.99954545
7 0.9672897196 0.03271028
14 0.9672897196 0.03271028
15 0.9171151776 0.08288482
Table 6 Results from scoring of the new data set
6 0.0004545455 0.99954545
7 0.9672897196 0.03271028
14 0.9672897196 0.03271028
15 0.9171151776 0.08288482
Table 6 Results from scoring of the new data set
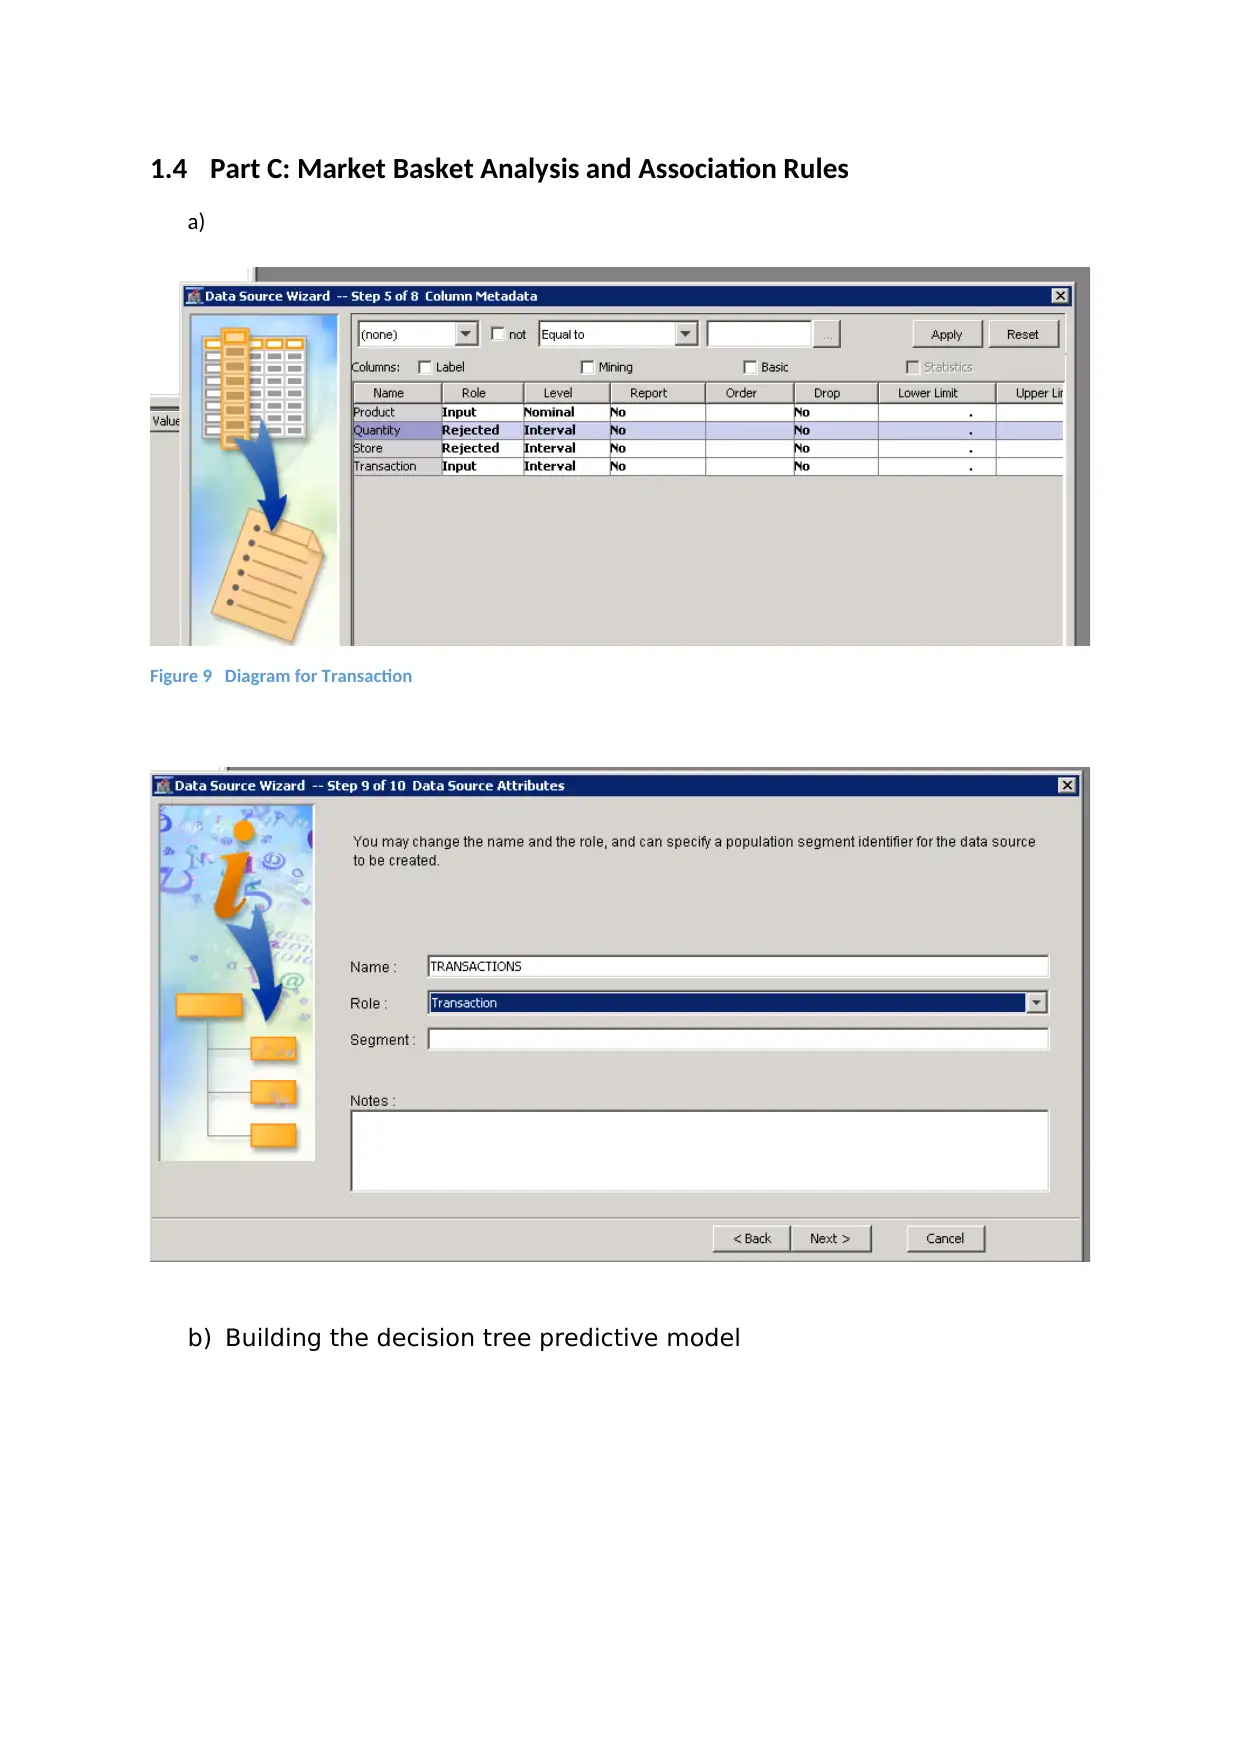
1.4 Part C: Market Basket Analysis and Association Rules
a)
Figure 9 Diagram for Transaction
b) Building the decision tree predictive model
a)
Figure 9 Diagram for Transaction
b) Building the decision tree predictive model
⊘ This is a preview!⊘
Do you want full access?
Subscribe today to unlock all pages.
Trusted by 1+ million students worldwide
1 out of 14
Your All-in-One AI-Powered Toolkit for Academic Success.
+13062052269
info@desklib.com
Available 24*7 on WhatsApp / Email
![[object Object]](/_next/static/media/star-bottom.7253800d.svg)
Unlock your academic potential
Copyright © 2020–2026 A2Z Services. All Rights Reserved. Developed and managed by ZUCOL.