Predictive Analytics for Passenger Recommendations in Airport Lounges
VerifiedAdded on 2023/06/14
|19
|2372
|382
AI Summary
This report analyzes passenger recommendations on airport lounges using statistical techniques and data mining tools. The logistic regression and decision tree models are used to predict passenger recommendations based on satisfaction ratings. The report recommends improving catering services and using the decision tree model for further analysis.
Contribute Materials
Your contribution can guide someone’s learning journey. Share your
documents today.
Running Head: PREDICTIVE ANALYTICS
Predictive Analytics
Name of the Student
Name of the University
Author Note
Predictive Analytics
Name of the Student
Name of the University
Author Note
Secure Best Marks with AI Grader
Need help grading? Try our AI Grader for instant feedback on your assignments.
1PREDICTIVE ANALYTICS
Table of Contents
Background of the Study............................................................................................................3
Preparation of Data....................................................................................................................3
Discovering the Relationship.....................................................................................................4
Creation of the Model................................................................................................................7
Logistic Regression................................................................................................................7
Process................................................................................................................................8
Output.................................................................................................................................9
Decision Tree.........................................................................................................................9
Process................................................................................................................................9
Output...............................................................................................................................10
Model Evaluation.....................................................................................................................11
Logistic Regression..............................................................................................................11
Prediction Model..............................................................................................................11
ROC Curve.......................................................................................................................12
Lift Chart..........................................................................................................................13
Accuracy..........................................................................................................................13
Decision Tree.......................................................................................................................13
Prediction Model..............................................................................................................14
ROC Curve.......................................................................................................................15
Lift Chart..........................................................................................................................15

2PREDICTIVE ANALYTICS
Accuracy..........................................................................................................................16
Overall Comparison.............................................................................................................16
Recommendations....................................................................................................................17
3PREDICTIVE ANALYTICS
Background of the Study
Airport Quality Agency is in the interest of reviewing different aspects of travelling
by flight that the flight passengers experience in their trip. The agency is interested in
collecting information of the passenger recommendations on four different aspects. They are
airlines, airports, lounges and seats. In this report, the analysis of the recommendations will
be conducted on the dataset on lounges. To collect the information on the passenger
recommendations, a mini survey has been conducted by the Airport Quality Agency (AQA).
The survey was conducted with the help of Skytrax and they collected the customer reviews
on various aspects that the passengers experience in the lounge area. This is a primary survey
that the Airport Quality Agency is conducting. A further study will be conducted based on
these results in the future where the data will be collected from different active social media
networks such as facebook and twitter for future analysis.
In this report, the data collected by Skytrax will be analysed using appropriate
statistical techniques and with the help of the data mining tool of Rapid Miner. This analysis
will be mainly based on the data collected on the various aspects of the lounge area. The
better the lounge area of any airport, more people will be preferring to avail flight due to the
better service and definitely for the lesser time.
The primary objective of this research is to identify which are the factors that are
significantly responsible for recommendation of the lounge area by the passengers. In order
to identify these factors, the data collected by Skytrax will be explored and the necessary
results will be discussed accordingly.
Preparation of Data
The dataset on lounge consists information about a lot of aspects. All these aspects are
not necessary for the recommendation of airport to the non-existing passengers. Thus, the
Secure Best Marks with AI Grader
Need help grading? Try our AI Grader for instant feedback on your assignments.
4PREDICTIVE ANALYTICS
ratings given on various services that provided to the customers in the lounge area are
important. Hence, the ratings on comfort, catering, staff service, bar and beverages,
cleanliness, washrooms and Wi-Fi connectivity are considered as important aspects that can
affect people recommending flight travel. The data contains a lot of missing values.
Manipulation of all the missing data will be conducted during the analysis process using rapid
miner.
Discovering the Relationship
A passenger is expected to recommend airport services to others only if the services
received by the passenger is satisfactory. Thus, the satisfaction ratings given by the customers
on several services provided in the lounge area have been collected. The data have been
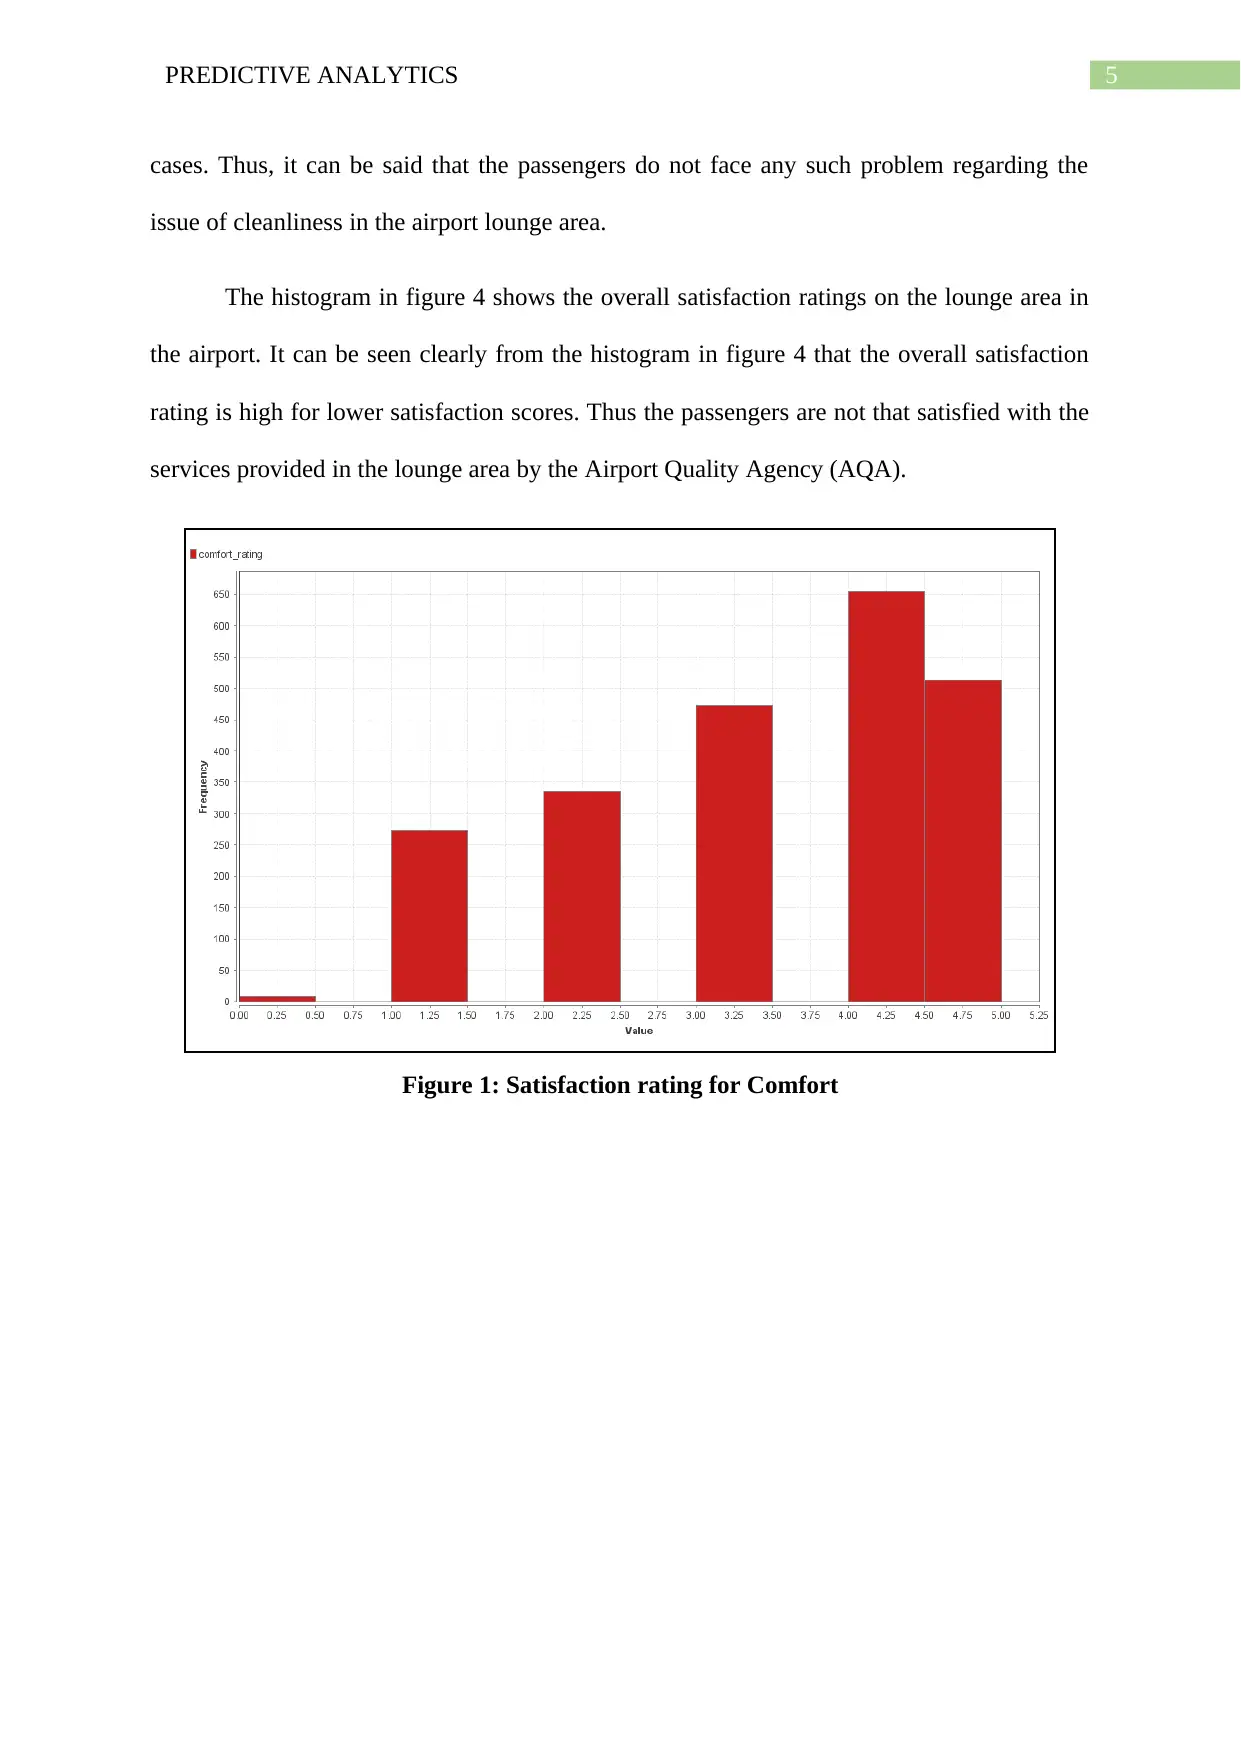
explored and expressed with the help of histograms. It can be seen clearly form figure 1 that,
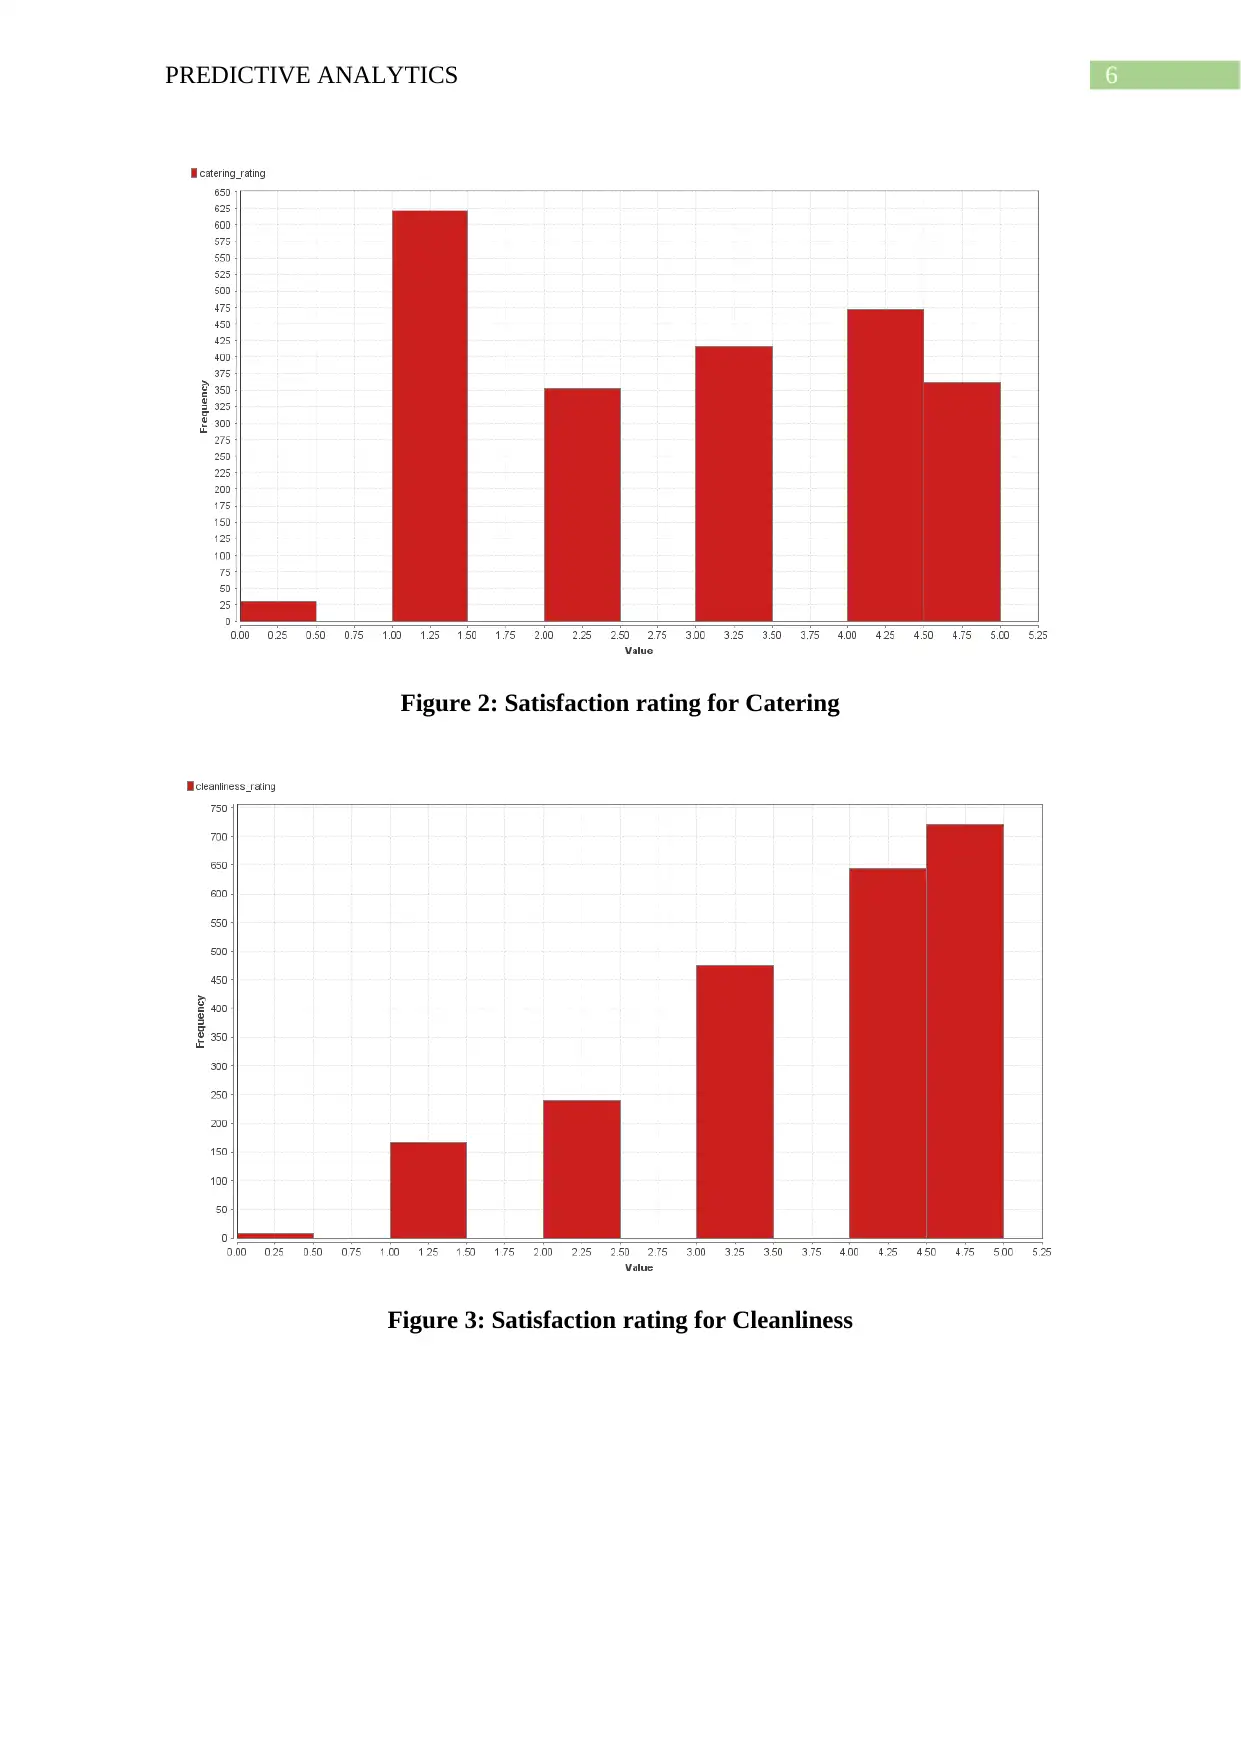
the frequency on the higher rating scores are higher on the matter of comfort. Again, figure 2
shows the satisfaction ratings on catering service in the lounge area.
It can be seen from the histogram in figure 2 that ratings are not that good. A lot of
people have given a lower rating to the service. Thus, this can be considered as a drawback
for the Airport Quality Agency (AQA). Passengers need to wait longer hours in the airport
lounge area to catch a flight. Thus, if the catering is not up to the mark, people will not be
eating in the waiting time and this will cause a lot of inconvenience. On the other hand,
passengers who have a very long waiting time will have to eat the low quality food and in
turn may fall sick. Thus, it is important to improve the catering service in the airport lounge
area for the increasing recommendations.
The histogram in figure 3 shows the satisfaction ratings on the cleanliness in the
lounge area. The figure clearly shows that the satisfaction ratings are high in most of the
ratings given on various services that provided to the customers in the lounge area are
important. Hence, the ratings on comfort, catering, staff service, bar and beverages,
cleanliness, washrooms and Wi-Fi connectivity are considered as important aspects that can
affect people recommending flight travel. The data contains a lot of missing values.
Manipulation of all the missing data will be conducted during the analysis process using rapid
miner.
Discovering the Relationship
A passenger is expected to recommend airport services to others only if the services
received by the passenger is satisfactory. Thus, the satisfaction ratings given by the customers
on several services provided in the lounge area have been collected. The data have been
explored and expressed with the help of histograms. It can be seen clearly form figure 1 that,
the frequency on the higher rating scores are higher on the matter of comfort. Again, figure 2
shows the satisfaction ratings on catering service in the lounge area.
It can be seen from the histogram in figure 2 that ratings are not that good. A lot of
people have given a lower rating to the service. Thus, this can be considered as a drawback
for the Airport Quality Agency (AQA). Passengers need to wait longer hours in the airport
lounge area to catch a flight. Thus, if the catering is not up to the mark, people will not be
eating in the waiting time and this will cause a lot of inconvenience. On the other hand,
passengers who have a very long waiting time will have to eat the low quality food and in
turn may fall sick. Thus, it is important to improve the catering service in the airport lounge
area for the increasing recommendations.
The histogram in figure 3 shows the satisfaction ratings on the cleanliness in the
lounge area. The figure clearly shows that the satisfaction ratings are high in most of the
5PREDICTIVE ANALYTICS
cases. Thus, it can be said that the passengers do not face any such problem regarding the
issue of cleanliness in the airport lounge area.
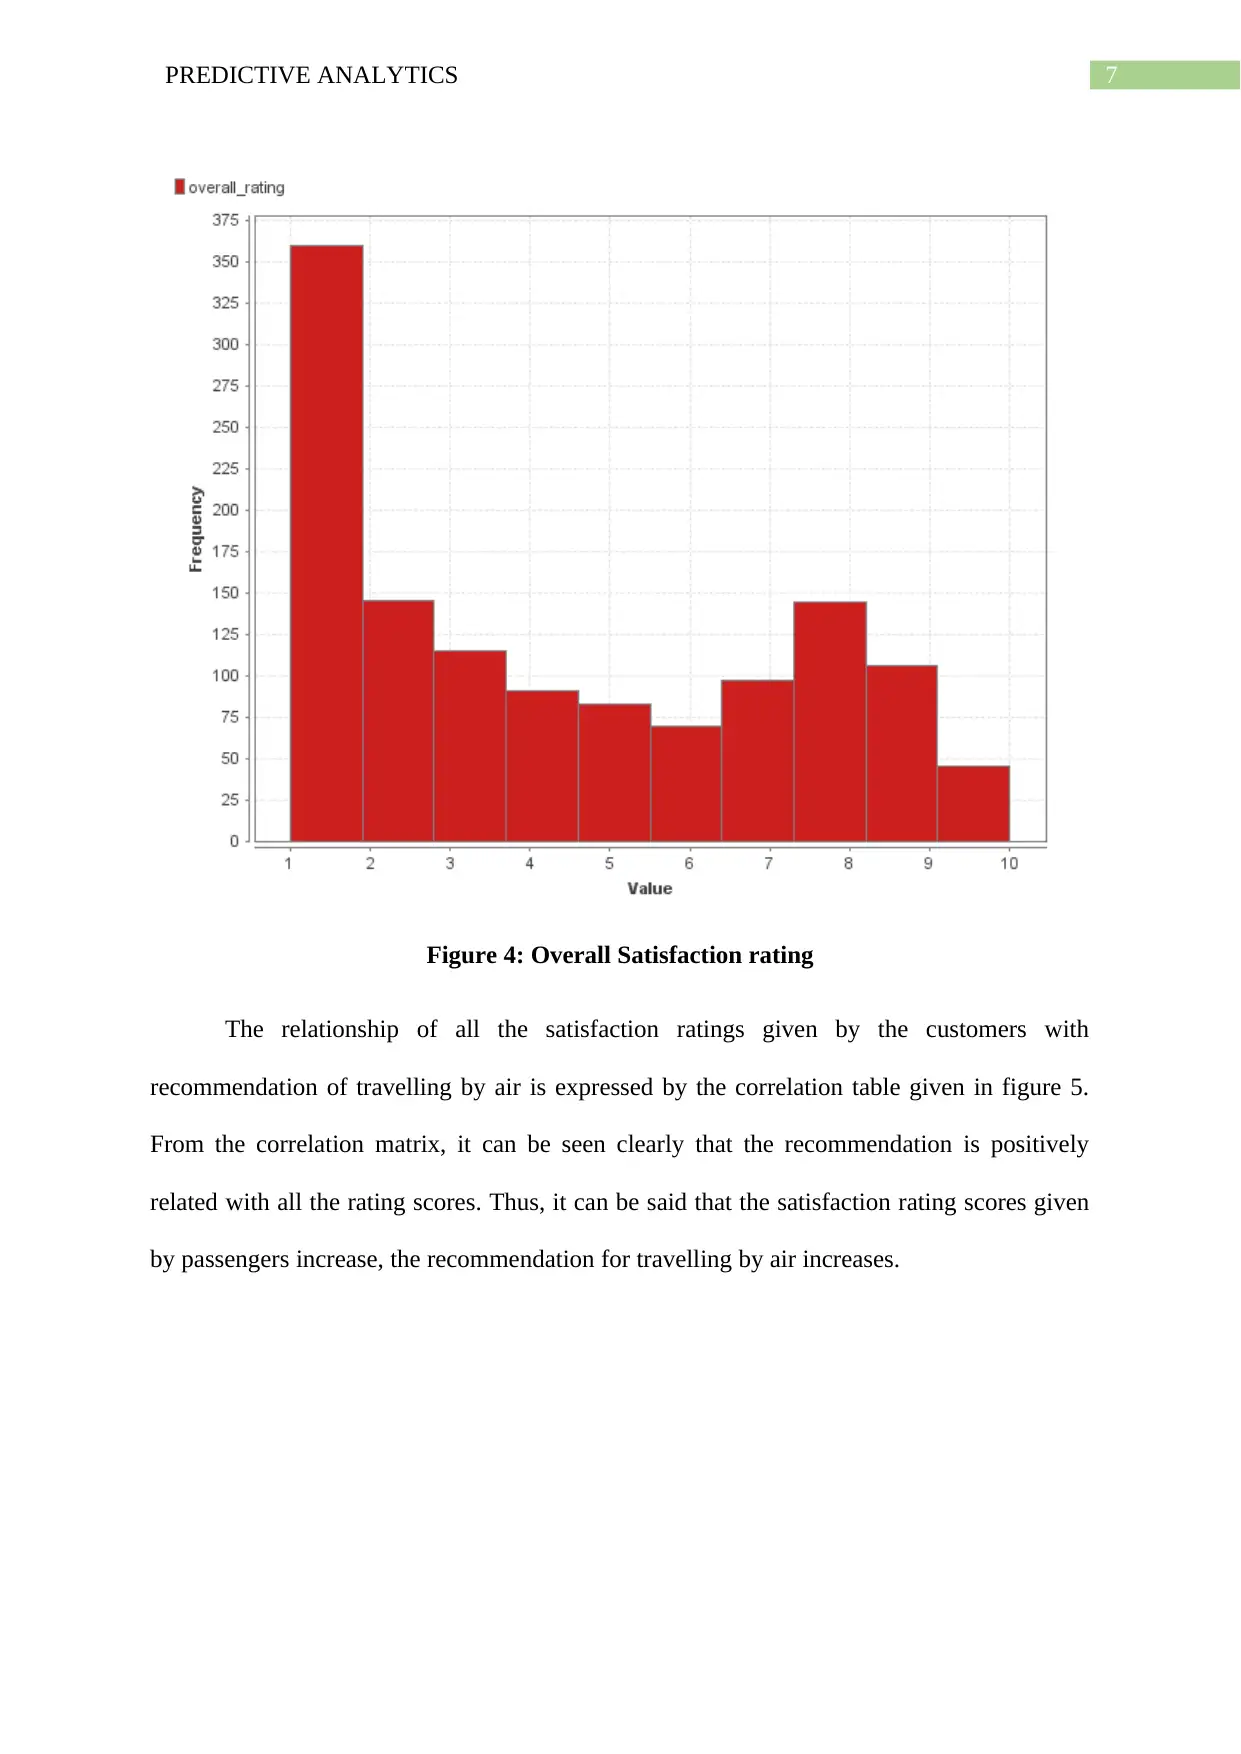
The histogram in figure 4 shows the overall satisfaction ratings on the lounge area in
the airport. It can be seen clearly from the histogram in figure 4 that the overall satisfaction
rating is high for lower satisfaction scores. Thus the passengers are not that satisfied with the
services provided in the lounge area by the Airport Quality Agency (AQA).
Figure 1: Satisfaction rating for Comfort
cases. Thus, it can be said that the passengers do not face any such problem regarding the
issue of cleanliness in the airport lounge area.
The histogram in figure 4 shows the overall satisfaction ratings on the lounge area in
the airport. It can be seen clearly from the histogram in figure 4 that the overall satisfaction
rating is high for lower satisfaction scores. Thus the passengers are not that satisfied with the
services provided in the lounge area by the Airport Quality Agency (AQA).
Figure 1: Satisfaction rating for Comfort
6PREDICTIVE ANALYTICS
Figure 2: Satisfaction rating for Catering
Figure 3: Satisfaction rating for Cleanliness
Figure 2: Satisfaction rating for Catering
Figure 3: Satisfaction rating for Cleanliness
Paraphrase This Document
Need a fresh take? Get an instant paraphrase of this document with our AI Paraphraser
7PREDICTIVE ANALYTICS
Figure 4: Overall Satisfaction rating
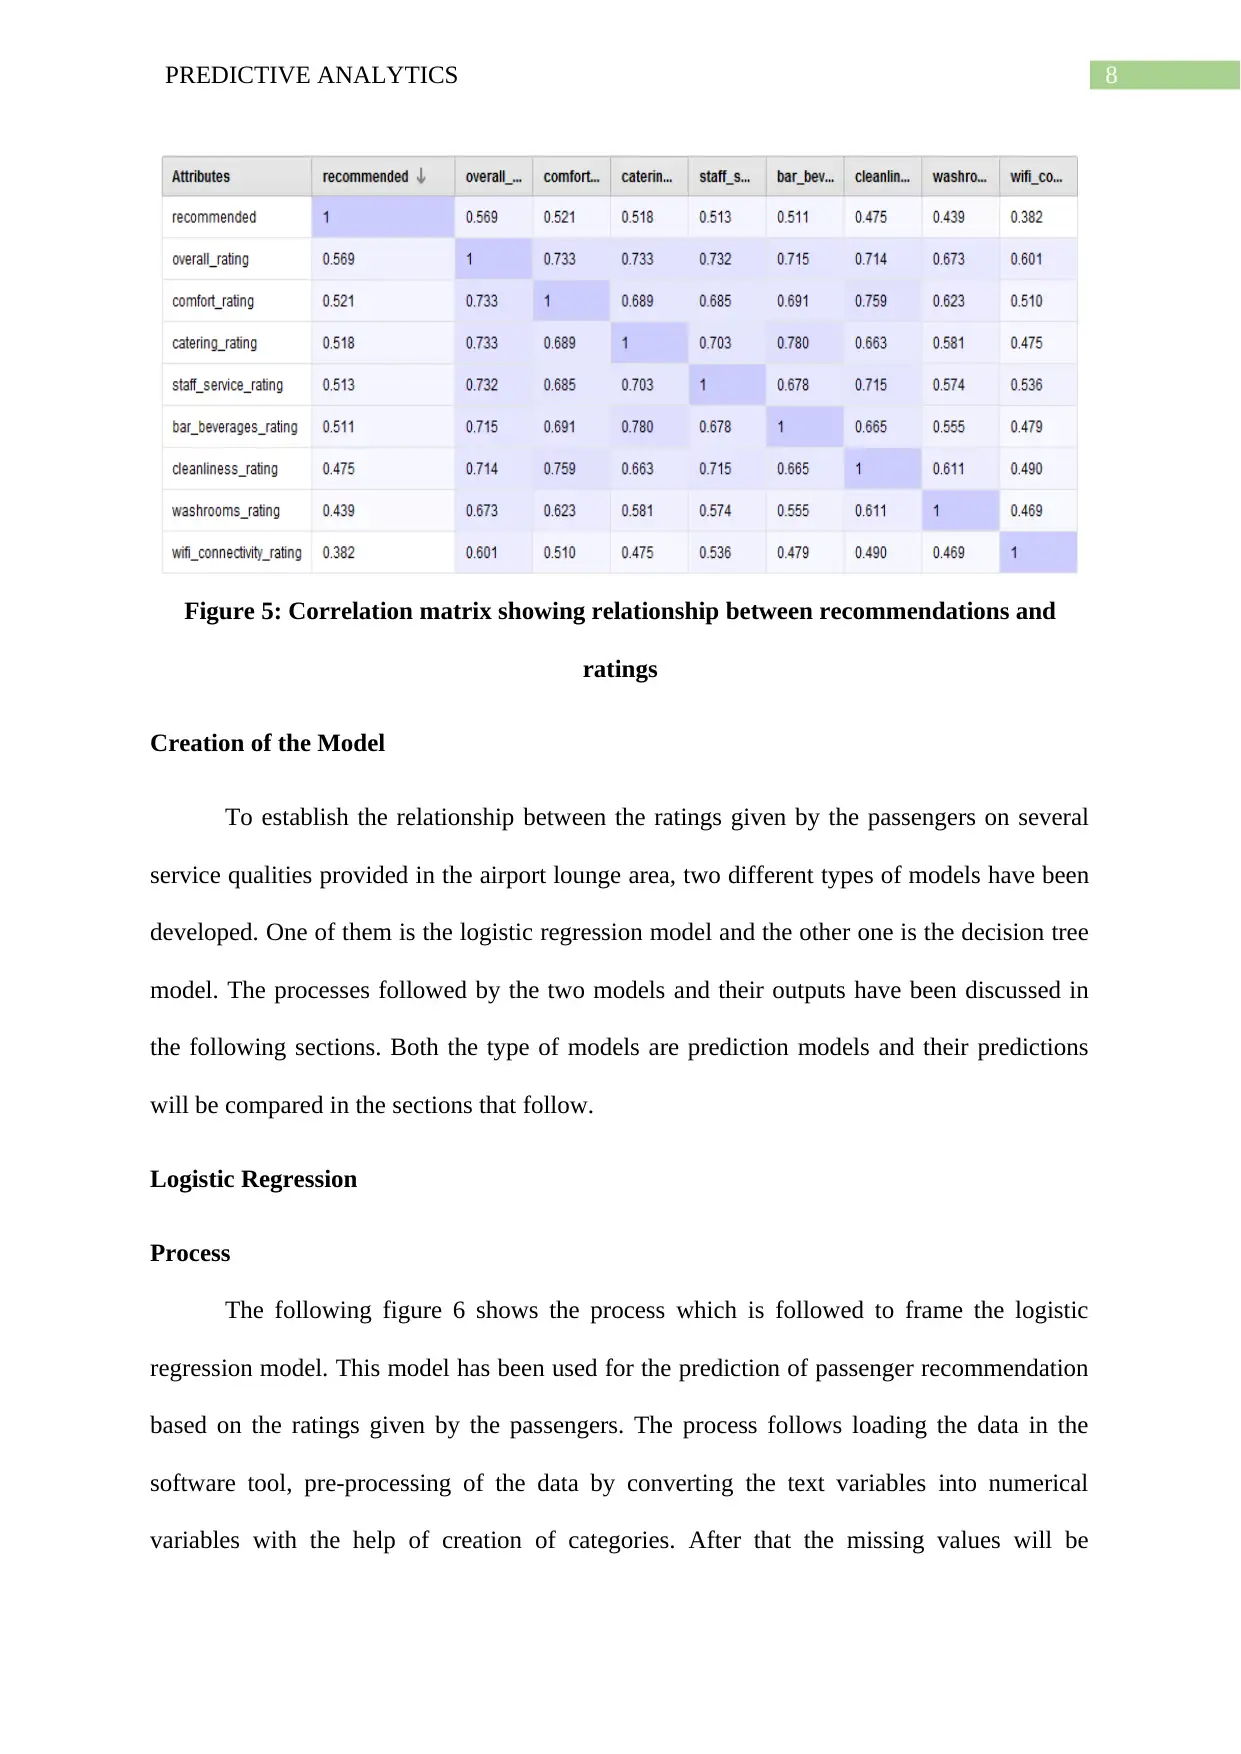
The relationship of all the satisfaction ratings given by the customers with
recommendation of travelling by air is expressed by the correlation table given in figure 5.
From the correlation matrix, it can be seen clearly that the recommendation is positively
related with all the rating scores. Thus, it can be said that the satisfaction rating scores given
by passengers increase, the recommendation for travelling by air increases.
Figure 4: Overall Satisfaction rating
The relationship of all the satisfaction ratings given by the customers with
recommendation of travelling by air is expressed by the correlation table given in figure 5.
From the correlation matrix, it can be seen clearly that the recommendation is positively
related with all the rating scores. Thus, it can be said that the satisfaction rating scores given
by passengers increase, the recommendation for travelling by air increases.
8PREDICTIVE ANALYTICS
Figure 5: Correlation matrix showing relationship between recommendations and
ratings
Creation of the Model
To establish the relationship between the ratings given by the passengers on several
service qualities provided in the airport lounge area, two different types of models have been
developed. One of them is the logistic regression model and the other one is the decision tree
model. The processes followed by the two models and their outputs have been discussed in
the following sections. Both the type of models are prediction models and their predictions
will be compared in the sections that follow.
Logistic Regression
Process
The following figure 6 shows the process which is followed to frame the logistic
regression model. This model has been used for the prediction of passenger recommendation
based on the ratings given by the passengers. The process follows loading the data in the
software tool, pre-processing of the data by converting the text variables into numerical
variables with the help of creation of categories. After that the missing values will be
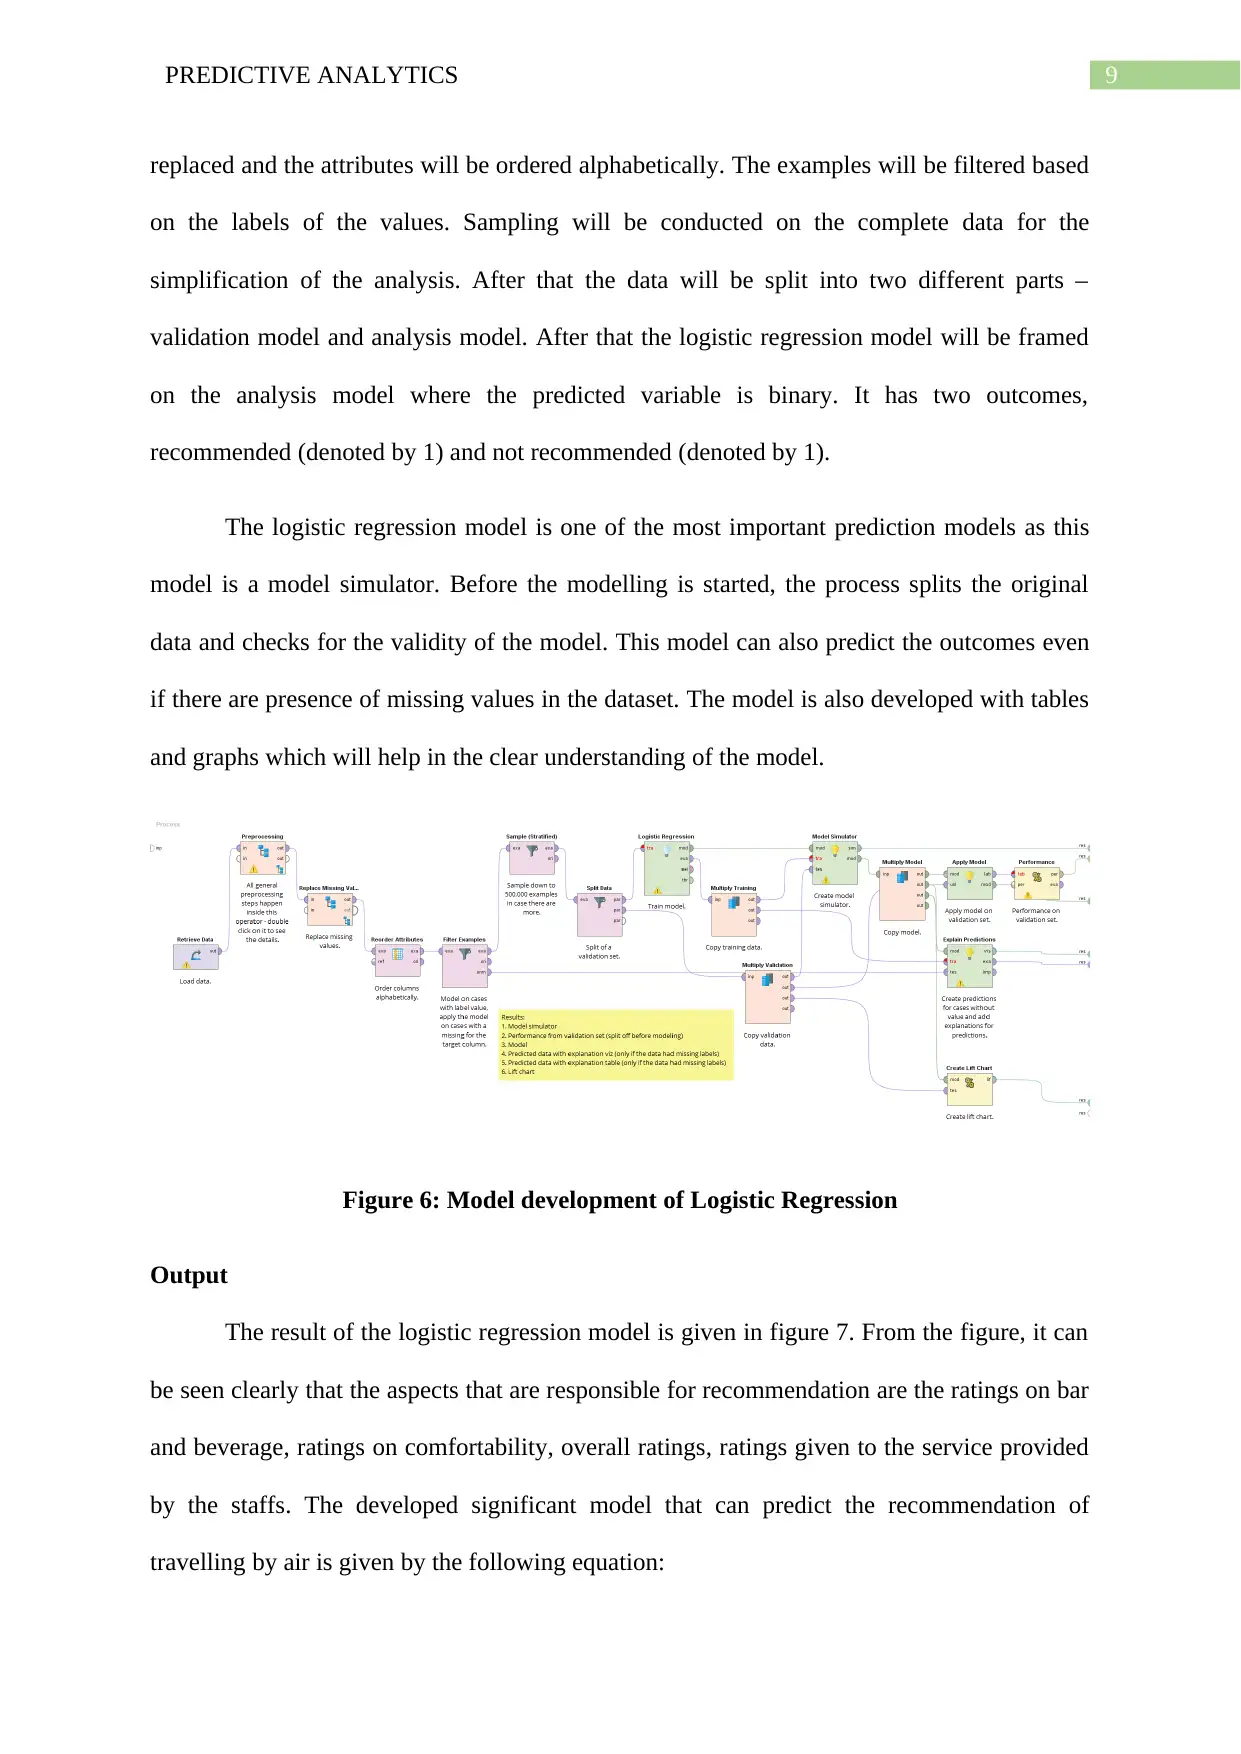
9PREDICTIVE ANALYTICS
replaced and the attributes will be ordered alphabetically. The examples will be filtered based
on the labels of the values. Sampling will be conducted on the complete data for the
simplification of the analysis. After that the data will be split into two different parts –
validation model and analysis model. After that the logistic regression model will be framed
on the analysis model where the predicted variable is binary. It has two outcomes,
recommended (denoted by 1) and not recommended (denoted by 1).
The logistic regression model is one of the most important prediction models as this
model is a model simulator. Before the modelling is started, the process splits the original
data and checks for the validity of the model. This model can also predict the outcomes even
if there are presence of missing values in the dataset. The model is also developed with tables
and graphs which will help in the clear understanding of the model.
Figure 6: Model development of Logistic Regression
Output
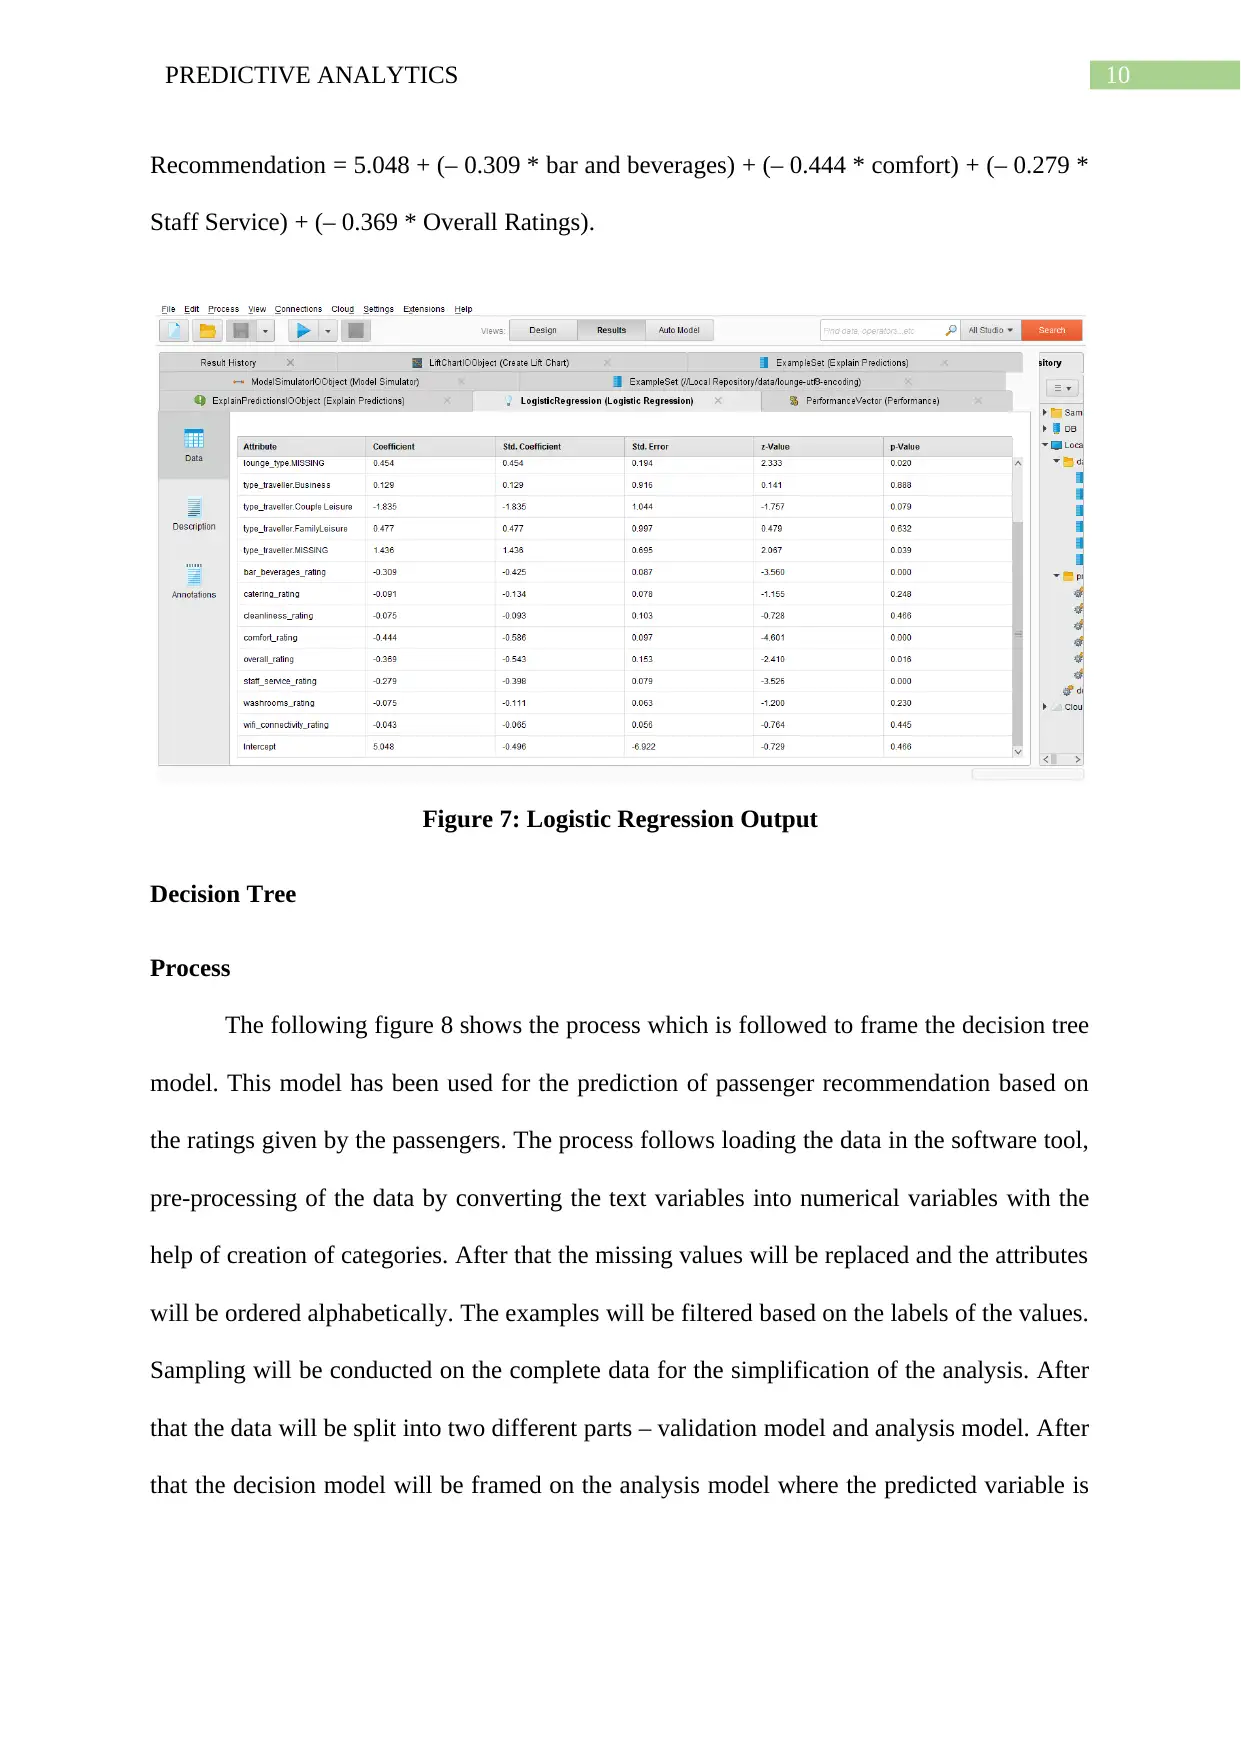
The result of the logistic regression model is given in figure 7. From the figure, it can
be seen clearly that the aspects that are responsible for recommendation are the ratings on bar
and beverage, ratings on comfortability, overall ratings, ratings given to the service provided
by the staffs. The developed significant model that can predict the recommendation of
travelling by air is given by the following equation:
replaced and the attributes will be ordered alphabetically. The examples will be filtered based
on the labels of the values. Sampling will be conducted on the complete data for the
simplification of the analysis. After that the data will be split into two different parts –
validation model and analysis model. After that the logistic regression model will be framed
on the analysis model where the predicted variable is binary. It has two outcomes,
recommended (denoted by 1) and not recommended (denoted by 1).
The logistic regression model is one of the most important prediction models as this
model is a model simulator. Before the modelling is started, the process splits the original
data and checks for the validity of the model. This model can also predict the outcomes even
if there are presence of missing values in the dataset. The model is also developed with tables
and graphs which will help in the clear understanding of the model.
Figure 6: Model development of Logistic Regression
Output
The result of the logistic regression model is given in figure 7. From the figure, it can
be seen clearly that the aspects that are responsible for recommendation are the ratings on bar
and beverage, ratings on comfortability, overall ratings, ratings given to the service provided
by the staffs. The developed significant model that can predict the recommendation of
travelling by air is given by the following equation:
Secure Best Marks with AI Grader
Need help grading? Try our AI Grader for instant feedback on your assignments.
10PREDICTIVE ANALYTICS
Recommendation = 5.048 + (– 0.309 * bar and beverages) + (– 0.444 * comfort) + (– 0.279 *
Staff Service) + (– 0.369 * Overall Ratings).
Figure 7: Logistic Regression Output
Decision Tree
Process
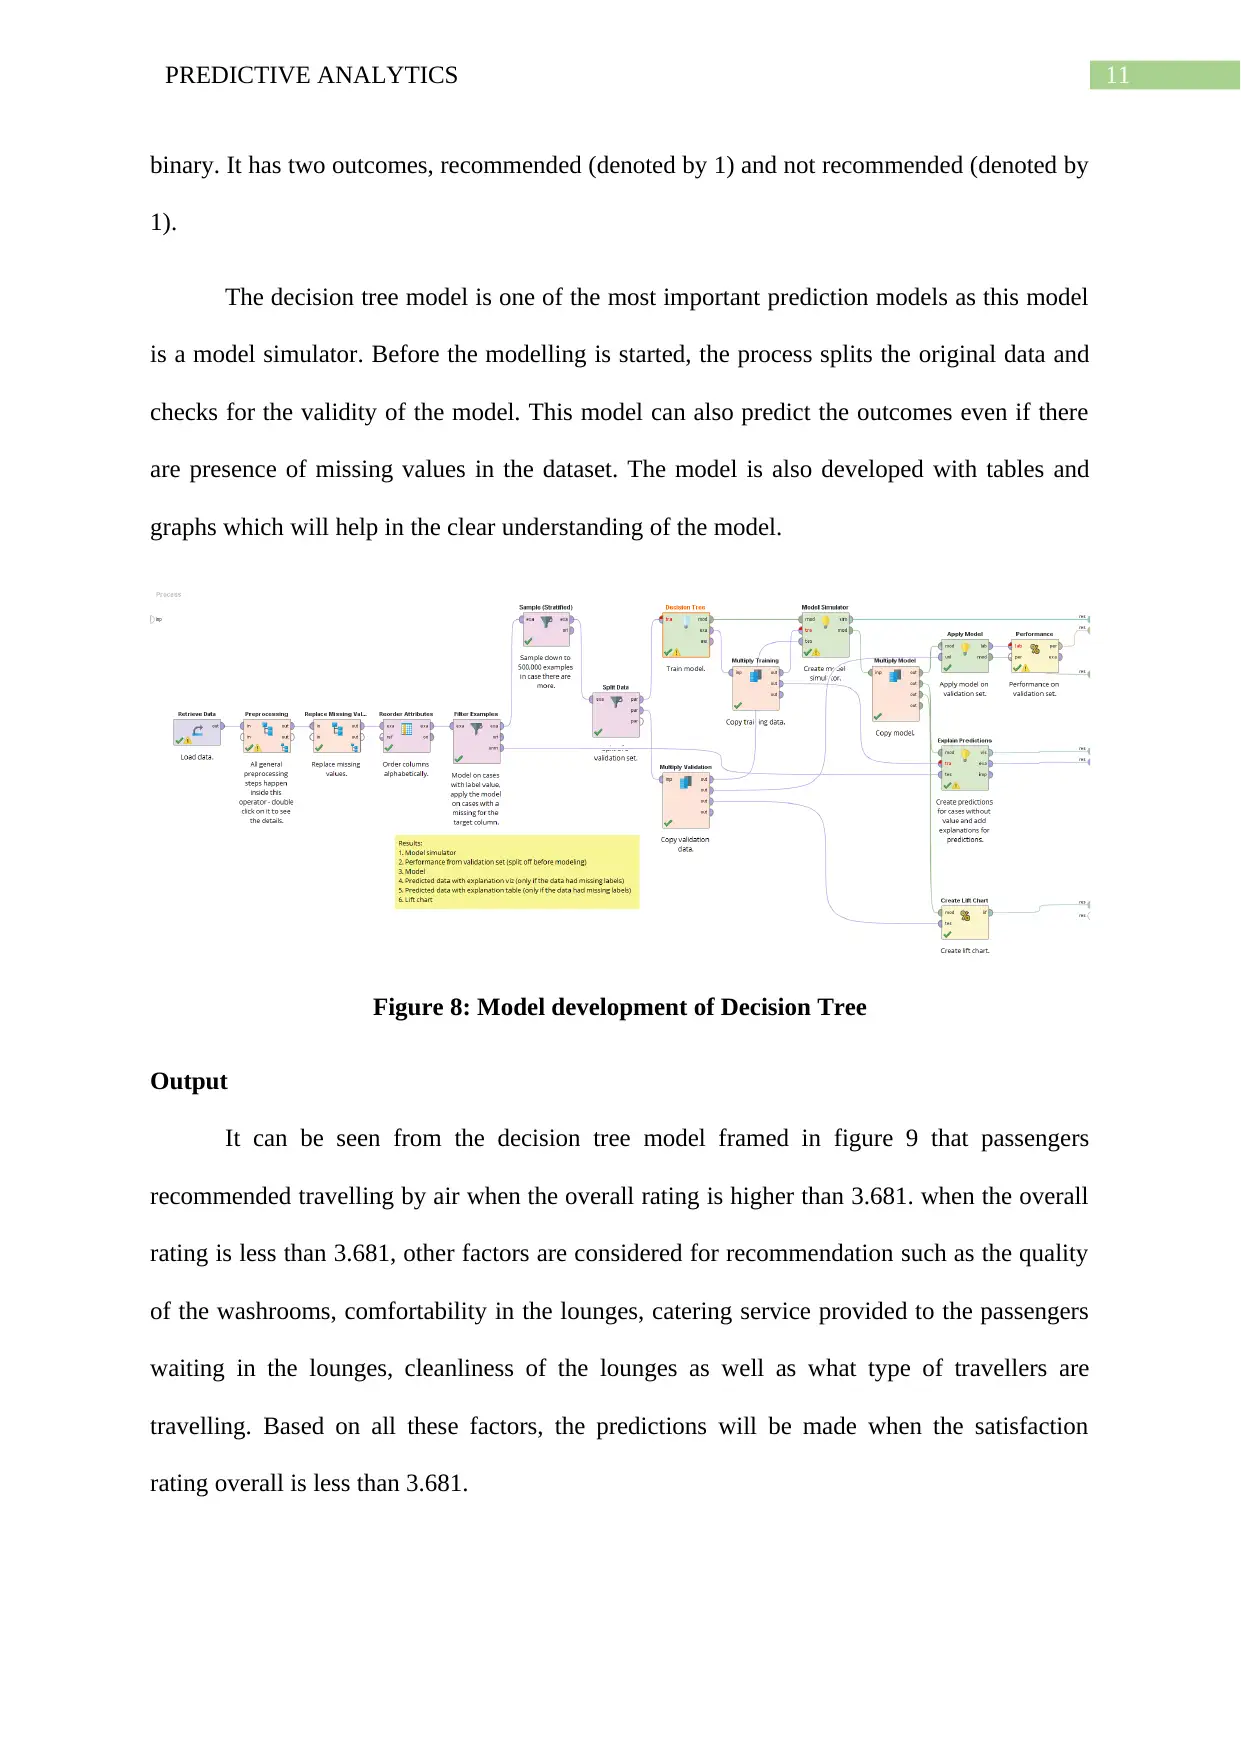
The following figure 8 shows the process which is followed to frame the decision tree
model. This model has been used for the prediction of passenger recommendation based on
the ratings given by the passengers. The process follows loading the data in the software tool,
pre-processing of the data by converting the text variables into numerical variables with the
help of creation of categories. After that the missing values will be replaced and the attributes
will be ordered alphabetically. The examples will be filtered based on the labels of the values.
Sampling will be conducted on the complete data for the simplification of the analysis. After
that the data will be split into two different parts – validation model and analysis model. After
that the decision model will be framed on the analysis model where the predicted variable is
Recommendation = 5.048 + (– 0.309 * bar and beverages) + (– 0.444 * comfort) + (– 0.279 *
Staff Service) + (– 0.369 * Overall Ratings).
Figure 7: Logistic Regression Output
Decision Tree
Process
The following figure 8 shows the process which is followed to frame the decision tree
model. This model has been used for the prediction of passenger recommendation based on
the ratings given by the passengers. The process follows loading the data in the software tool,
pre-processing of the data by converting the text variables into numerical variables with the
help of creation of categories. After that the missing values will be replaced and the attributes
will be ordered alphabetically. The examples will be filtered based on the labels of the values.
Sampling will be conducted on the complete data for the simplification of the analysis. After
that the data will be split into two different parts – validation model and analysis model. After
that the decision model will be framed on the analysis model where the predicted variable is
11PREDICTIVE ANALYTICS
binary. It has two outcomes, recommended (denoted by 1) and not recommended (denoted by
1).
The decision tree model is one of the most important prediction models as this model
is a model simulator. Before the modelling is started, the process splits the original data and
checks for the validity of the model. This model can also predict the outcomes even if there
are presence of missing values in the dataset. The model is also developed with tables and
graphs which will help in the clear understanding of the model.
Figure 8: Model development of Decision Tree
Output
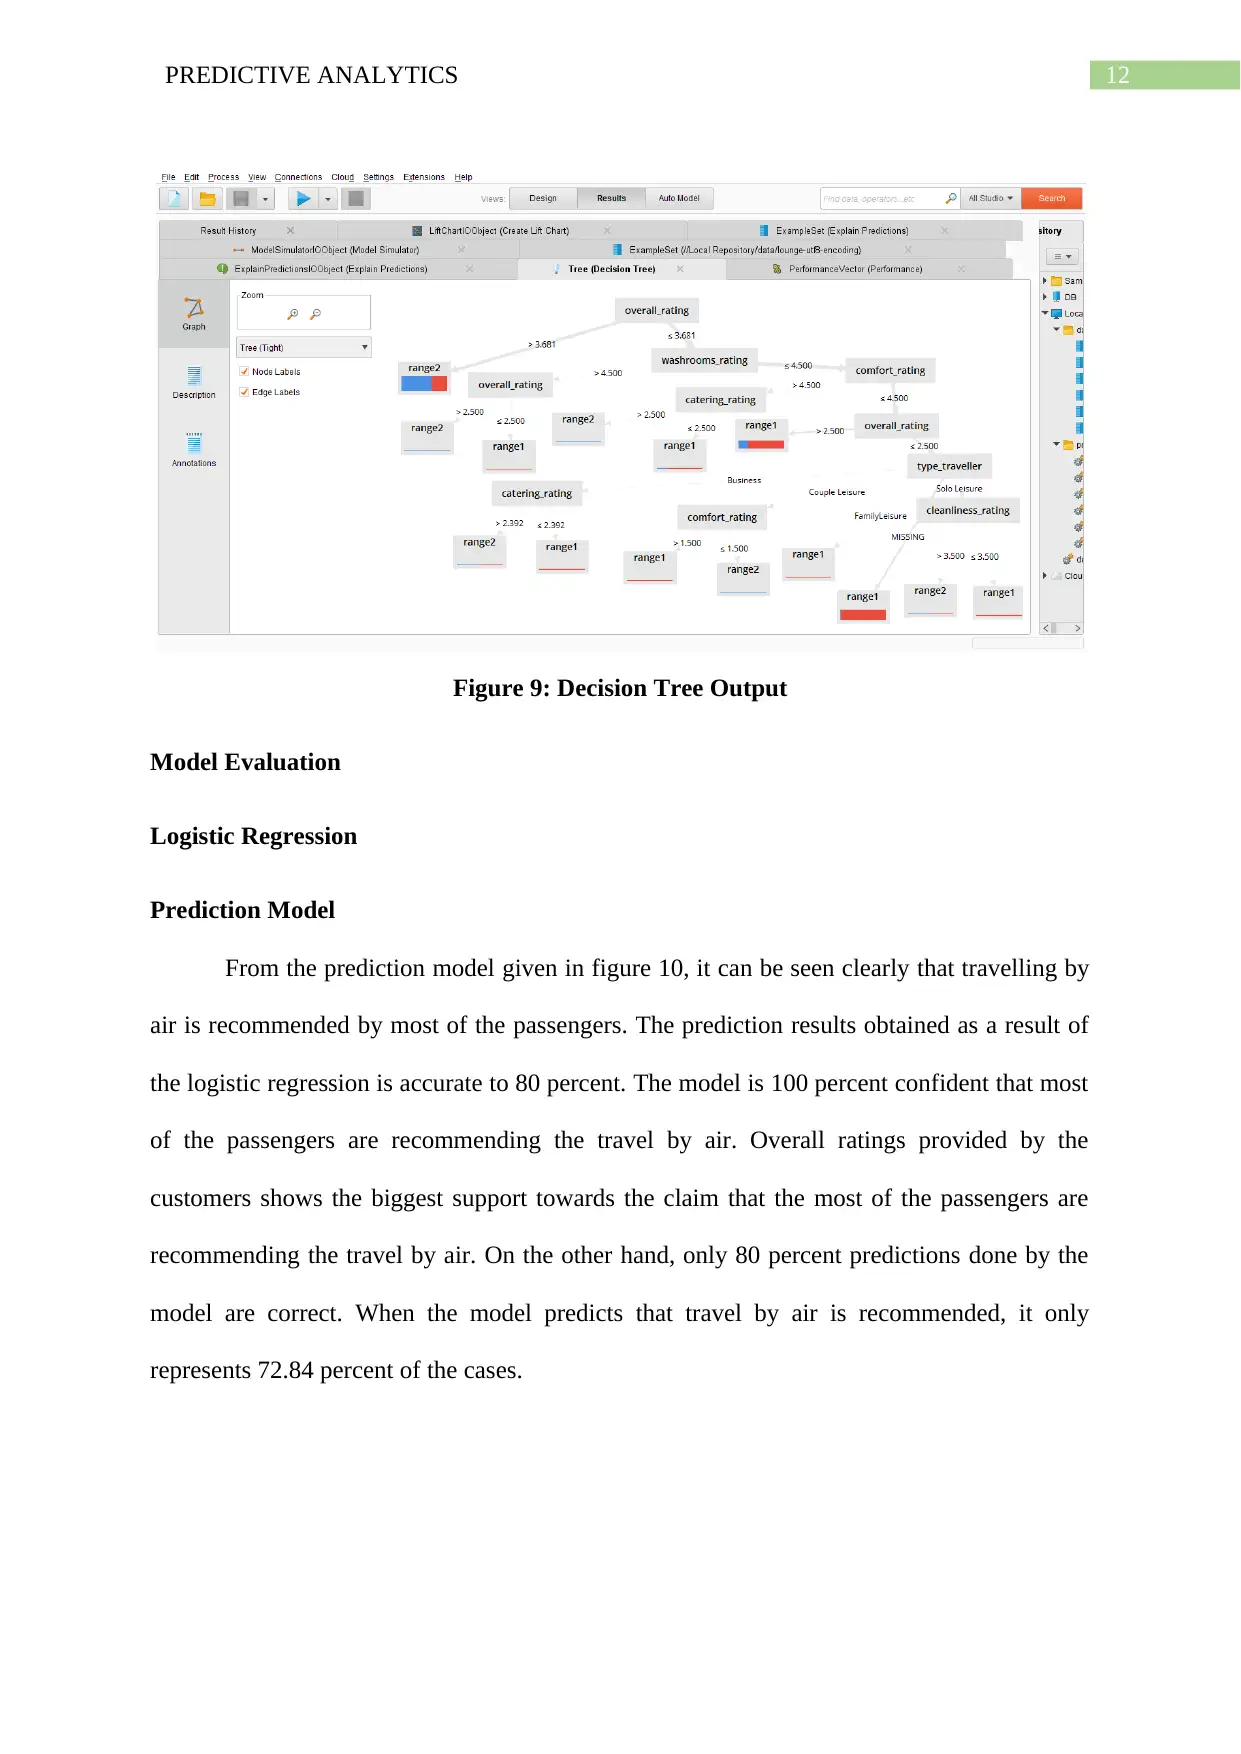
It can be seen from the decision tree model framed in figure 9 that passengers
recommended travelling by air when the overall rating is higher than 3.681. when the overall
rating is less than 3.681, other factors are considered for recommendation such as the quality
of the washrooms, comfortability in the lounges, catering service provided to the passengers
waiting in the lounges, cleanliness of the lounges as well as what type of travellers are
travelling. Based on all these factors, the predictions will be made when the satisfaction
rating overall is less than 3.681.
binary. It has two outcomes, recommended (denoted by 1) and not recommended (denoted by
1).
The decision tree model is one of the most important prediction models as this model
is a model simulator. Before the modelling is started, the process splits the original data and
checks for the validity of the model. This model can also predict the outcomes even if there
are presence of missing values in the dataset. The model is also developed with tables and
graphs which will help in the clear understanding of the model.
Figure 8: Model development of Decision Tree
Output
It can be seen from the decision tree model framed in figure 9 that passengers
recommended travelling by air when the overall rating is higher than 3.681. when the overall
rating is less than 3.681, other factors are considered for recommendation such as the quality
of the washrooms, comfortability in the lounges, catering service provided to the passengers
waiting in the lounges, cleanliness of the lounges as well as what type of travellers are
travelling. Based on all these factors, the predictions will be made when the satisfaction
rating overall is less than 3.681.
12PREDICTIVE ANALYTICS
Figure 9: Decision Tree Output
Model Evaluation
Logistic Regression
Prediction Model
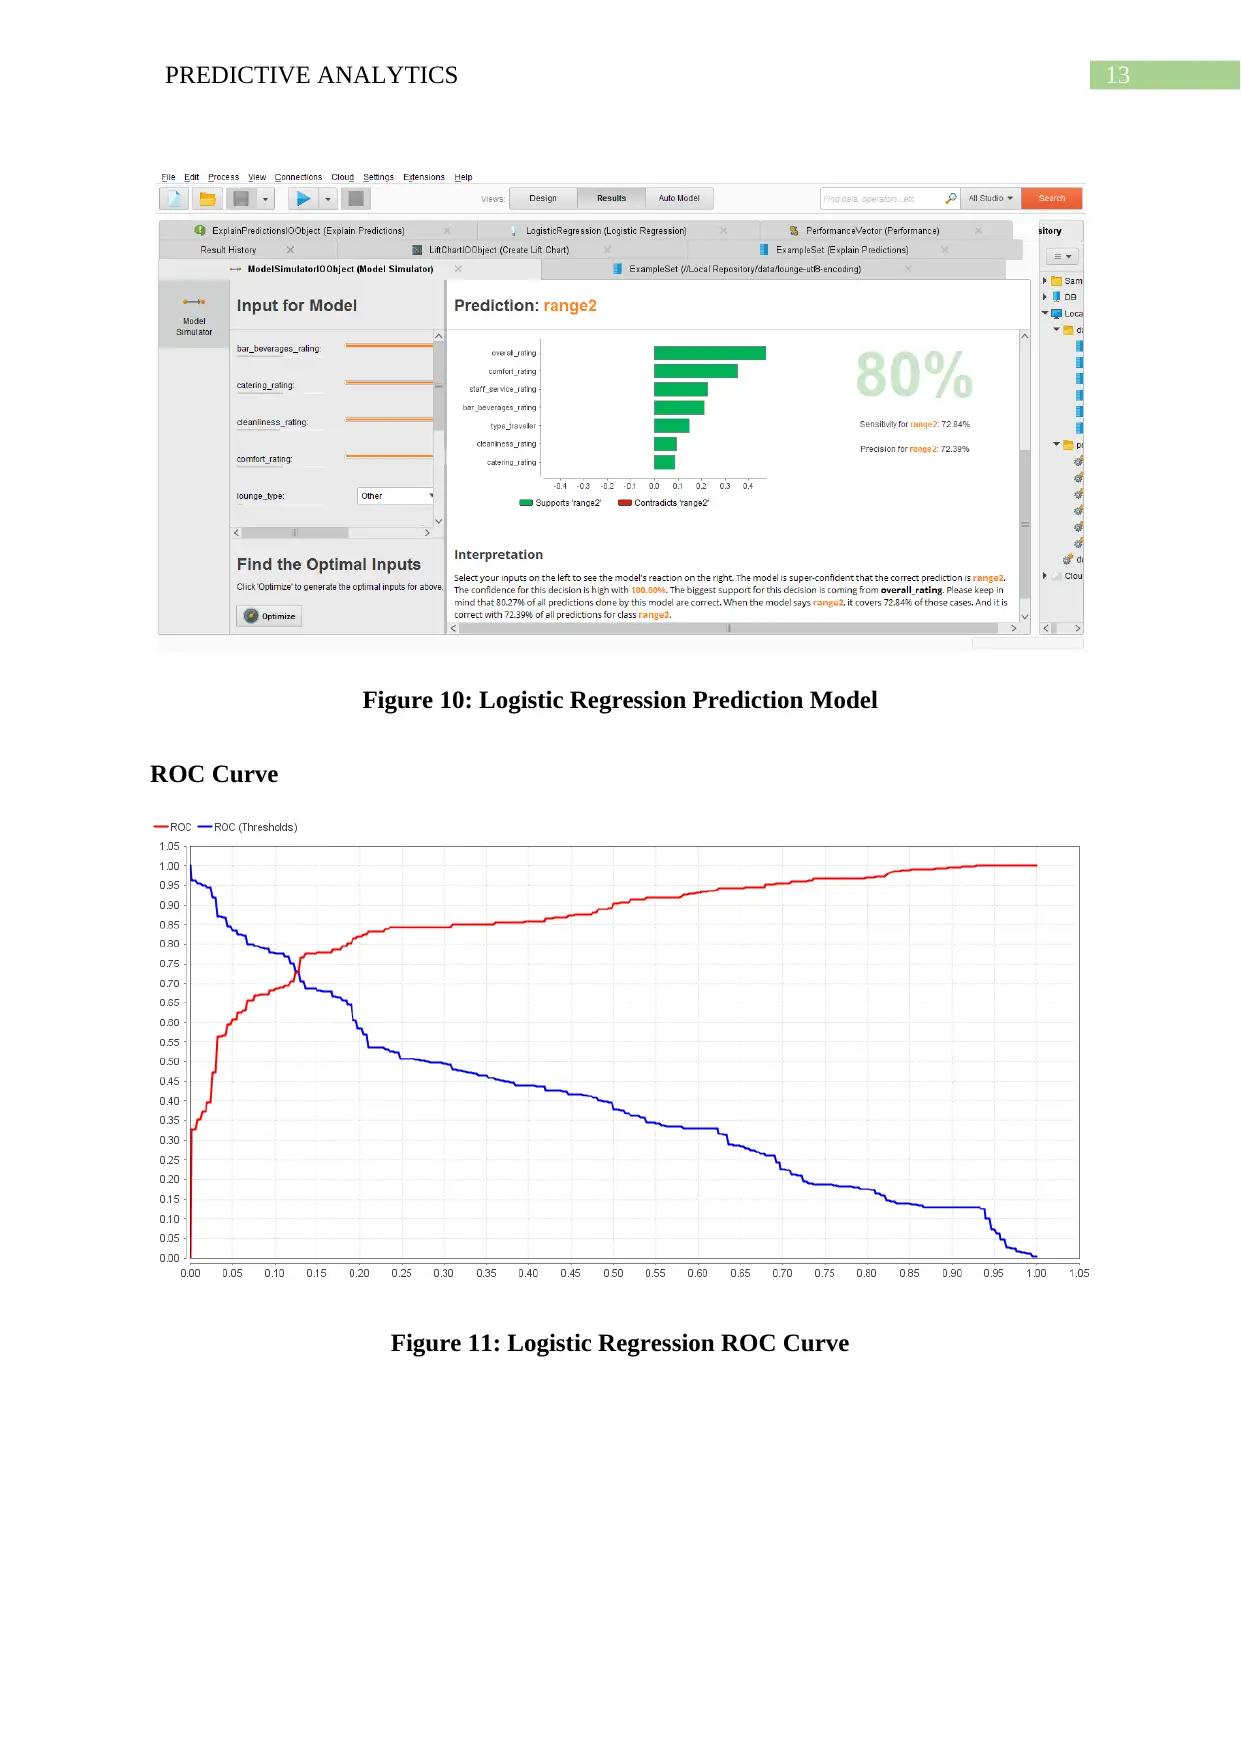
From the prediction model given in figure 10, it can be seen clearly that travelling by
air is recommended by most of the passengers. The prediction results obtained as a result of
the logistic regression is accurate to 80 percent. The model is 100 percent confident that most
of the passengers are recommending the travel by air. Overall ratings provided by the
customers shows the biggest support towards the claim that the most of the passengers are
recommending the travel by air. On the other hand, only 80 percent predictions done by the
model are correct. When the model predicts that travel by air is recommended, it only
represents 72.84 percent of the cases.
Figure 9: Decision Tree Output
Model Evaluation
Logistic Regression
Prediction Model
From the prediction model given in figure 10, it can be seen clearly that travelling by
air is recommended by most of the passengers. The prediction results obtained as a result of
the logistic regression is accurate to 80 percent. The model is 100 percent confident that most
of the passengers are recommending the travel by air. Overall ratings provided by the
customers shows the biggest support towards the claim that the most of the passengers are
recommending the travel by air. On the other hand, only 80 percent predictions done by the
model are correct. When the model predicts that travel by air is recommended, it only
represents 72.84 percent of the cases.
Paraphrase This Document
Need a fresh take? Get an instant paraphrase of this document with our AI Paraphraser
13PREDICTIVE ANALYTICS
Figure 10: Logistic Regression Prediction Model
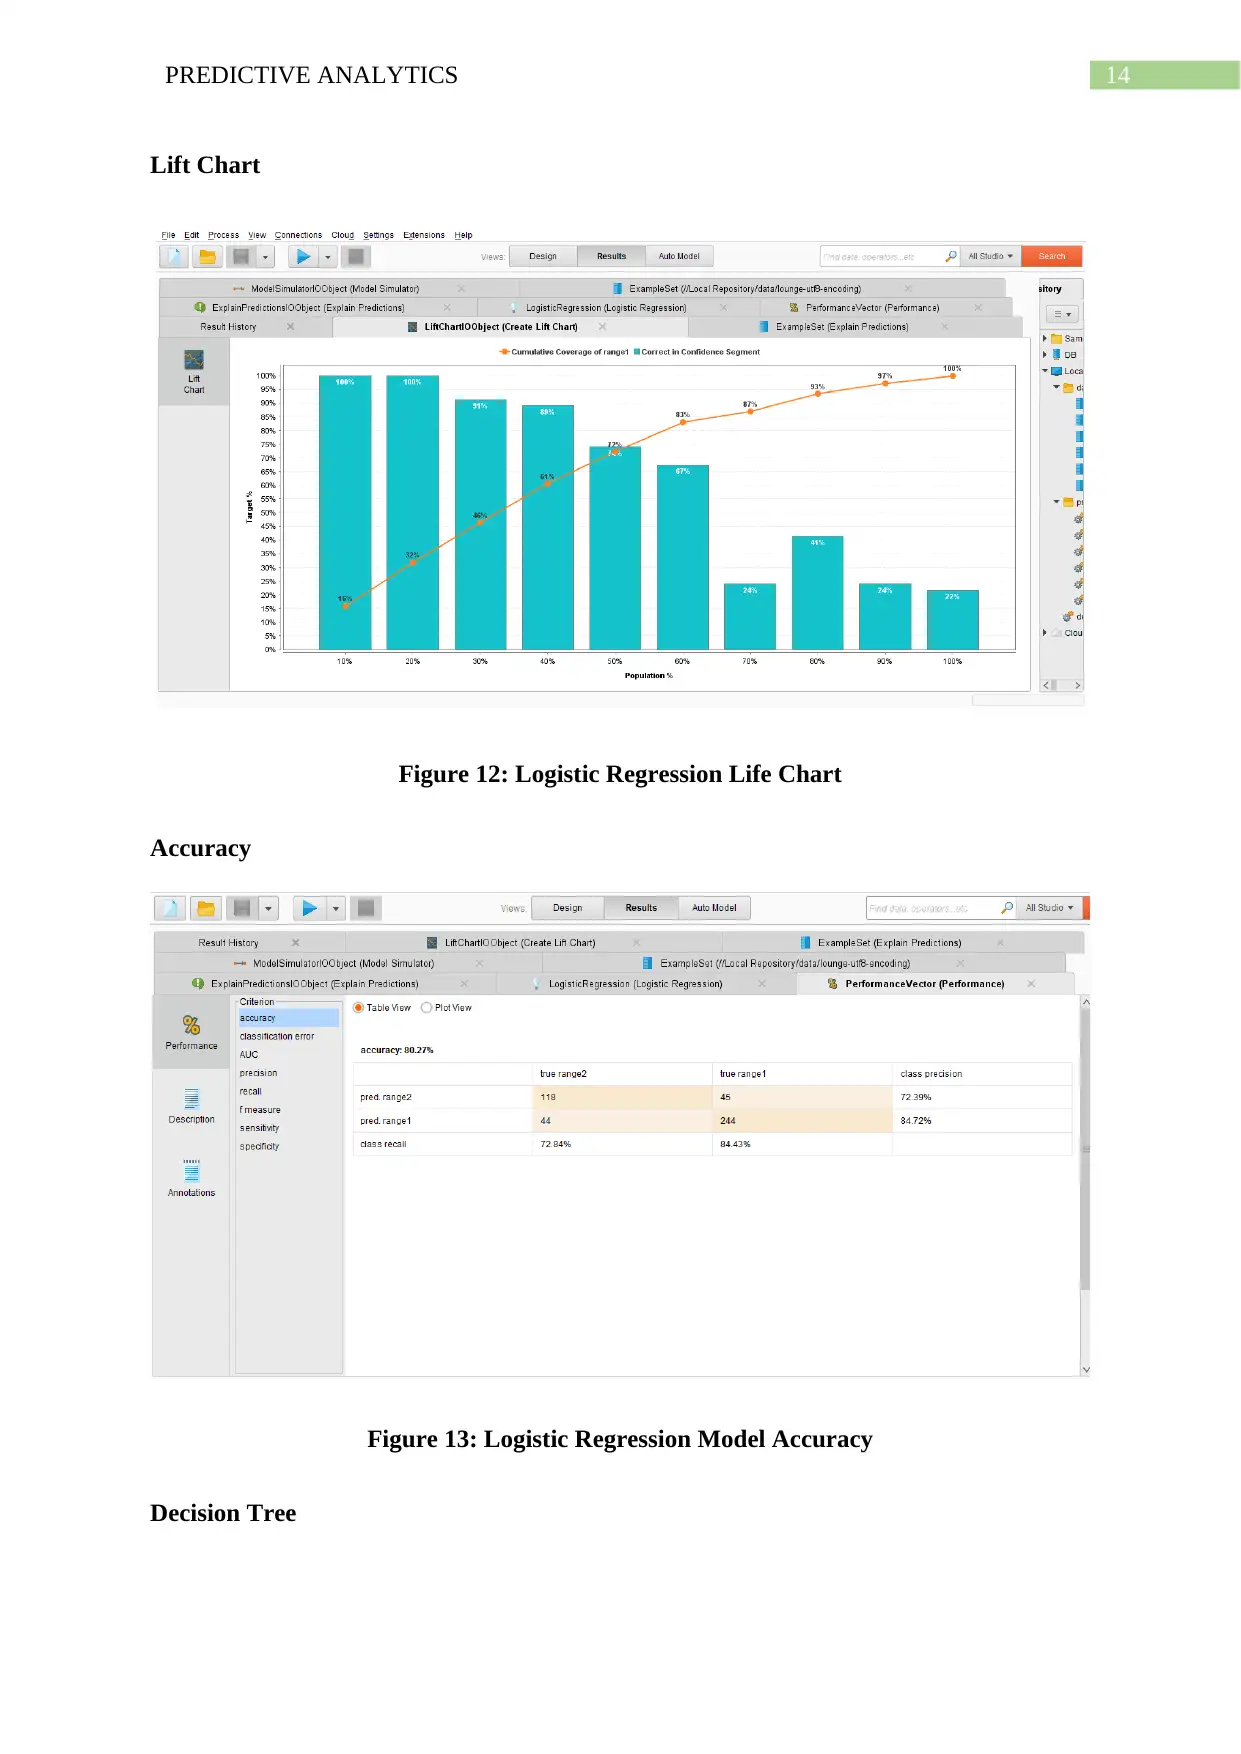
ROC Curve
Figure 11: Logistic Regression ROC Curve
Figure 10: Logistic Regression Prediction Model
ROC Curve
Figure 11: Logistic Regression ROC Curve
14PREDICTIVE ANALYTICS
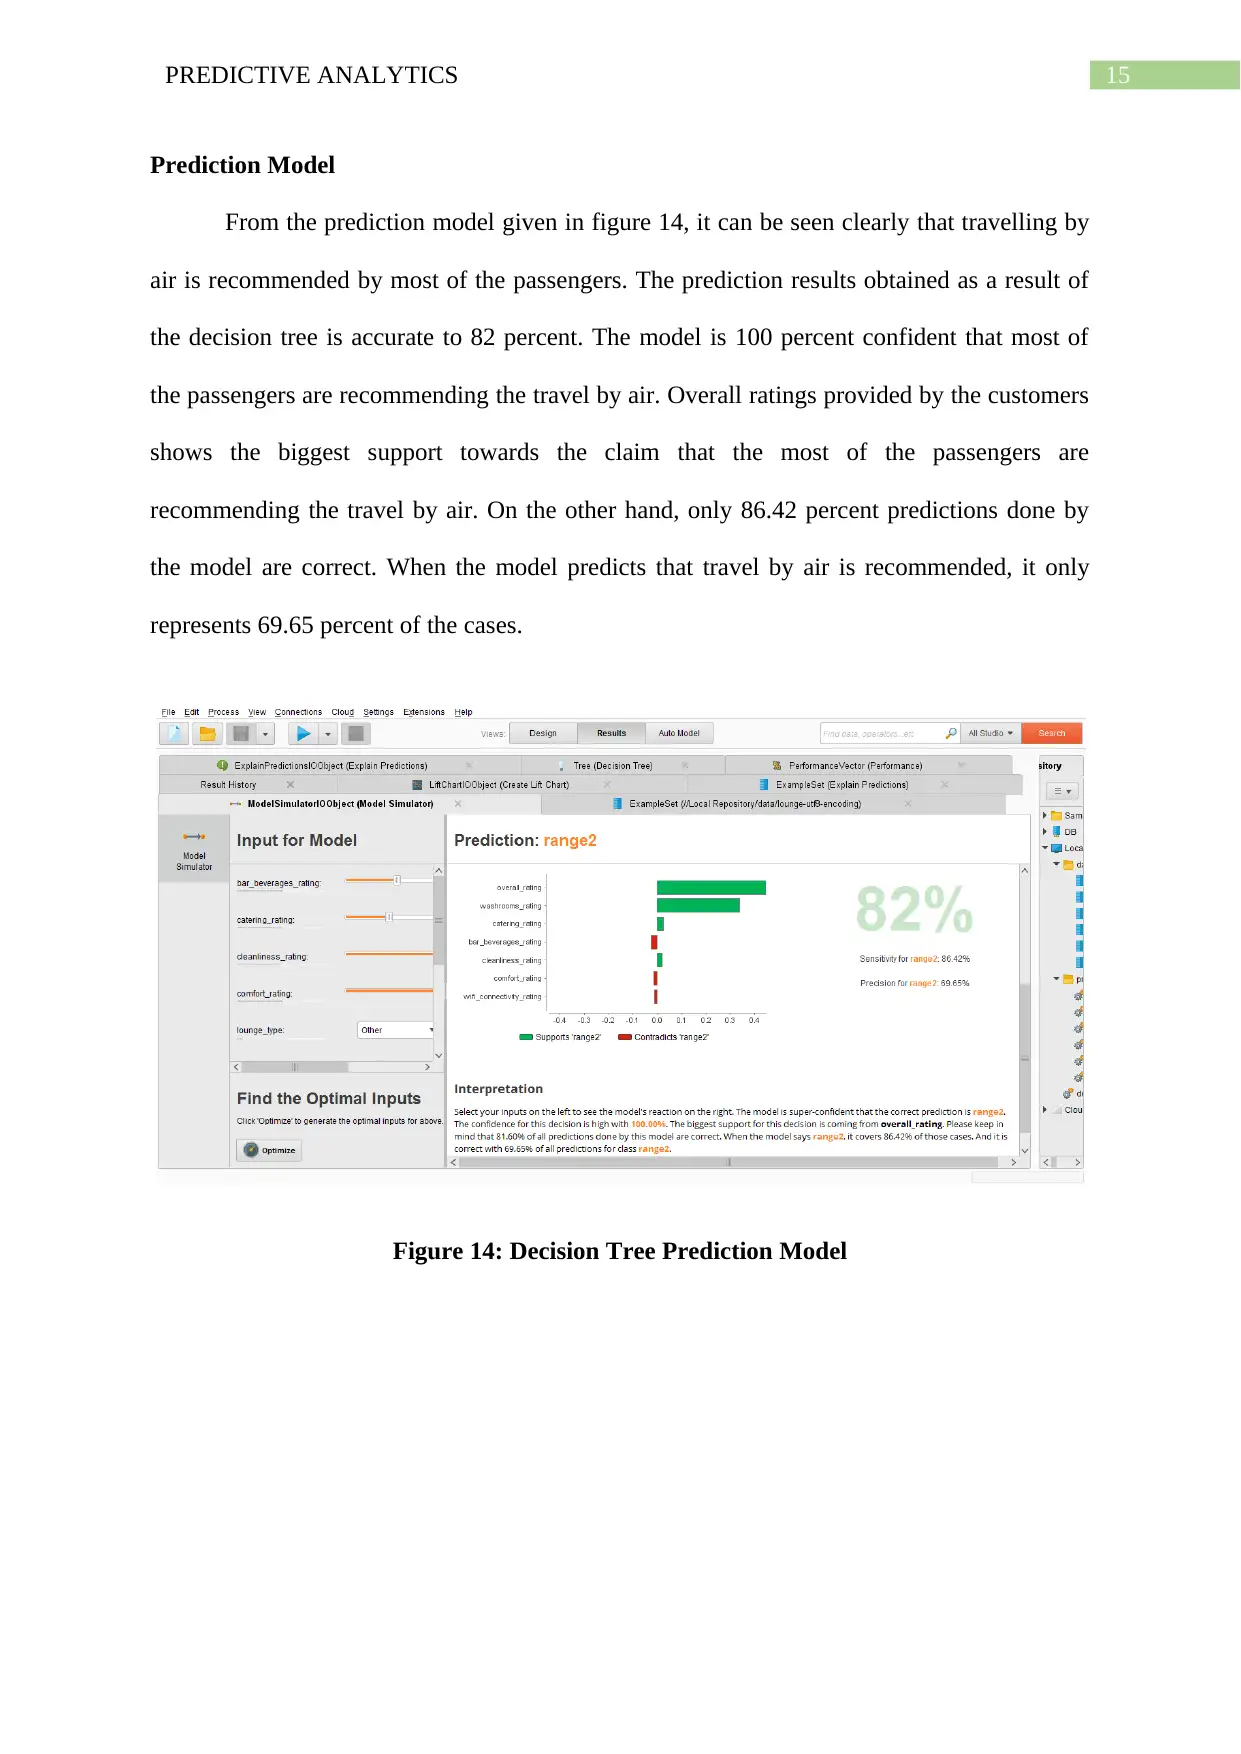
Lift Chart
Figure 12: Logistic Regression Life Chart
Accuracy
Figure 13: Logistic Regression Model Accuracy
Decision Tree
Lift Chart
Figure 12: Logistic Regression Life Chart
Accuracy
Figure 13: Logistic Regression Model Accuracy
Decision Tree
15PREDICTIVE ANALYTICS
Prediction Model
From the prediction model given in figure 14, it can be seen clearly that travelling by
air is recommended by most of the passengers. The prediction results obtained as a result of
the decision tree is accurate to 82 percent. The model is 100 percent confident that most of
the passengers are recommending the travel by air. Overall ratings provided by the customers
shows the biggest support towards the claim that the most of the passengers are
recommending the travel by air. On the other hand, only 86.42 percent predictions done by
the model are correct. When the model predicts that travel by air is recommended, it only
represents 69.65 percent of the cases.
Figure 14: Decision Tree Prediction Model
Secure Best Marks with AI Grader
Need help grading? Try our AI Grader for instant feedback on your assignments.
16PREDICTIVE ANALYTICS
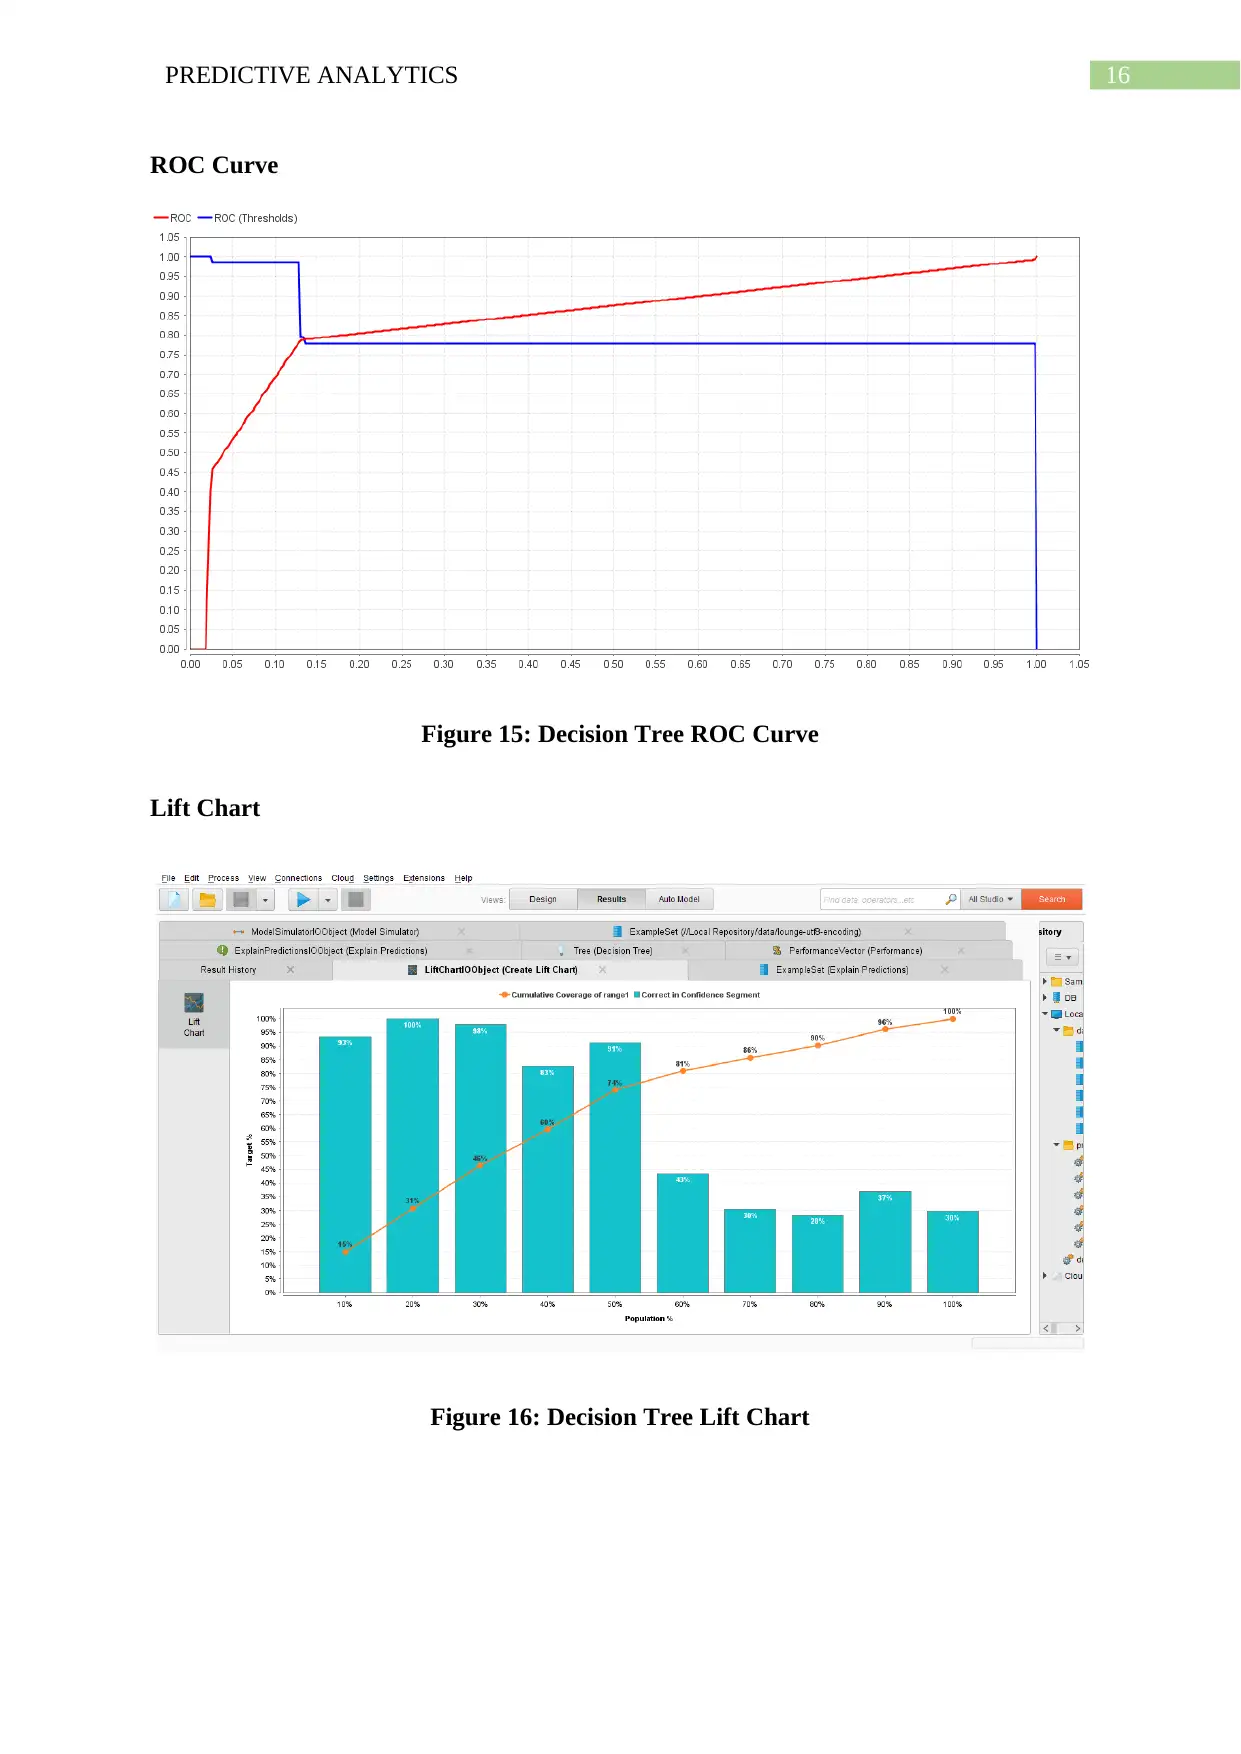
ROC Curve
Figure 15: Decision Tree ROC Curve
Lift Chart
Figure 16: Decision Tree Lift Chart
ROC Curve
Figure 15: Decision Tree ROC Curve
Lift Chart
Figure 16: Decision Tree Lift Chart
17PREDICTIVE ANALYTICS
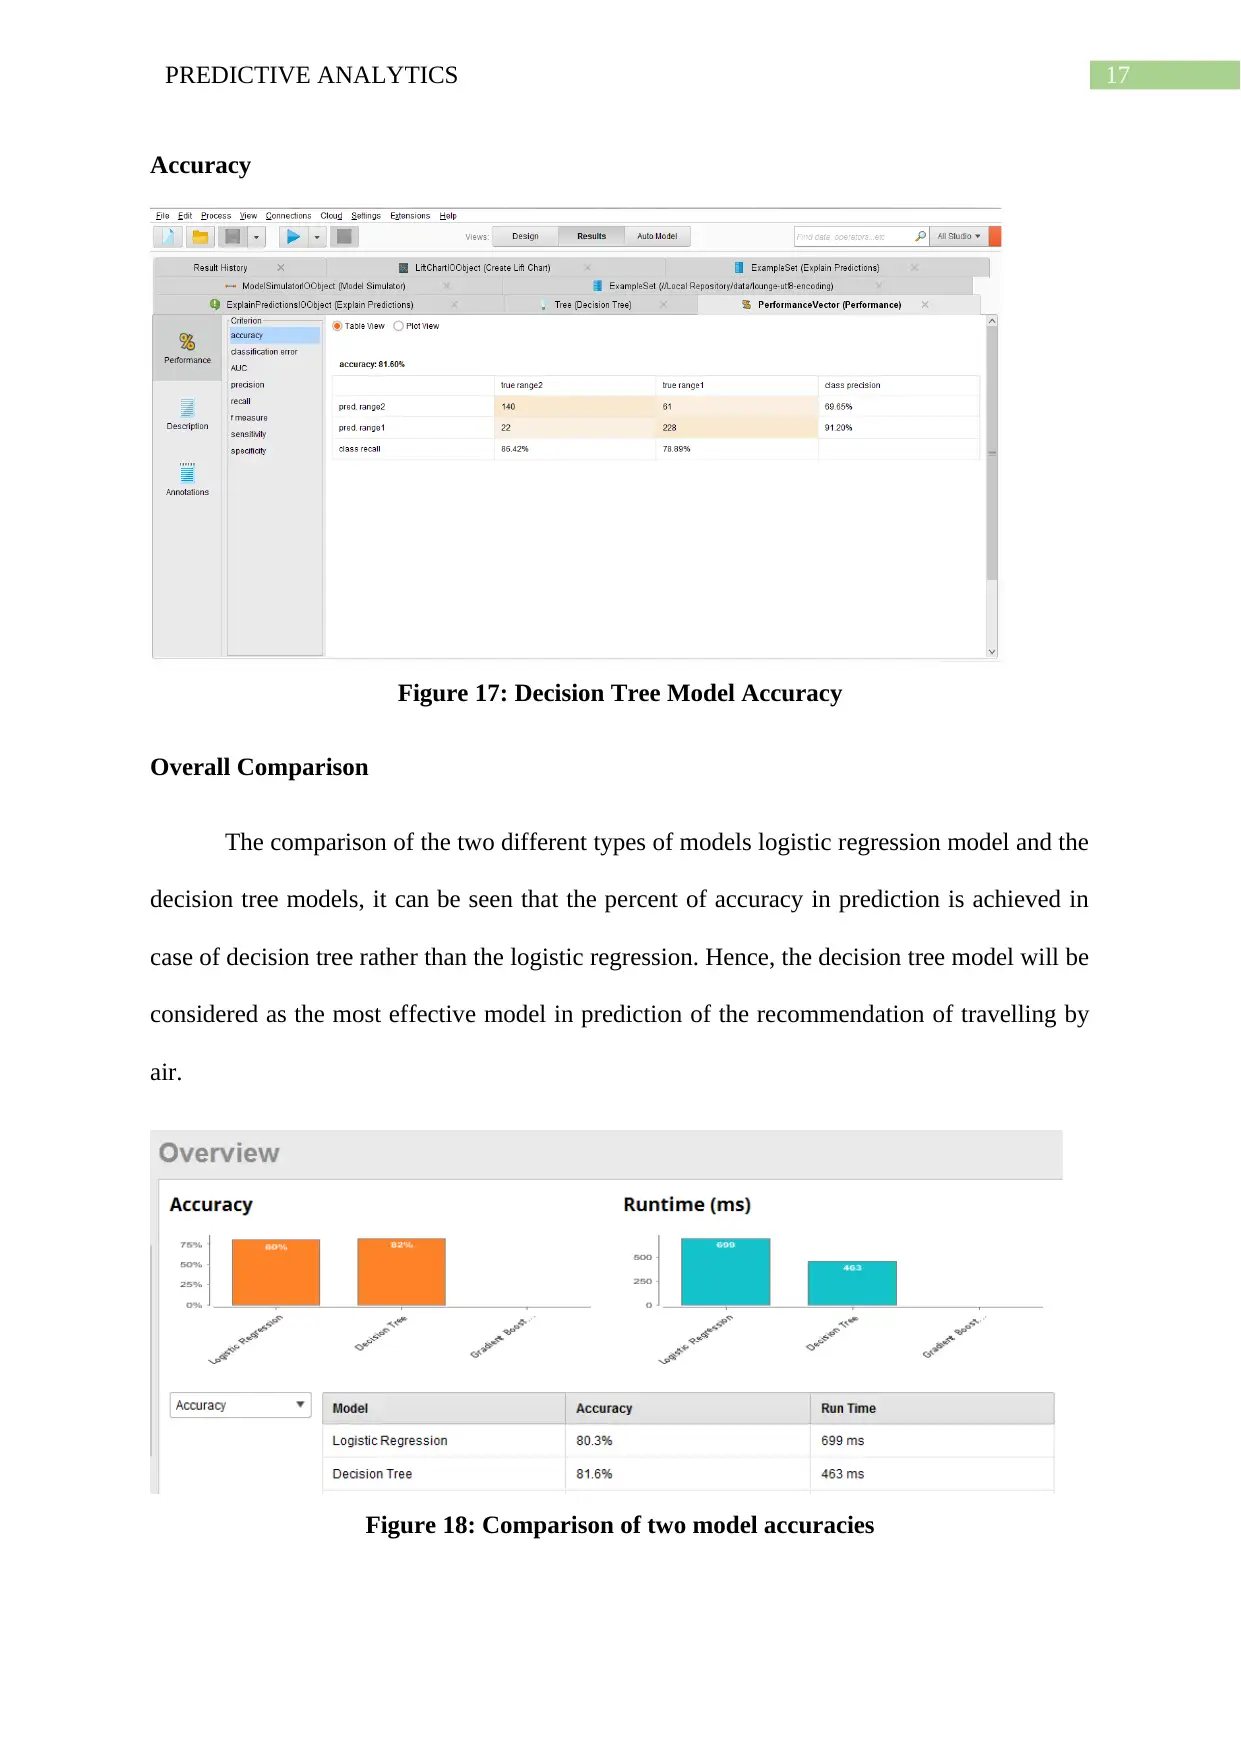
Accuracy
Figure 17: Decision Tree Model Accuracy
Overall Comparison
The comparison of the two different types of models logistic regression model and the
decision tree models, it can be seen that the percent of accuracy in prediction is achieved in
case of decision tree rather than the logistic regression. Hence, the decision tree model will be
considered as the most effective model in prediction of the recommendation of travelling by
air.
Figure 18: Comparison of two model accuracies
18PREDICTIVE ANALYTICS
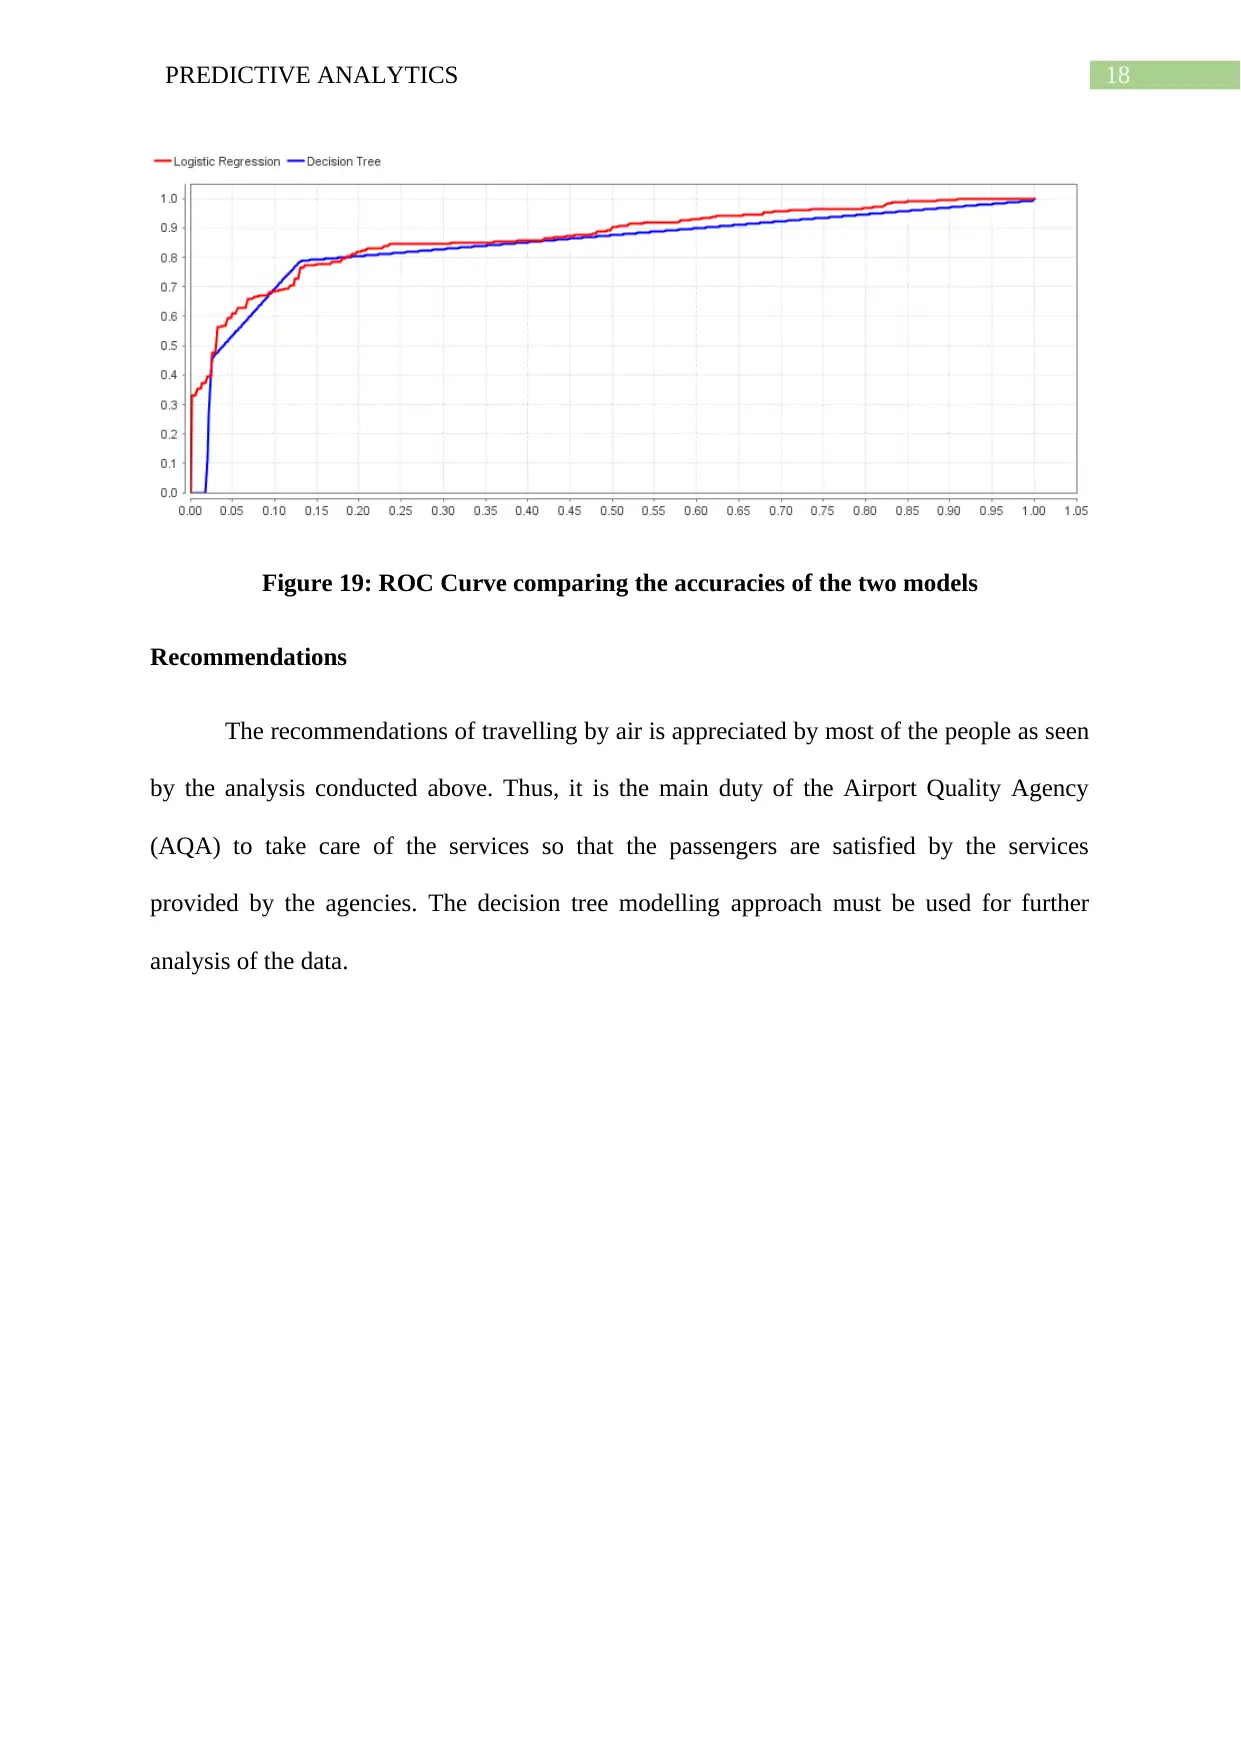
Figure 19: ROC Curve comparing the accuracies of the two models
Recommendations
The recommendations of travelling by air is appreciated by most of the people as seen
by the analysis conducted above. Thus, it is the main duty of the Airport Quality Agency
(AQA) to take care of the services so that the passengers are satisfied by the services
provided by the agencies. The decision tree modelling approach must be used for further
analysis of the data.
1 out of 19
Related Documents


Your All-in-One AI-Powered Toolkit for Academic Success.
+13062052269
info@desklib.com
Available 24*7 on WhatsApp / Email
![[object Object]](/_next/static/media/star-bottom.7253800d.svg)
Unlock your academic potential
© 2024 | Zucol Services PVT LTD | All rights reserved.