Building & Evaluating Predictive Models: Data Analysis Report
VerifiedAdded on 2023/06/08
|17
|3111
|68
Report
AI Summary
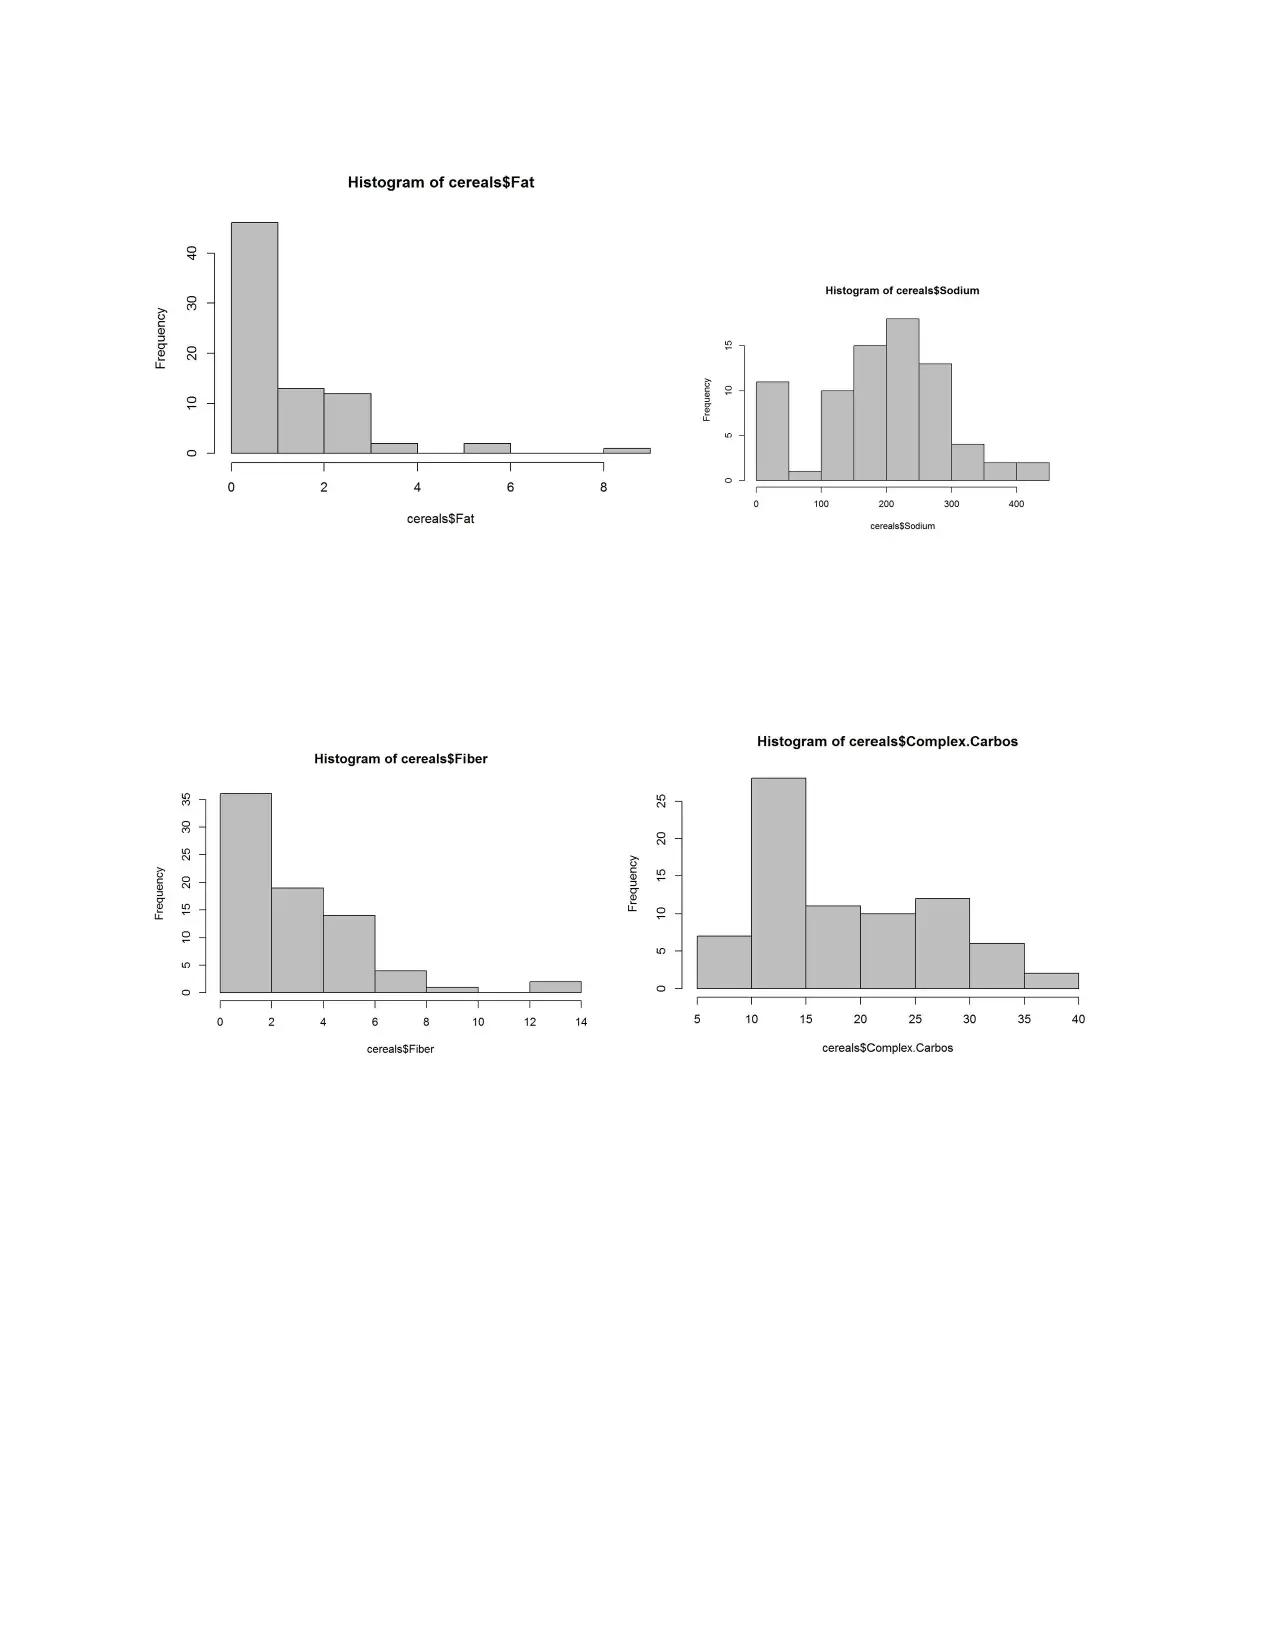
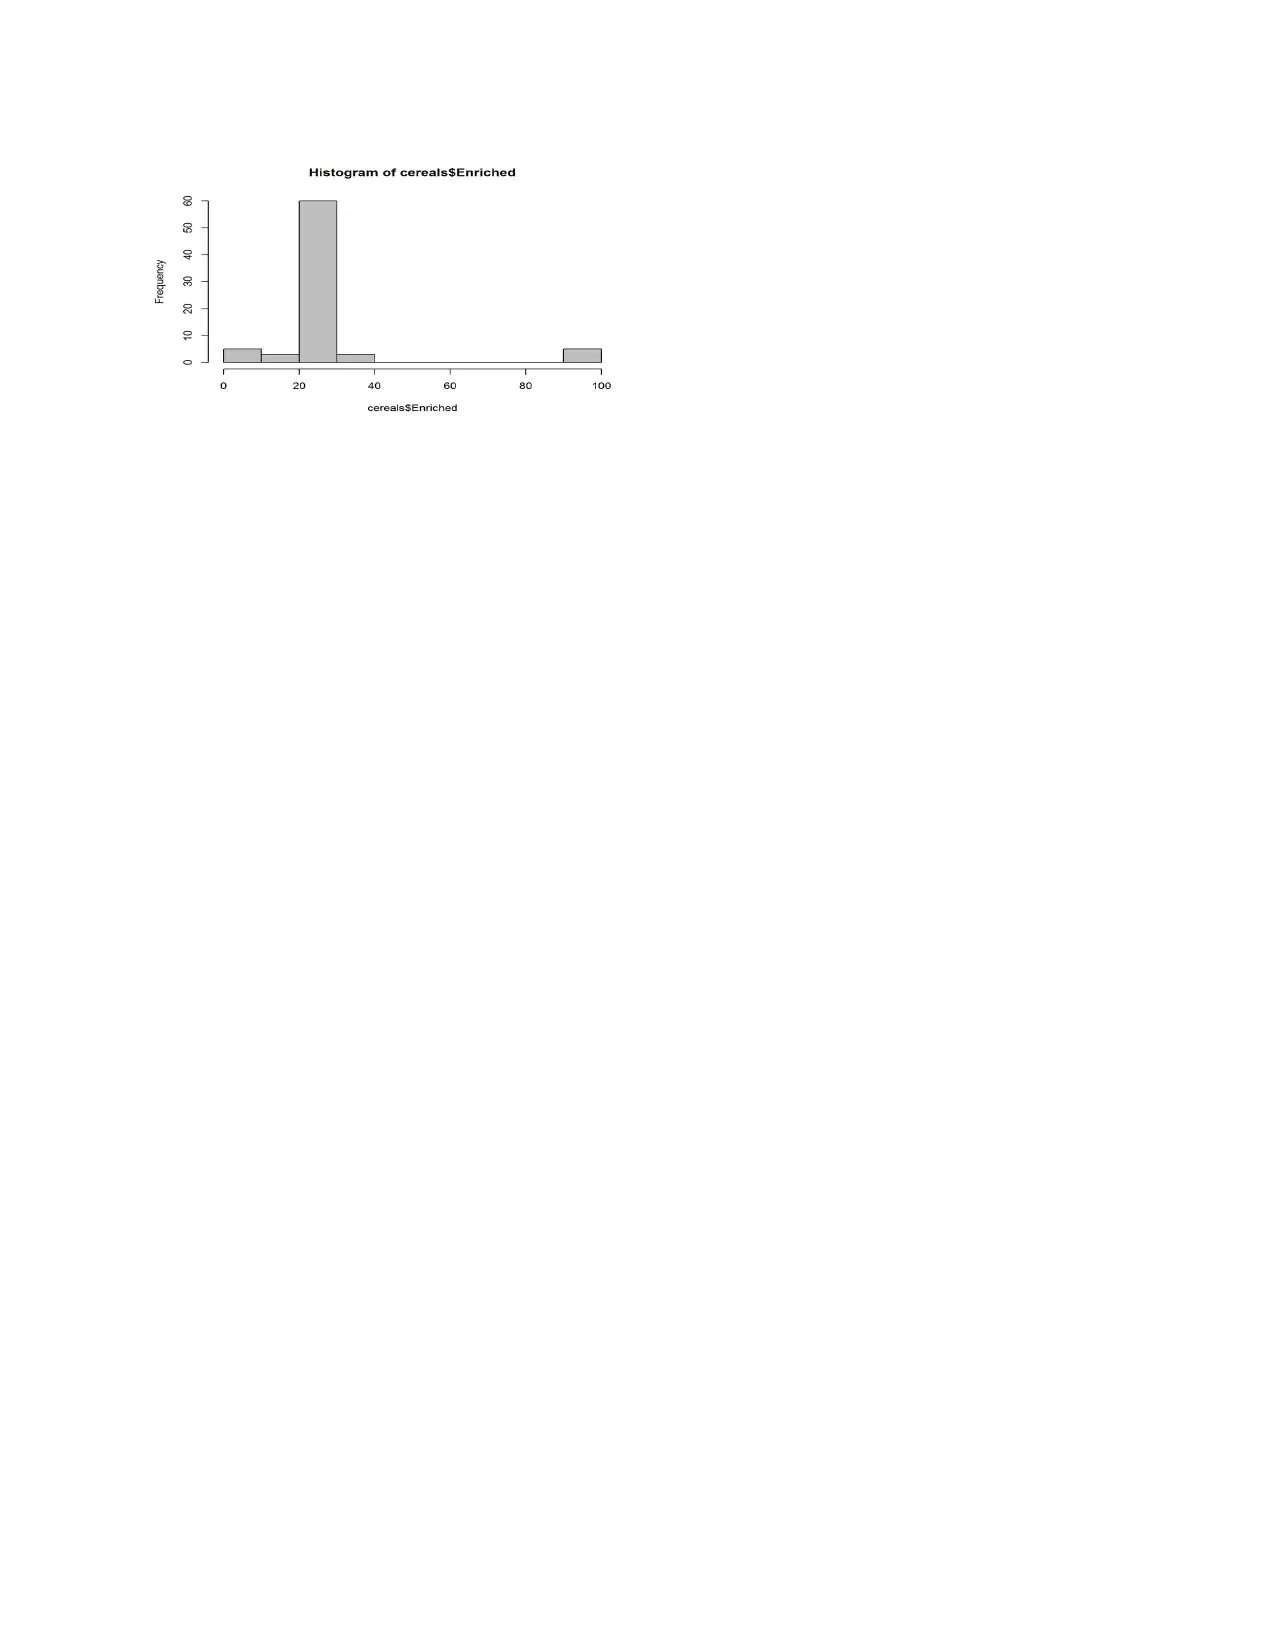
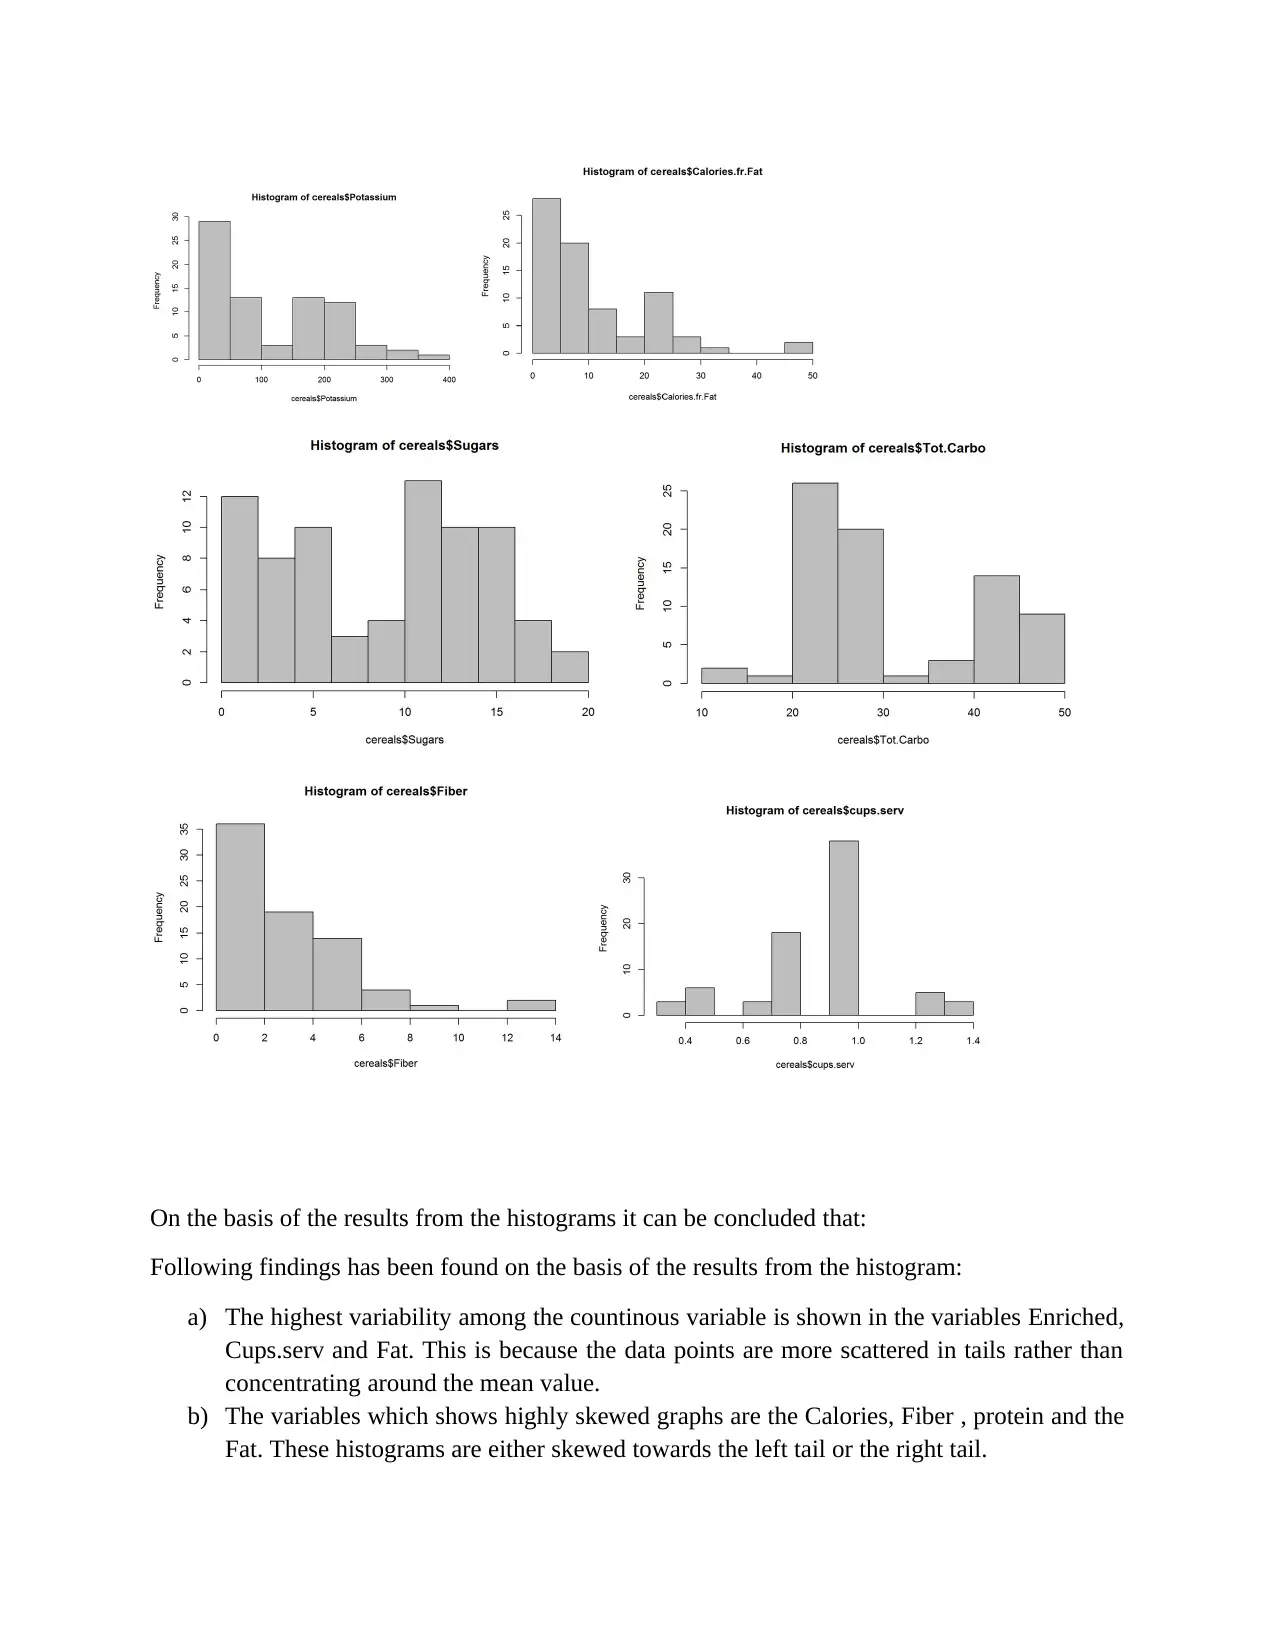
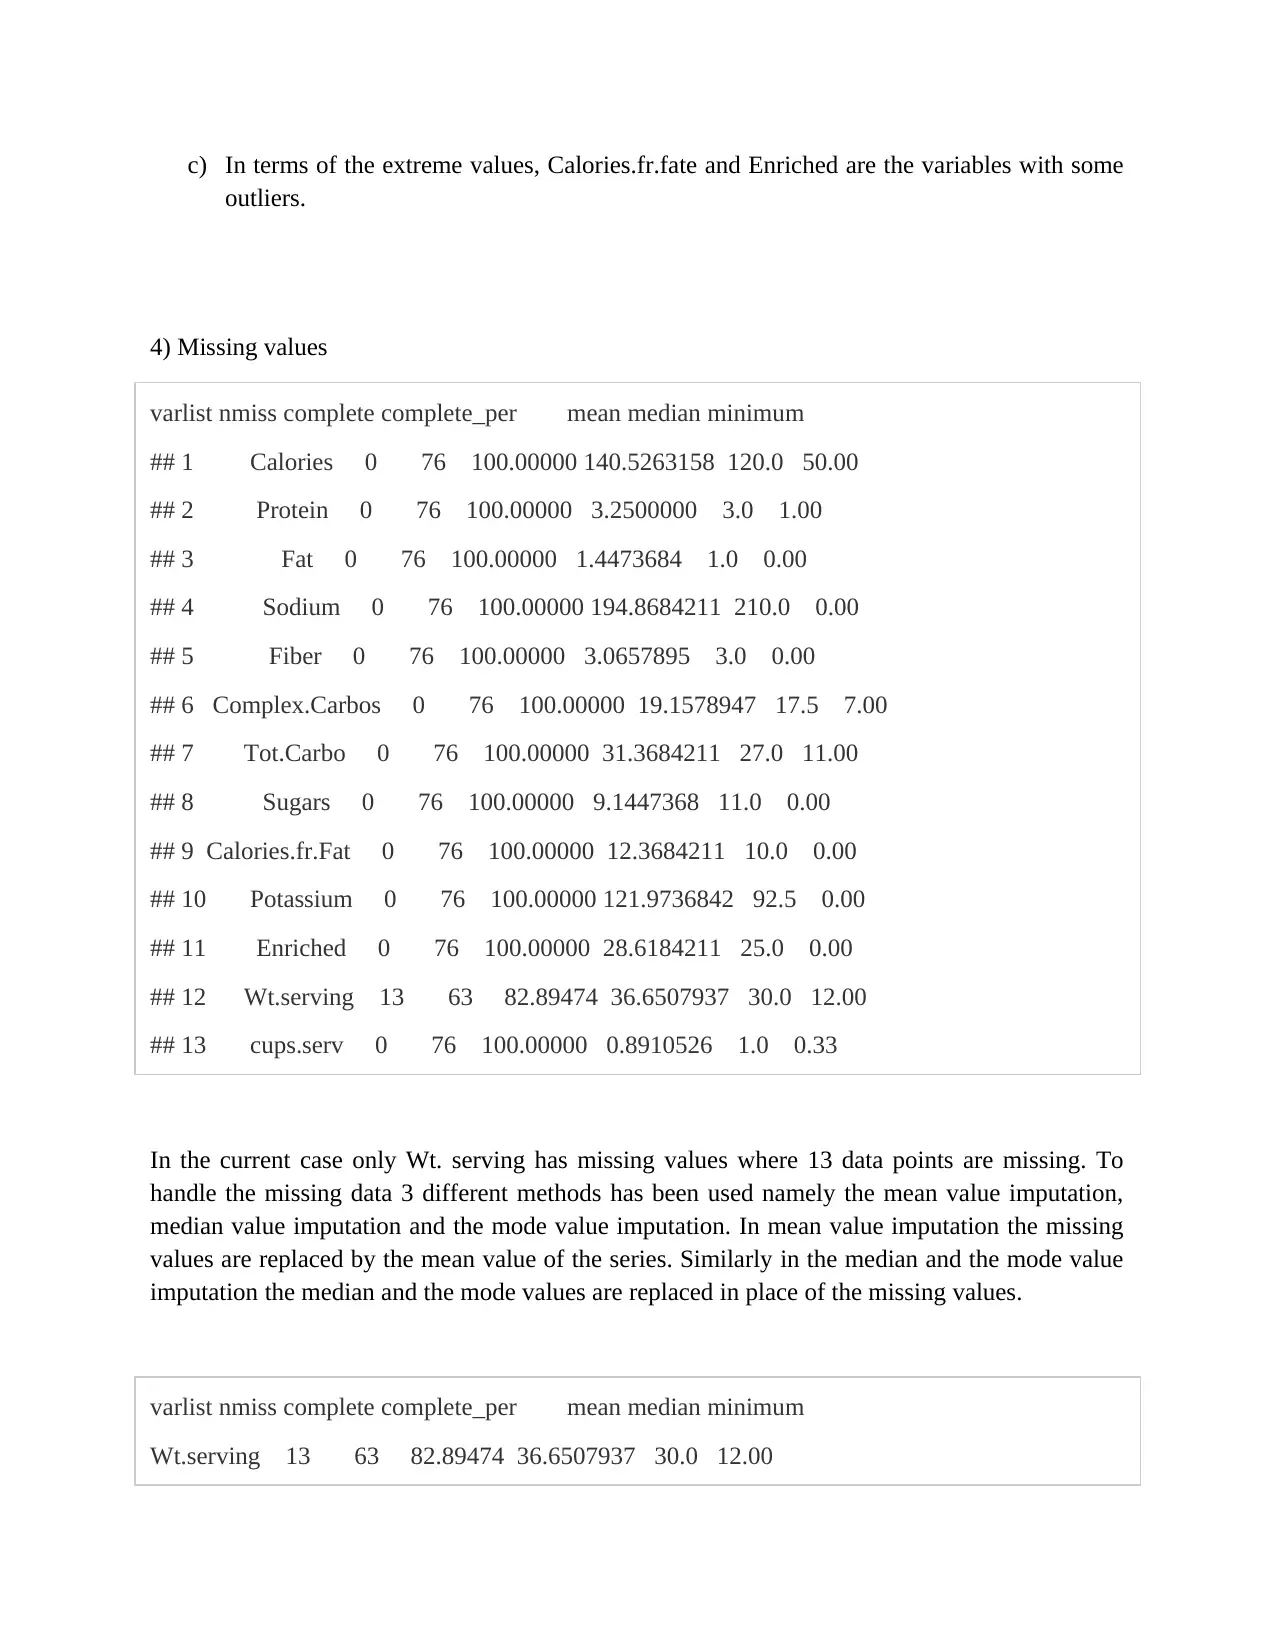
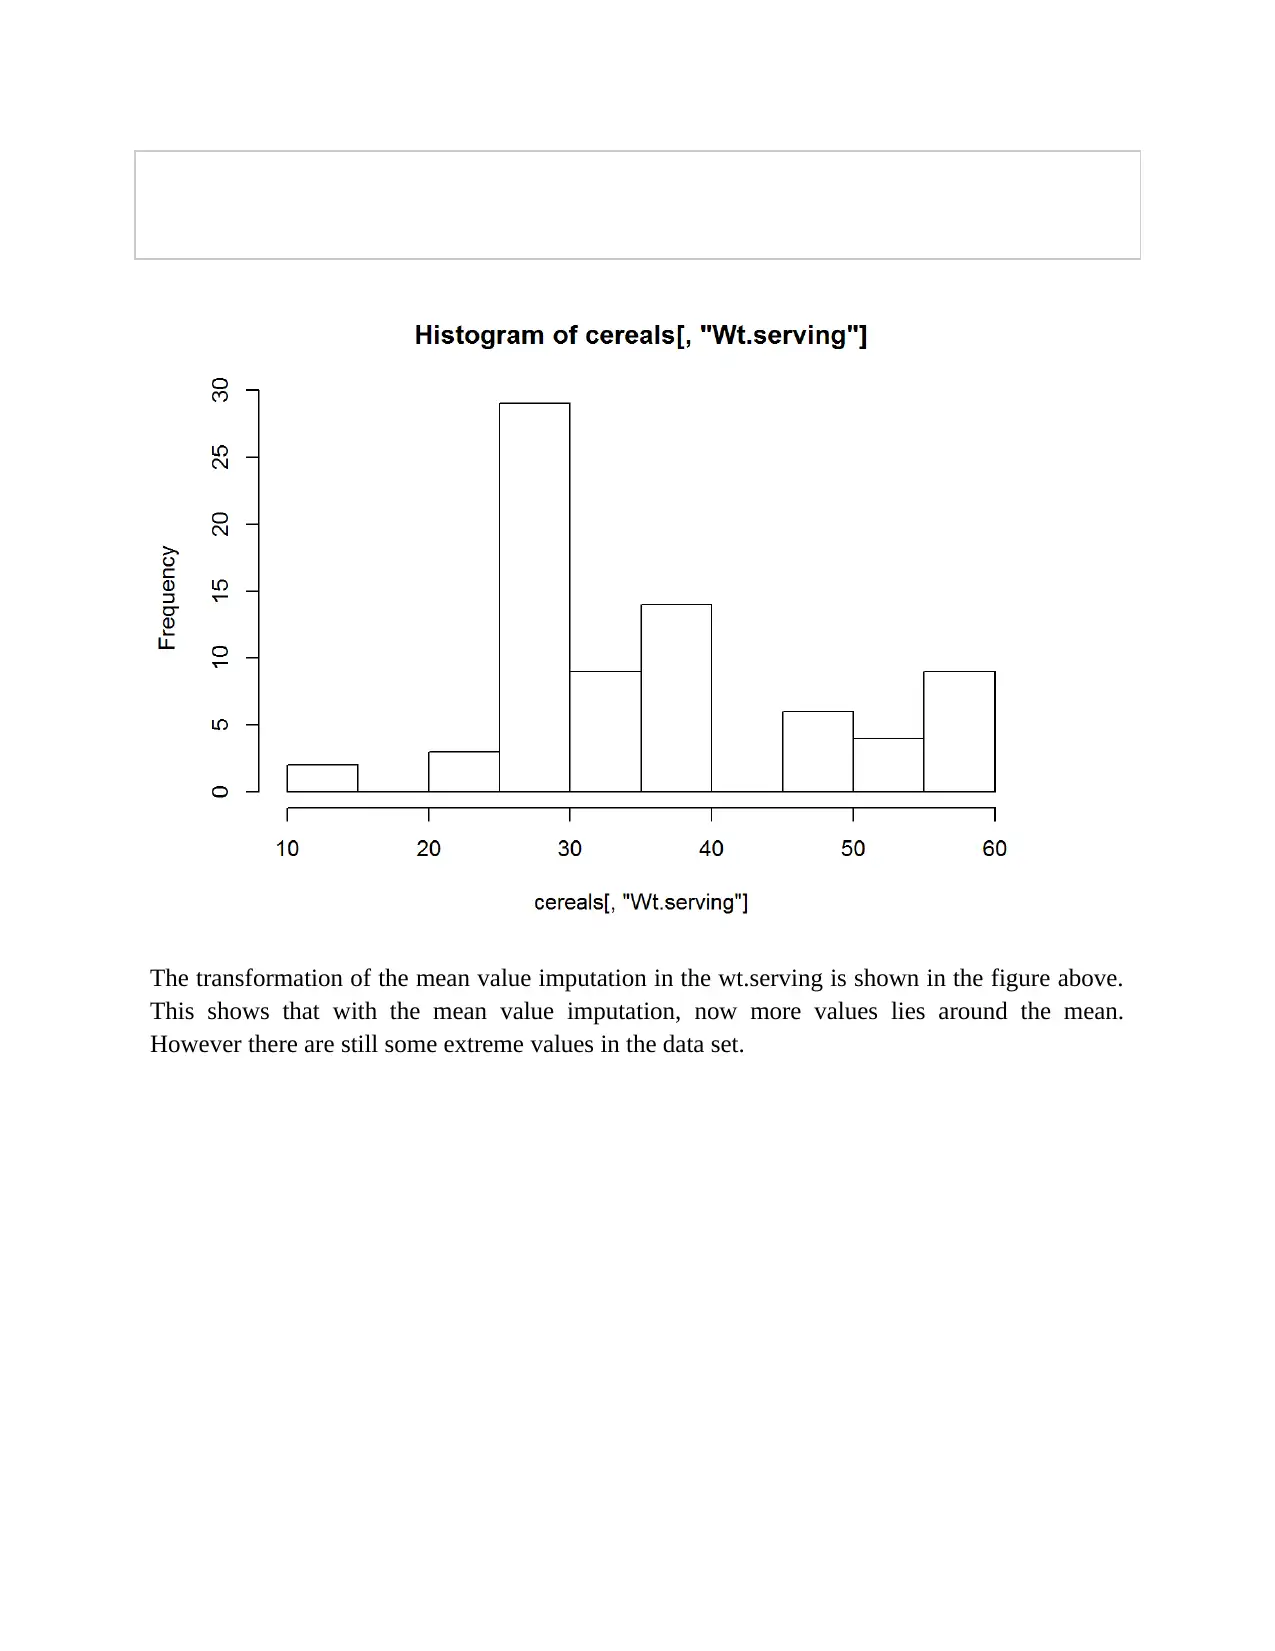
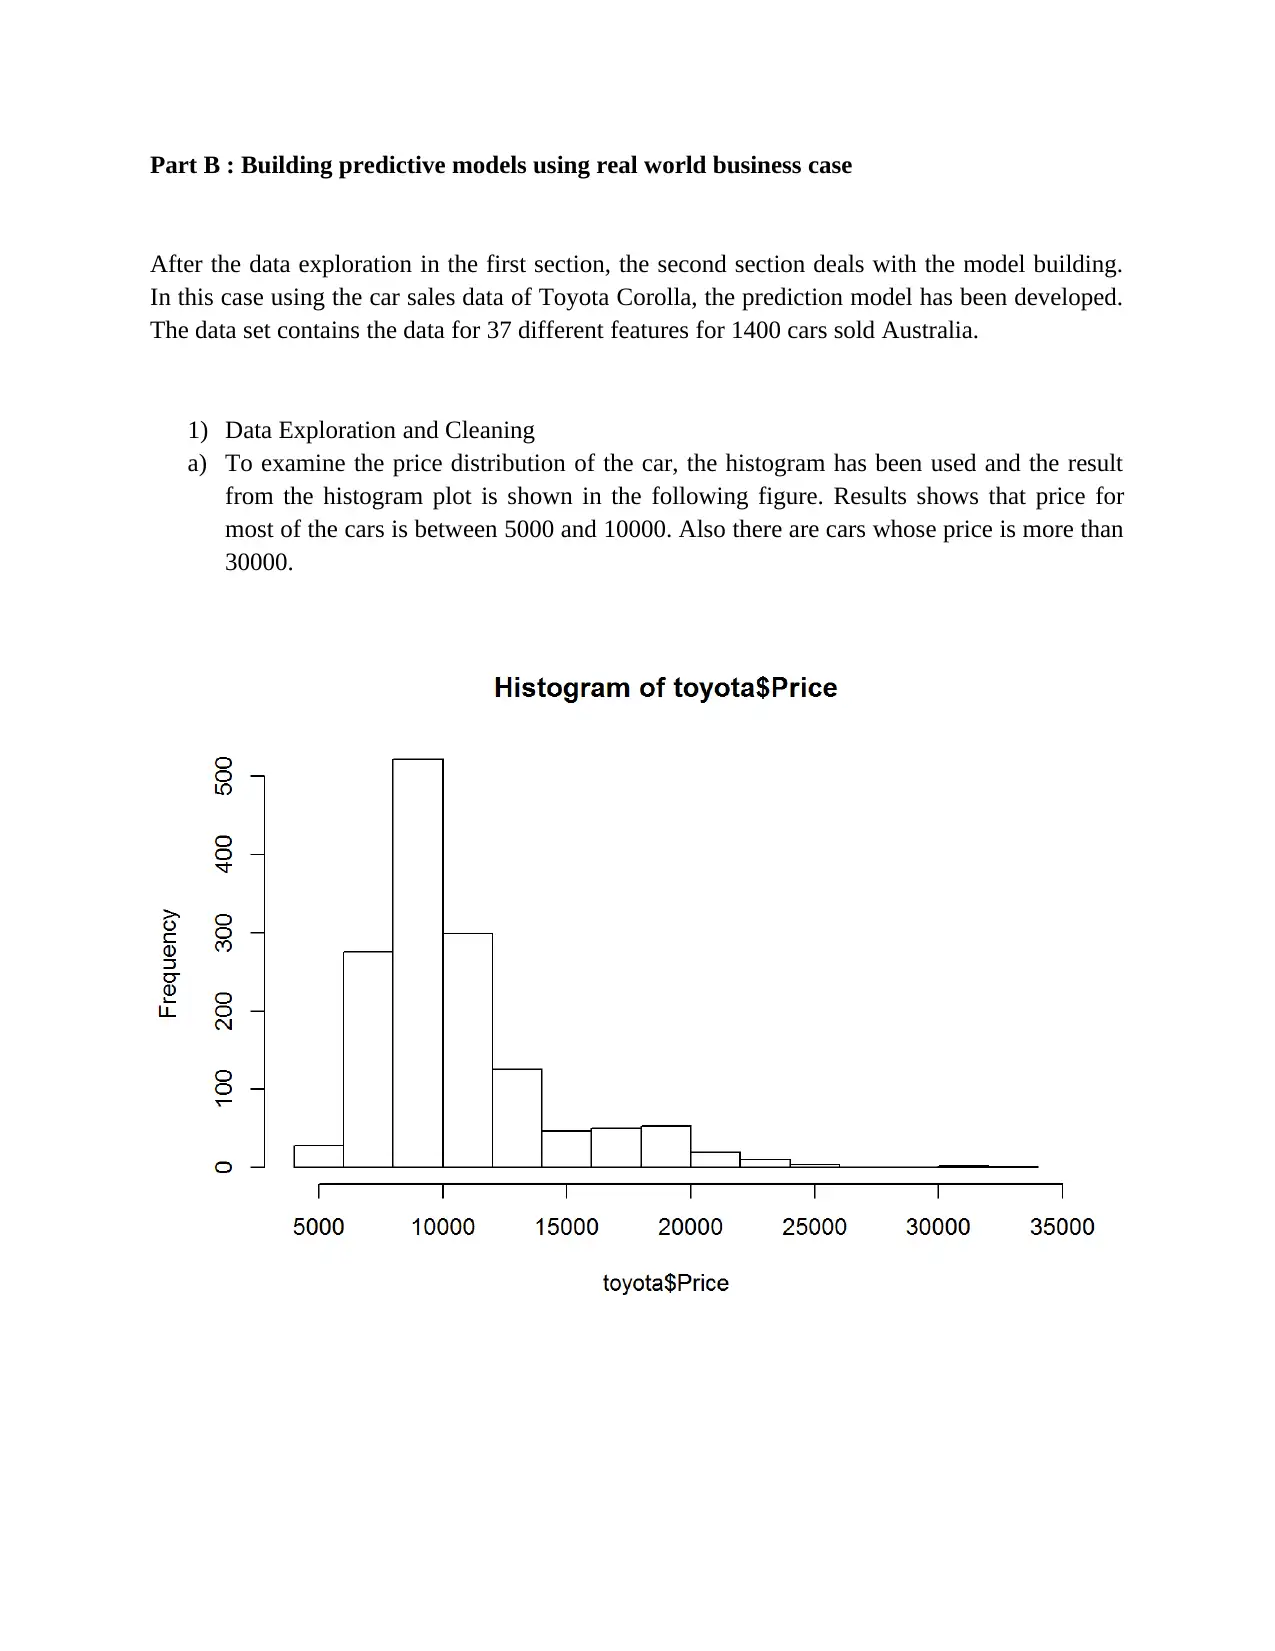
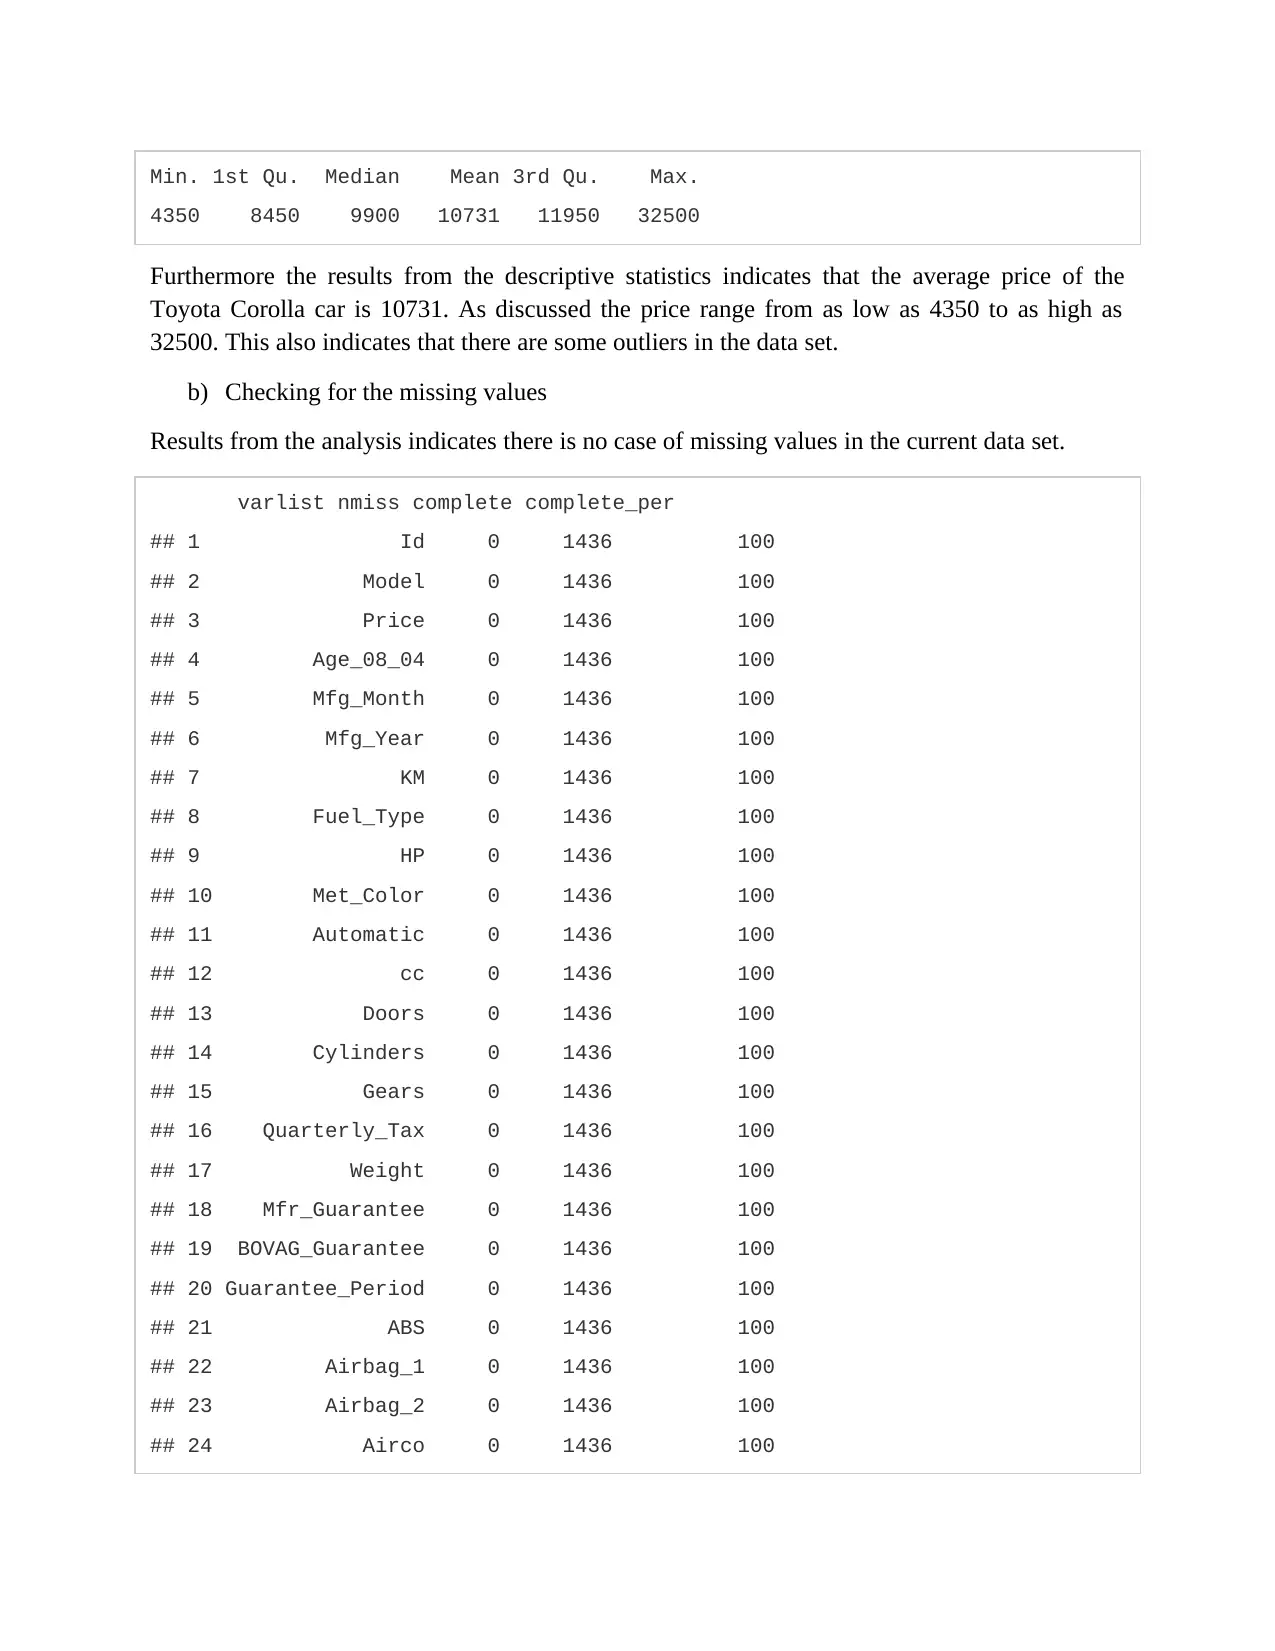
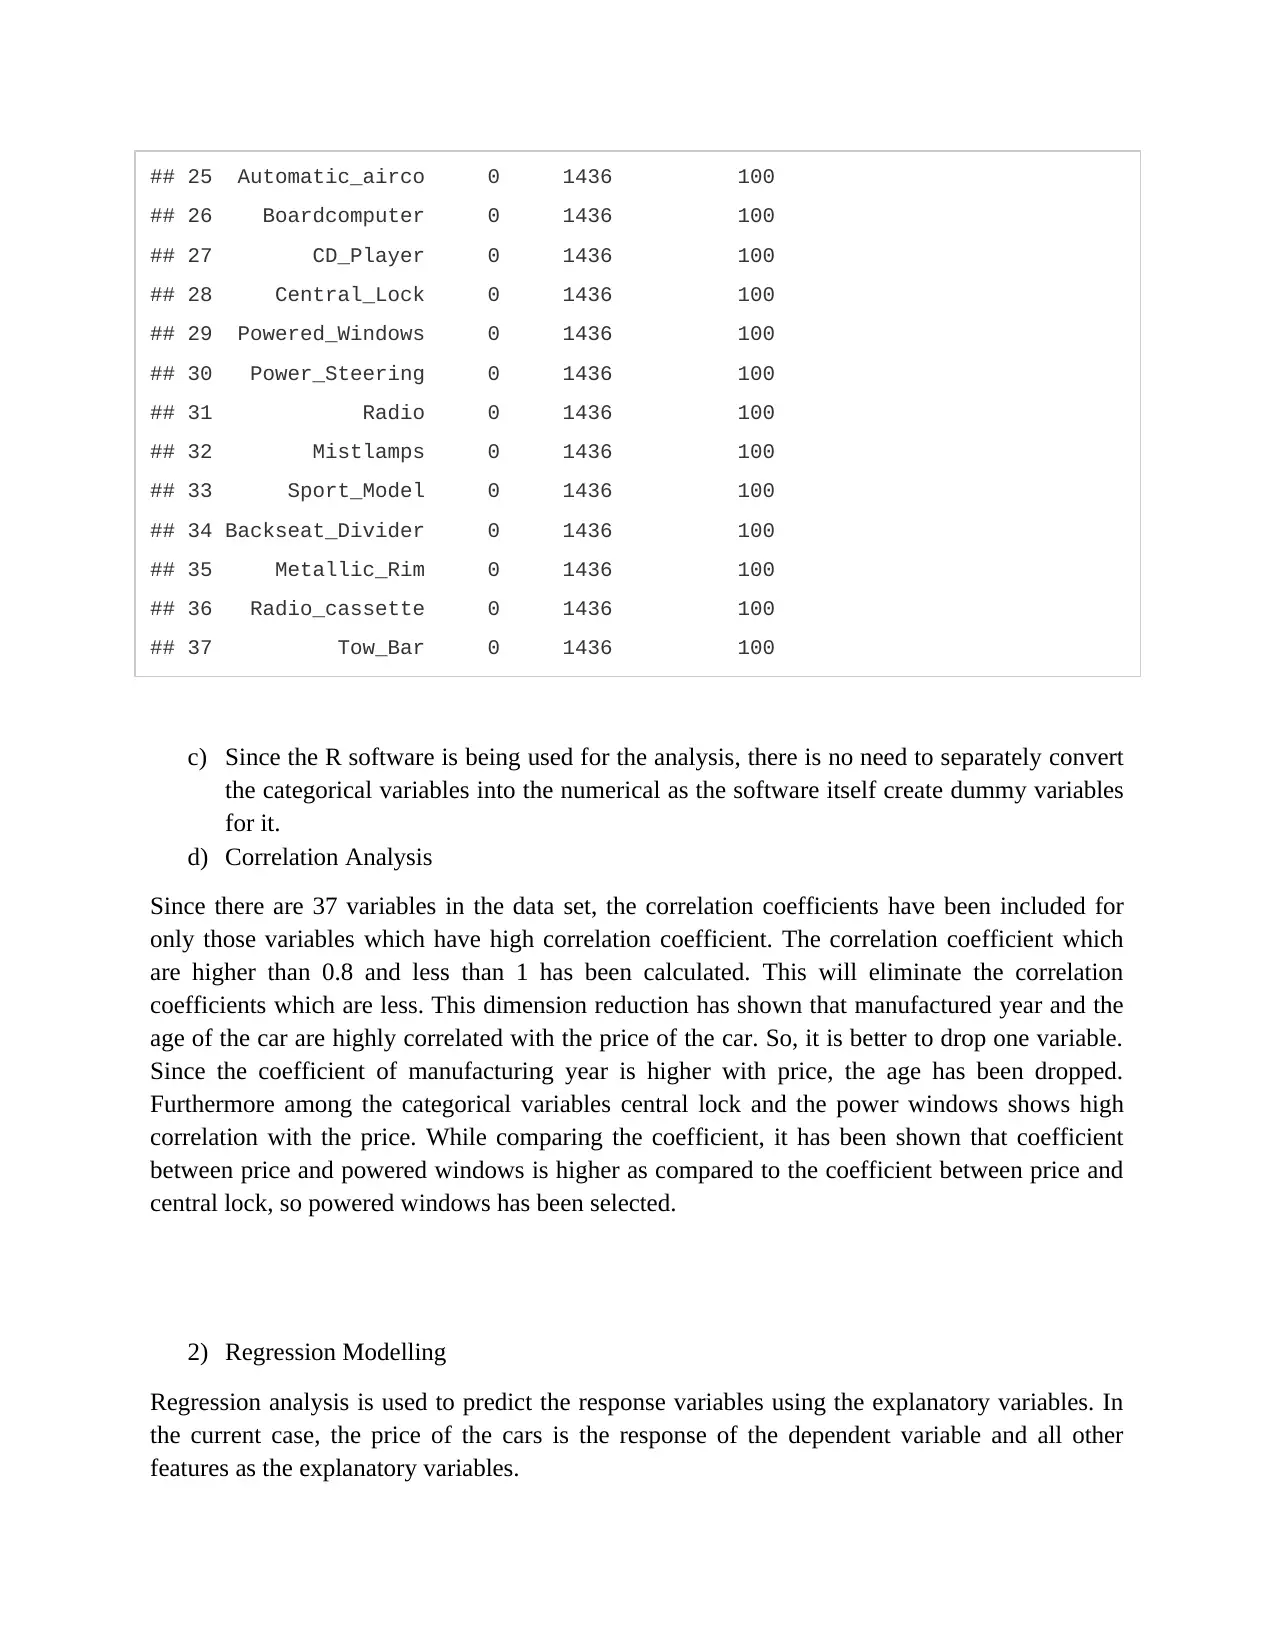
This assignment focuses on building and evaluating predictive models using two datasets: a cereal dataset for initial data exploration and cleaning, and a Toyota Corolla car sales dataset for regression modeling. The initial data exploration involves identifying continuous and categorical variables, calculating summary statistics, creating histograms to assess data distribution and skewness, and handling missing values using mean, median, and mode imputation. The second part involves building predictive models using the Toyota Corolla dataset. This includes examining price distribution, checking for missing values, performing correlation analysis to reduce dimensionality, and developing regression models to predict car prices. Several models are built, and iteratively improved based on the significance of coefficients and R-squared values, ultimately identifying an optimal model with highly significant coefficients.
1 out of 17
![Credit Scoring Model Development and Analysis - [Course Name]](/_next/image/?url=https%3A%2F%2Fdesklib.com%2Fmedia%2Fimages%2Fxd%2F3b3e7431b5e5468f919174fbcc150dc9.jpg&w=256&q=75)


Your All-in-One AI-Powered Toolkit for Academic Success.
+13062052269
info@desklib.com
Available 24*7 on WhatsApp / Email
![[object Object]](/_next/static/media/star-bottom.7253800d.svg)
Copyright © 2020–2026 A2Z Services. All Rights Reserved. Developed and managed by ZUCOL.