Financial Analysis Report: Principles of Financial Markets
VerifiedAdded on 2020/03/28
|21
|4225
|455
Report
AI Summary
This report conducts a comprehensive financial analysis of Origin Energy Limited and Caltex Australia Limited, key players in the Australian energy sector. It begins with an executive summary and introduction, followed by a top-down analysis of macroeconomic factors such as GDP, interest rates, currency value, inflation, and unemployment, assessing their impact on the energy industry. A bottom-up analysis then evaluates the companies' financial performance through liquidity, profitability, efficiency, capital structure, and market performance ratios. The report provides detailed descriptions of each ratio category and concludes with recommendations based on the findings. The analysis incorporates data from 2017 to compare the financial health and operational efficiency of the two companies, offering insights into their strategic positions within the dynamic energy market.

Financial Analysis 1
Principles of Financial Markets
Principles of Financial Markets
Paraphrase This Document
Need a fresh take? Get an instant paraphrase of this document with our AI Paraphraser
Financial Analysis 2
Table of Contents
Executive Summary.........................................................................................................................3
Introduction......................................................................................................................................4
Origin Energy Limited.................................................................................................................4
Caltex Australia Limited..............................................................................................................5
Top-down analysis...........................................................................................................................7
Existing Gross Domestic Product (GDP).....................................................................................7
Existing interest rate.....................................................................................................................8
Existing value of currency of Australia.......................................................................................8
Existing inflation rate...................................................................................................................9
Existing rate of unemployment....................................................................................................9
Bottom up Analysis.......................................................................................................................10
Analysis of Liquidity Ratio (Albrecht et. al., 2010)..................................................................10
Analysis of Profitability Ratio (Daly, 2011)..............................................................................11
Analysis of Efficiency Ratio (Coe, 2011)..................................................................................12
Analysis of Capital Structure ratio.............................................................................................13
Analysis of Market Performance ratio.......................................................................................14
Ratio Analysis................................................................................................................................15
Description of Liquidity Ratio...................................................................................................15
Financial Analysis 3
Description of Profitability Ratio...............................................................................................16
Description of Efficiency Ratio.................................................................................................17
Description of capital structure Ratio........................................................................................17
Description of Market Performance ratio..................................................................................17
Conclusion.....................................................................................................................................18
Recommendations..........................................................................................................................18
References......................................................................................................................................19
⊘ This is a preview!⊘
Do you want full access?
Subscribe today to unlock all pages.
Trusted by 1+ million students worldwide
Financial Analysis 4
Executive Summary
Economic analysis and financial analysis are very important components to identify the factors
which influence the financial performance of any company and decision of investors for the
purpose of investment. The overall report determined the current situation of companies Origin
Energy Limited and Caltex Australia Limited in the energy sector in Australia.
Top down analysis and bottom up analysis have been conducted for the purpose of finding
impact of economic environment of country on the performance of both the companies in energy
sector and to analyze and compare the financial performance of companies in terms of industry.
Various factors are considered in top down analysis such as current growth rate of GDP, inflation
rate, unemployment rate and interest rate which have direct and indirect impact on the energy
sector in Australia. Financial performances of both the companies are compared with the help of
different ratios such as operating ratio, profitability, liquidity, efficiency and ratios which shows
capital structure of the companies.
Paraphrase This Document
Need a fresh take? Get an instant paraphrase of this document with our AI Paraphraser
Financial Analysis 5
Introduction
In this report micro and macro economic analysis and financial analysis of the companies Origin
Energy Limited and Caltex Australia Limited in the energy and gas industry in Australia will be
conducted. The companies under the energy sector of Australia which are listed in the Australian
Stock Exchange mainly involved in the growth and development and exploration of oil, coal,
gas, uranium and renewable energy resources. There is largest contribution of the energy sector
in generating revenue and in enhancing the rate of Gross Domestic Product and the growth and
development of economy of Australia (Bahadori, et al., 2013). Natural resources and energy
generating resources are available in large quantity in Australia. Australia is largest provider of
uranium and LNG and one of the biggest exporters of coal in the whole world and particularly in
the regions of Asia. Energy sector also provides largest contribution in boosting capital market of
the country and known by largest developed and growing market in the economy.
Origin Energy Limited
Origin Energy is one of the biggest and leading companies in the Oil and Energy Industry of
Australia headquartered in Australian Square, Sydney. The company mainly involves in the
buying, generating, selling, exploration and delivery of natural gas and energy in Australia and
worldwide (Origin, 2017). Origin Energy Company was found in 2000 because of the separation
from another company Boral Ltd. for the purpose of forming a new and single company in
energy sector. From the year 2002 to 2015 Origin Company was involved in merger and
acquisition and conducted deals with various companies in energy sector worldwide such as
Victorian electricity, Kupe Gas Field, Contact Energy of New Zealand, Sun Retail Private
Limited and Eraring Energy. The major products and services of the Origin Energy Company are
natural gas, electric vehicle charging services, electricity, solar panels, cooling and heating, LPG,
Financial Analysis 6
and hot water (Origin, 2017). It is also one of the largest suppliers of products of less carbon
which includes Green Gas and electricity of Green Power for the purpose of reducing pollution
in the environment.
Origin is the biggest retailer in energy sector in Australia having 4500 million consumers
worldwide which includes residential customers and small and big market customers with 9000
employees working currently (Origin, 2017). Origin is also provider of renewable energy with
the use of upgraded technology like solar cell technology, wind and geothermal power plant.
Natural gas and coal are considered as natural sources of energy which are utilized by company
for generating the electricity. Mission statement of the company is to offer reliable, secure and
affordable energy services to customers and communities and provide better opportunities for
shareholders, communities, customers and business partners.
Caltex Australia Limited
Caltex was found in 1936 known as California Texas Oil Company as a result of merger between
the Standard Oil in California and Texas Company headquartered in Sydney. In the year 1968, it
was received the name Caltex Petroleum Corporations. Caltex is the biggest retail company in
the sector of oil and fuel industry having approximately 1850 service outlets in Australia (Caltex,
2017). Major products offered by the company are Petrol, Autogas, Motor oil, Diesel, Lubricants
and different retail stores such as Star Mart, Woolworths and Star Shop. This company is
providing its products and services in Australia as well as worldwide such as New Zealand,
China, Malaysia, Hong Kong, Philippines, South Africa, India, Taiwan and South Korea.
As the leading company in Australia in the oil, gas and fuel sector it is fulfilling the needs of one
third customers in Australia of fuel requirement for transport. With the help of exclusive supply
chain management it is supplying reliable, affordable, safe and best quality of fuel for different
⊘ This is a preview!⊘
Do you want full access?
Subscribe today to unlock all pages.
Trusted by 1+ million students worldwide
Financial Analysis 7
categories of customers such as small enterprises, retailers, aviation, marine, agriculture,
transport, automobile industries, big enterprises, mining and to the government institutions
(Caltex, 2017). Mission statement of the company is to offer best quality of fuel with reliable
supply and to generate job opportunities and help in growth and development of economy by
increasing productivity of country in the sector of oil and fuel. It is also known as biggest
franchisor and exclusive retailer as more than 80% of the outlets controlled by franchisees.
Paraphrase This Document
Need a fresh take? Get an instant paraphrase of this document with our AI Paraphraser
Financial Analysis 8
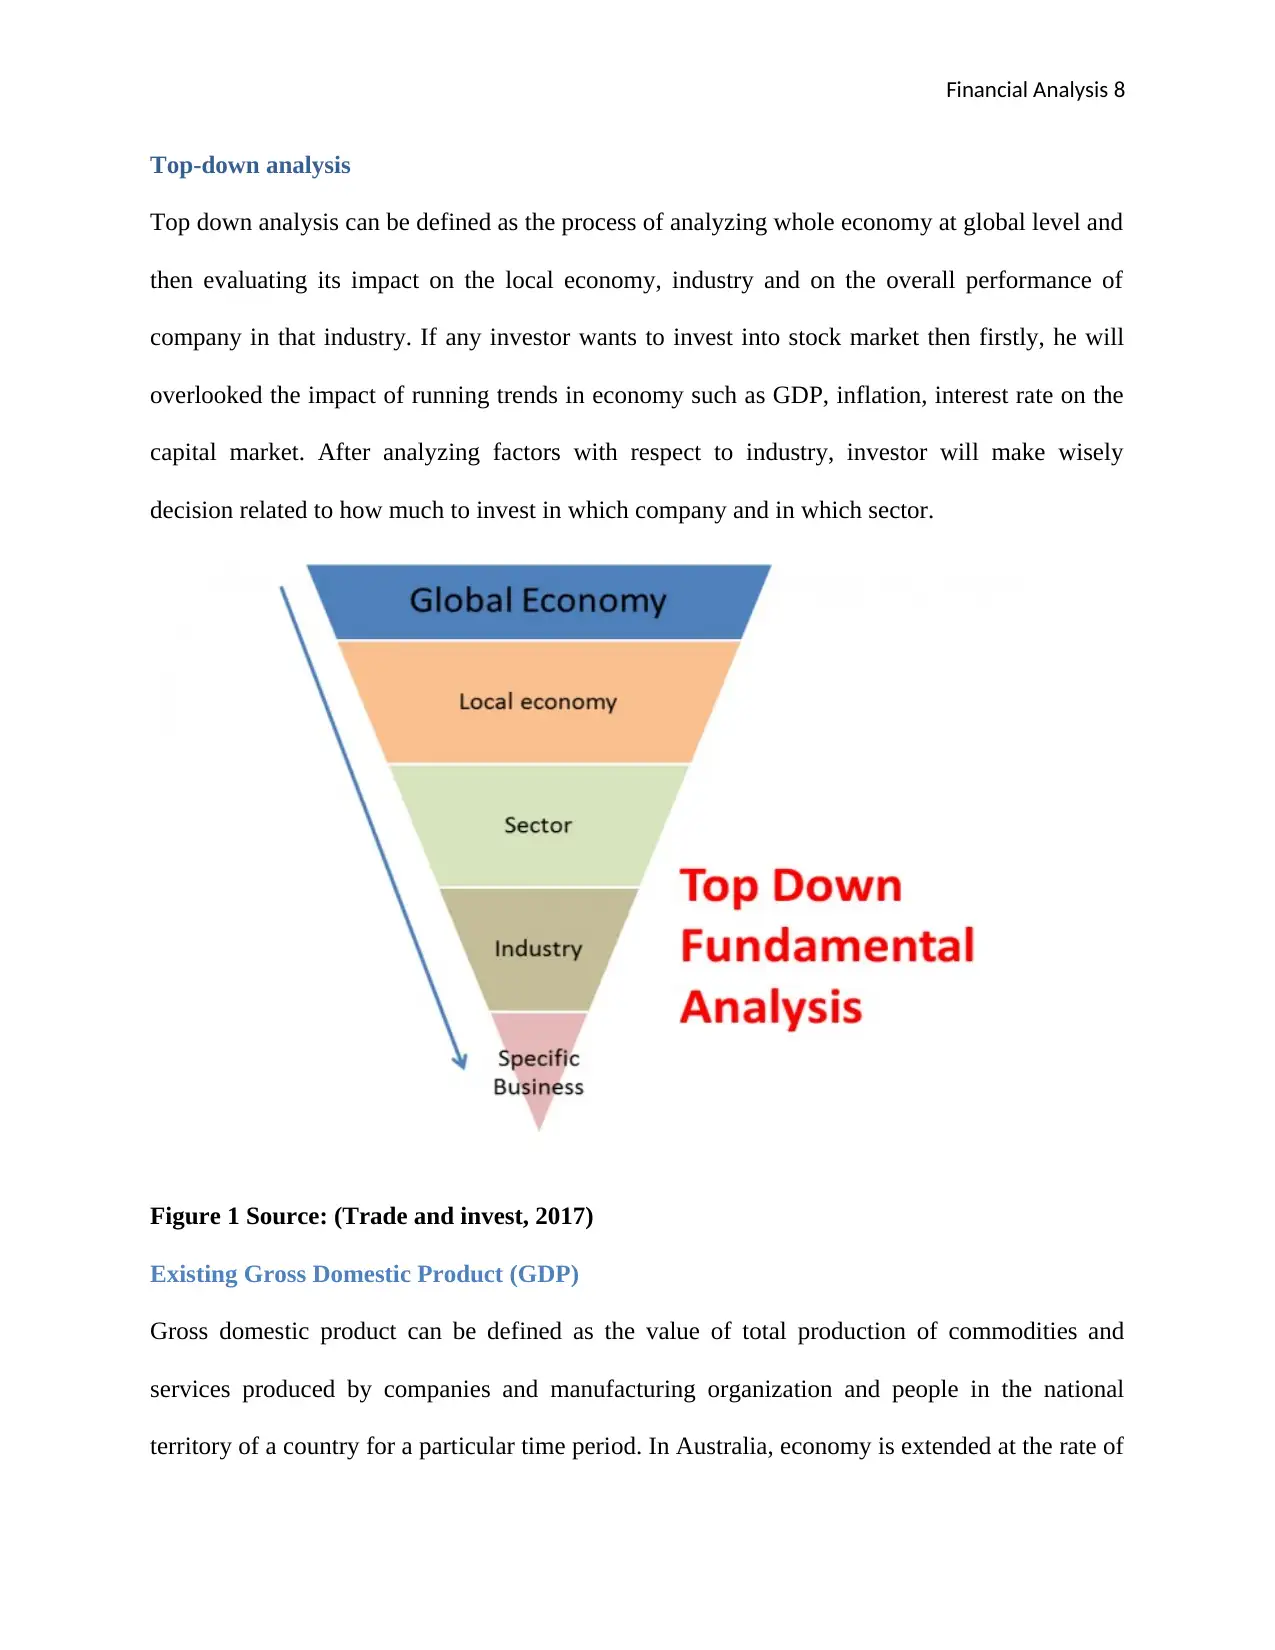
Top-down analysis
Top down analysis can be defined as the process of analyzing whole economy at global level and
then evaluating its impact on the local economy, industry and on the overall performance of
company in that industry. If any investor wants to invest into stock market then firstly, he will
overlooked the impact of running trends in economy such as GDP, inflation, interest rate on the
capital market. After analyzing factors with respect to industry, investor will make wisely
decision related to how much to invest in which company and in which sector.
Figure 1 Source: (Trade and invest, 2017)
Existing Gross Domestic Product (GDP)
Gross domestic product can be defined as the value of total production of commodities and
services produced by companies and manufacturing organization and people in the national
territory of a country for a particular time period. In Australia, economy is extended at the rate of
Financial Analysis 9
0.8 percent in the II quarter of June with comparison to the very slow growth rate in March
which was 0.3 percent in the financial year 2017. In 2016, the rate of GDP on annual basis was
1.8 percent. The main reasons behind the increasing growth rate in June month are increase in
the rate of consumption of government and domestic and positive expansion in the total exports
of country (Global Finance, 2017). If GDP is increasing in Australia, it will bring positive impact
on the industry of energy, oil and gas as overall economy will boost up then performances of
both the companies Origin Energy Limited and Caltex Australia Limited will also be favorable.
Existing interest rate
Interest rate can be defined as the rate which is charged by the lender of money against the
amount borrowed by the borrower of that money (Salgado, 2017). It is normally decided by the
Reserve Bank of Australia. In 2017, interest rate is 1.5 percent with compared to same interest
rate 1.5 percent in the year 2016 in Australia which is seen unchanged. In 2015 the rate of
interest was 2 percent, it can be analyzed that rate is decreasing in the year 2016 and 2017.
Origin Energy Limited and Caltex Australia Limited both the companies have favorable situation
in economy from the decreasing interest rate as companies can easily take finance from different
financial institutions at low rate.
Existing value of currency of Australia
Value of currency is also known as exchange rate which can be defined as the rate at which
currency of one country can be converted in the currency of another country (OECD, 2017). The
present exchange rate of one AUD is equal to 0.8034 US $ in 2017. Energy sector in Australia
mainly deals in the export of oil, electricity and gas worldwide. If the value of one AUD will
increase in future in comparison to other countries it will bring favorable outcome for the
performances of both the companies in Energy sector and help in generating more revenue.
⊘ This is a preview!⊘
Do you want full access?
Subscribe today to unlock all pages.
Trusted by 1+ million students worldwide
Financial Analysis 10
Existing inflation rate
Inflation is the situation in a country when all the prices of commodities will be rising and
demand of goods and services will be increased (Baker, et al., 2016). As a result of increase in
per capita income, demand will rise and supply of products will reduces which leads to growing
in the prices of products and services. Inflation rate in Australia in the year 2017 is 1.5 percent
which is more in comparison to 1.3 percent in 2016 (OECD, 2017). As increase in inflation rate
is beneficial for the companies Origin Energy Limited and Caltex Australia Limited because
increase in demand and prices will help in generating more revenue and but will be less
favorable for country because supply will reduce.
Existing rate of unemployment
Unemployment rate is the rate which shows how many persons are not having any source of
earning and looking for the employment opportunities for earning money. Australian government
conducts various programmes which aware people about different employment opportunities and
help in incorporation of new companies which can create new job opportunities for local people.
Current rate of unemployment is decreasing in Australia as 5.61% in the month of August from
5.699 % in the month of June in 2017 as approximately 26000 more jobs was created in the
month of July (Fieger, et al., 2017). As more persons get employment the per capita income will
increase which tends to increase in consumption level of people which is favorable situation for
energy sector in Australia.
Paraphrase This Document
Need a fresh take? Get an instant paraphrase of this document with our AI Paraphraser
Financial Analysis 11
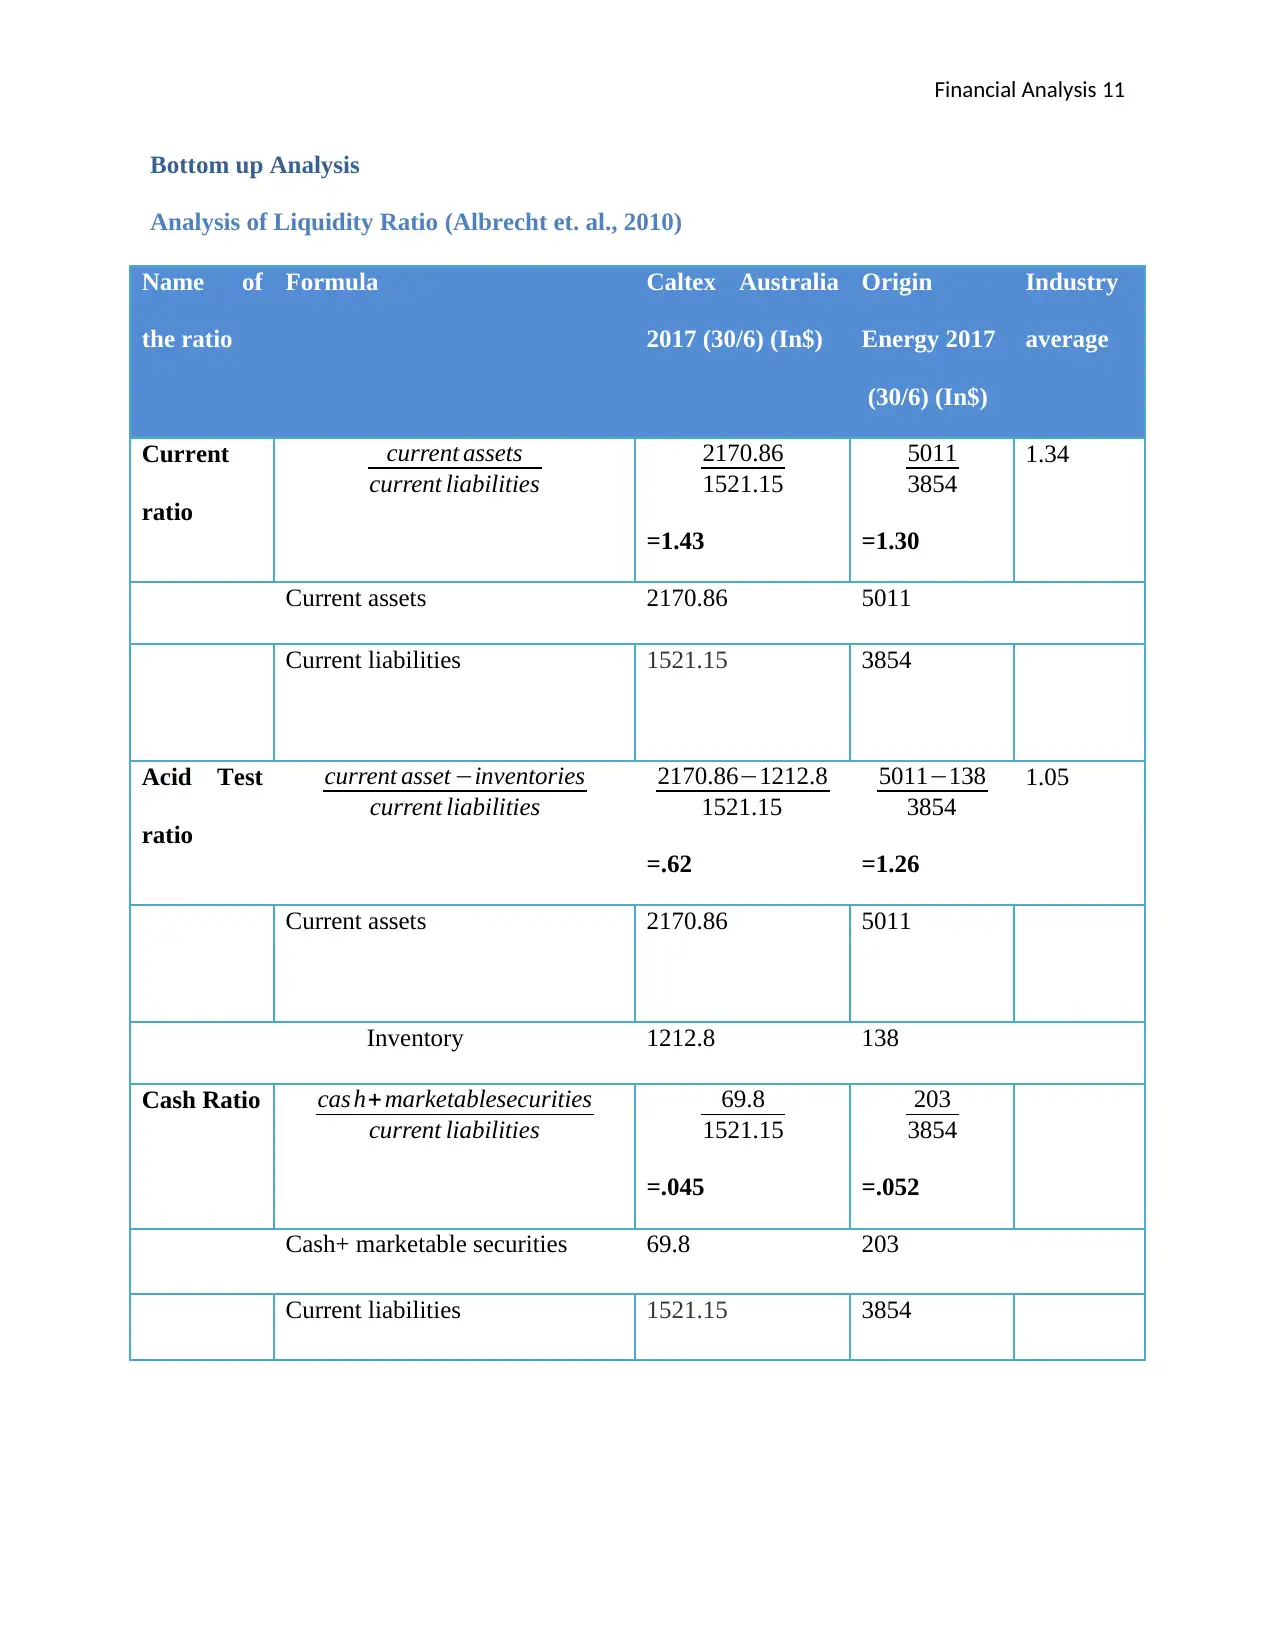
Bottom up Analysis
Analysis of Liquidity Ratio (Albrecht et. al., 2010)
Name of
the ratio
Formula Caltex Australia
2017 (30/6) (In$)
Origin
Energy 2017
(30/6) (In$)
Industry
average
Current
ratio
current assets
current liabilities
2170.86
1521.15
=1.43
5011
3854
=1.30
1.34
Current assets 2170.86 5011
Current liabilities 1521.15 3854
Acid Test
ratio
current asset −inventories
current liabilities
2170.86−1212.8
1521.15
=.62
5011−138
3854
=1.26
1.05
Current assets 2170.86 5011
Inventory 1212.8 138
Cash Ratio cas h+ marketablesecurities
current liabilities
69.8
1521.15
=.045
203
3854
=.052
Cash+ marketable securities 69.8 203
Current liabilities 1521.15 3854
Financial Analysis 12
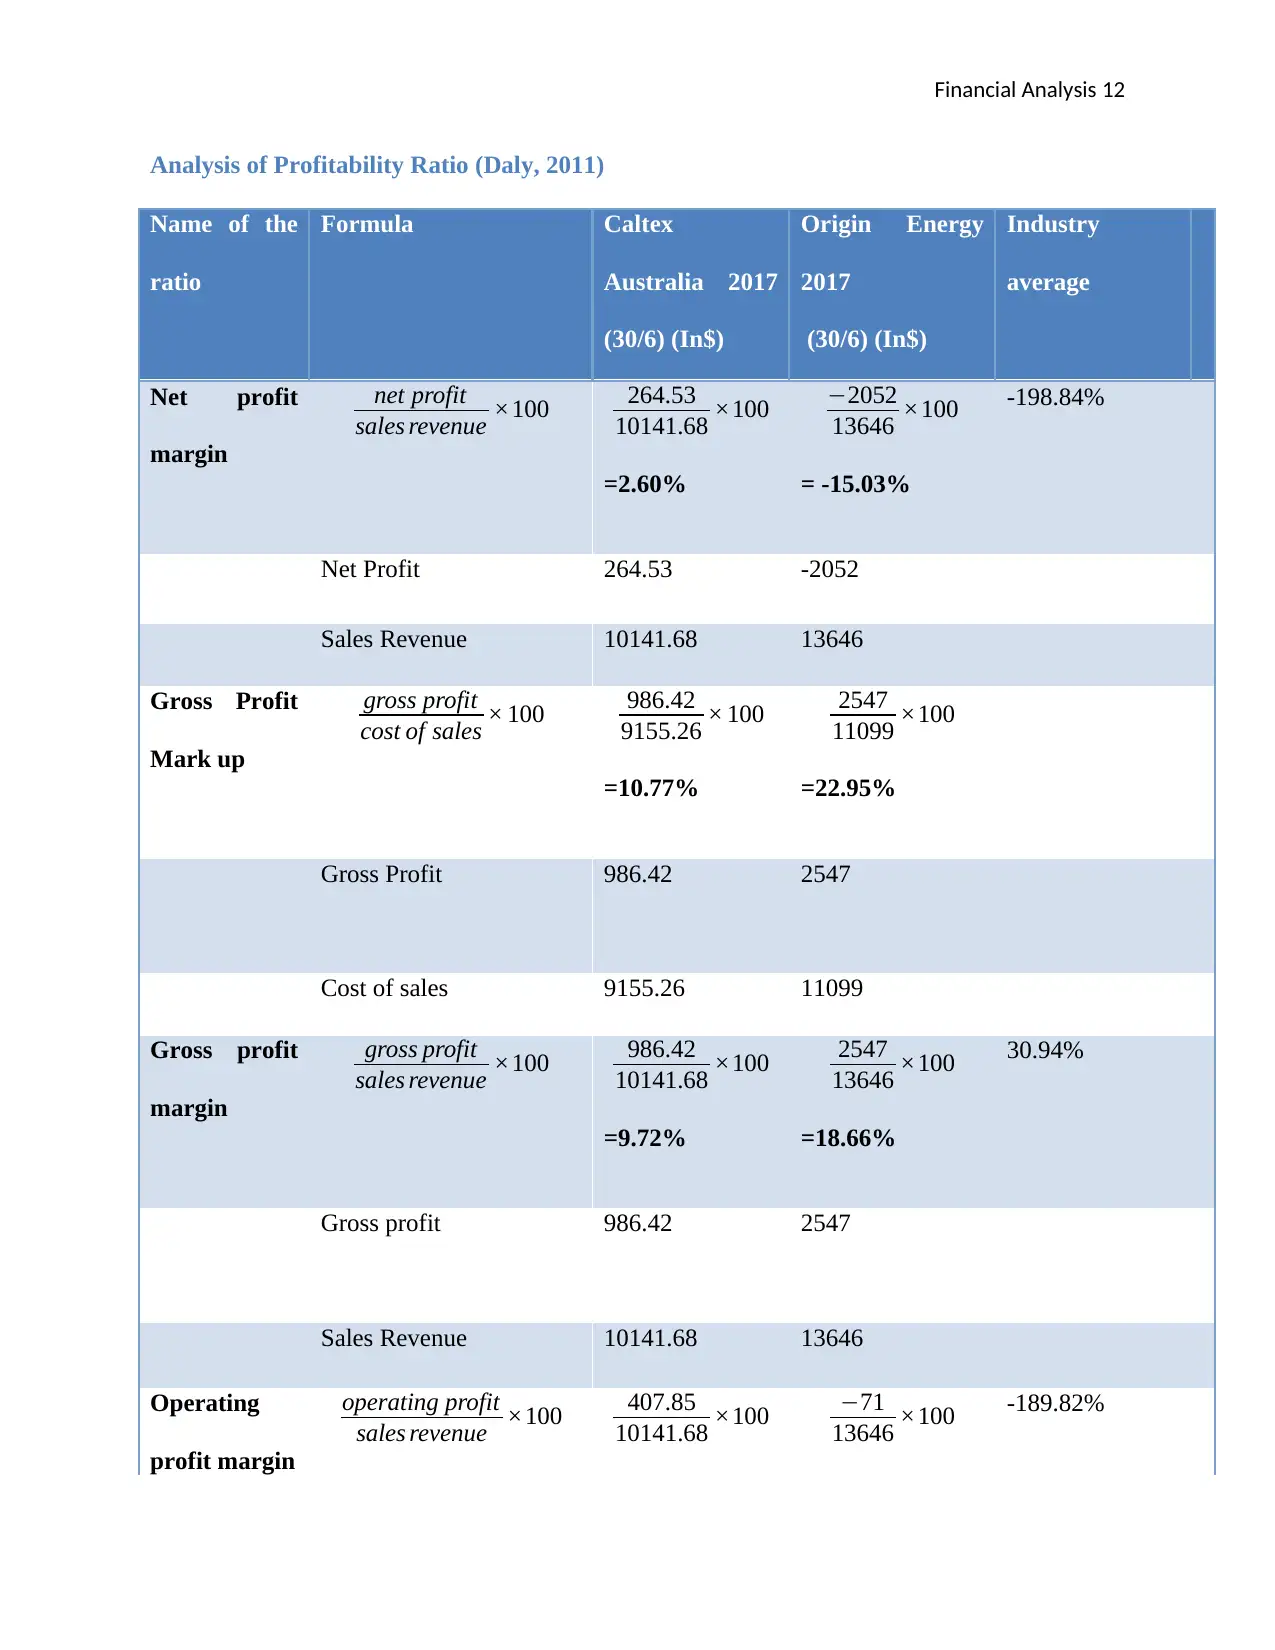
Analysis of Profitability Ratio (Daly, 2011)
Name of the
ratio
Formula Caltex
Australia 2017
(30/6) (In$)
Origin Energy
2017
(30/6) (In$)
Industry
average
Net profit
margin
net profit
sales revenue ×100 264.53
10141.68 ×100
=2.60%
−2052
13646 ×100
= -15.03%
-198.84%
Net Profit 264.53 -2052
Sales Revenue 10141.68 13646
Gross Profit
Mark up
gross profit
cost of sales × 100 986.42
9155.26 × 100
=10.77%
2547
11099 ×100
=22.95%
Gross Profit 986.42 2547
Cost of sales 9155.26 11099
Gross profit
margin
gross profit
sales revenue ×100 986.42
10141.68 ×100
=9.72%
2547
13646 ×100
=18.66%
30.94%
Gross profit 986.42 2547
Sales Revenue 10141.68 13646
Operating
profit margin
operating profit
sales revenue ×100 407.85
10141.68 ×100 −71
13646 ×100 -189.82%
⊘ This is a preview!⊘
Do you want full access?
Subscribe today to unlock all pages.
Trusted by 1+ million students worldwide
1 out of 21
Related Documents


Your All-in-One AI-Powered Toolkit for Academic Success.
+13062052269
info@desklib.com
Available 24*7 on WhatsApp / Email
![[object Object]](/_next/static/media/star-bottom.7253800d.svg)
Unlock your academic potential
Copyright © 2020–2025 A2Z Services. All Rights Reserved. Developed and managed by ZUCOL.