MSc Data Science Report: Itineract Travel Co Searchability Challenge
VerifiedAdded on 2022/08/25
|21
|5092
|26
Report
AI Summary
This report presents a data science analysis of Itineract Travel Co, focusing on the company's searchability challenge. The report begins with an assessment of the briefing note, highlighting key points and evaluating the potential of the provided dataset to meet the aims outlined. The analysis includes exploratory data analysis (EDA), statistical pattern identification, and inferential statistics. Regression models are utilized to determine customer satisfaction based on factors such as age, experiences purchased, and total revenue. The findings reveal correlations and insights into customer behavior, with recommendations provided for improving customer experience and searchability. Statistical measures like Pearson Correlation and regression are used, along with descriptive and residual statistics. The report also includes a classification analysis, which is summarized in the appendices. The report concludes with a discussion of ethical and security considerations, and potential solutions to address the challenges faced by Itineract Travel Co.
Principles of Data Science
for Business
for Business
Paraphrase This Document
Need a fresh take? Get an instant paraphrase of this document with our AI Paraphraser
Table of Contents
Section 1: Assessment of Itineract Travel Co briefing note:............................................4
Section 2: Overview of investigation.....................................................................................5
Section 3: Analysis and results...............................................................................................6
Section 4: Ethical and security considerations.....................................................................17
Section 5: Data Science in Next Steps and Potential Solutions:..........................................17
Report Appendix: Statistics and Methodology:...................................................................19
REFERENCES..............................................................................................................................22
ITINERACT TRAVEL CO – SEARCHABILITY CHALLENGE:
REPORT & RECOMMENDATIONS
Section 1: Assessment of Itineract Travel Co briefing note:
Data studies develop to be one of qualified experts that help in making various important
results which are beneficial for making effective decision. Now effective computer experts
recognize that they need to learn the conventional expertise in data analysis, data collection and
coding in large quantities (Data science, 2020). Data scientists need to monitor the full scope of
the data science development cycle and have a degree of independence and comprehension to
optimize return in every step of the way in which to discover valuable intelligence for certain
companies.
As the business growth Itineract Travel Company strategies focus on bringing the number
of tourists to the website and the service provided to thousands of people, it will become
unbelievably complex to align correct interactions with each future customer, while also time
becoming crucial to meet the development targets of the organization. Heterogenous nature of
the clients and a unique nature of the activities makes a challenging product searchability as the
company plans on expanding its users. Based on the current problem on the knowledge gap on
user experience, Data Science tools are important in identifying a balancing act between aimed
at achieving positive user experience which will not only aid in upscaling Itineract Travel Co’s
Market but also improving the overall customer experience. Using historical data based on a
simple pilot recommendation system currently used in the company where the customers see
travel experiences that relates to causes they initially booked, data science becomes an effective
tool in matching the right experiences to individual customers thus simplifying an otherwise
complicated process.
From Itineract Travlel Co core question, the company’s primary goal in resolving the
current issue is the desire to match accurately match customer interactions and interest to the
services offered in order to improve customer satisfaction. This enhances the complexity of size
finding commodity appropriate to need and desire. If a clear information set is confirmed,
Itineract Travel Company must establish and manage a state-of-the-art recommendation
framework and build an internal data science team. Considering company’s vulnerability to
numerous political causes, even a recommendation system would be cautiously prepared and
monitored. The multiple decision-making approaches include a variety of parameters for
⊘ This is a preview!⊘
Do you want full access?
Subscribe today to unlock all pages.
Trusted by 1+ million students worldwide
consideration of choices. Strategic decision-making for the performance of companies is also
essential. As a data scientist in digital marketing and analytics consultancy different decision
policies must be followed according to the principles, risk behaviours and the expectation of
future results of the decision-makers (Provost and Fawcett, 2013). The policy-making
mechanisms, for example the decision-maker, circumstance in decisions and problem solving
procedures, have particular characteristics.
The dataset provided including age, favourite cause, total revenue earned, age, experience
and id are adequate in answering investigation questions aimed at assessing functional properties
of customer’s willingness to travel, cause preference and as decision making tool. How well this
however depend on the accuracy and sample size of the data provided
The work involves data preparation, study of exploratory information and inferential
numerical analysis. Within this report, basic specifics are provided within the annex. This should
end by presenting potential answers to the findings of the study as proposed by (Lakowicz,
2013). This done using Excel data analysis tool. The statistical measures used include Pearson
Correlation coefficient and regression.
Section 2: Overview of investigation
The analysis started by presenting the information in a manner in which exploratory data
(EDA) can be analysed. It included the reorganization of data and any processing of data that I
thought may also induced partiality. EDA is "the tool for the standardized representation of all
factors through the data visualization. The trends are defined through EDA which is an indicator
of the in which the shift in travelling need of the customer occurred and a statistical insight for
exploration reasons. The effect was a huge number of excellent visualizations, demonstrating
how the traffic problem evolved overtime. The next step of the investigation revolved about
establishing a statistical pattern aimed at creating a better ground for statistical analysis could be
cantered on. The distribution of the results were then checked and I discovered that the results
were not normally distributed and the values were more nearer to the Poisson test. This gave me
an opportunity to understand what sort of inferential figures are vital in decision making.
Inferential statistics were then done as a bootstrap. This provided for an opportunity to quantify
confidence intervals aimed at deciding if statistically significant variations are known, whether
or not these discrepancies were the result of a change, or could have happened within the
customer preferences and the tourist destination. This was done in order to ensure that the
Paraphrase This Document
Need a fresh take? Get an instant paraphrase of this document with our AI Paraphraser
management is more confident of the improvements noticed and can therefore depended upon in
the decision making process. Eventually, these findings can be used considering possible
approaches to the problems and proposed methods for data science that could be adapted and
recommended for execution and effectiveness. The different data set related to customer
experience including age, favourite reason for the rating for experience, the gender within 1000
observations were employed in the process. Moreover the data set used also includes the id code
which was allotted for each individual and group of customer visiting specific place in that time
period as per their desire and requirement. In addition the entire observation also included the
total revenue generated from specific location and each customer were selected for the pilot or
not.
Section 3: Analysis and results
In order to perform proper and authentic analysis and determine the suitable results,
regression models are used. The models help to define that the customer visiting a particular
place are satisfied or not.
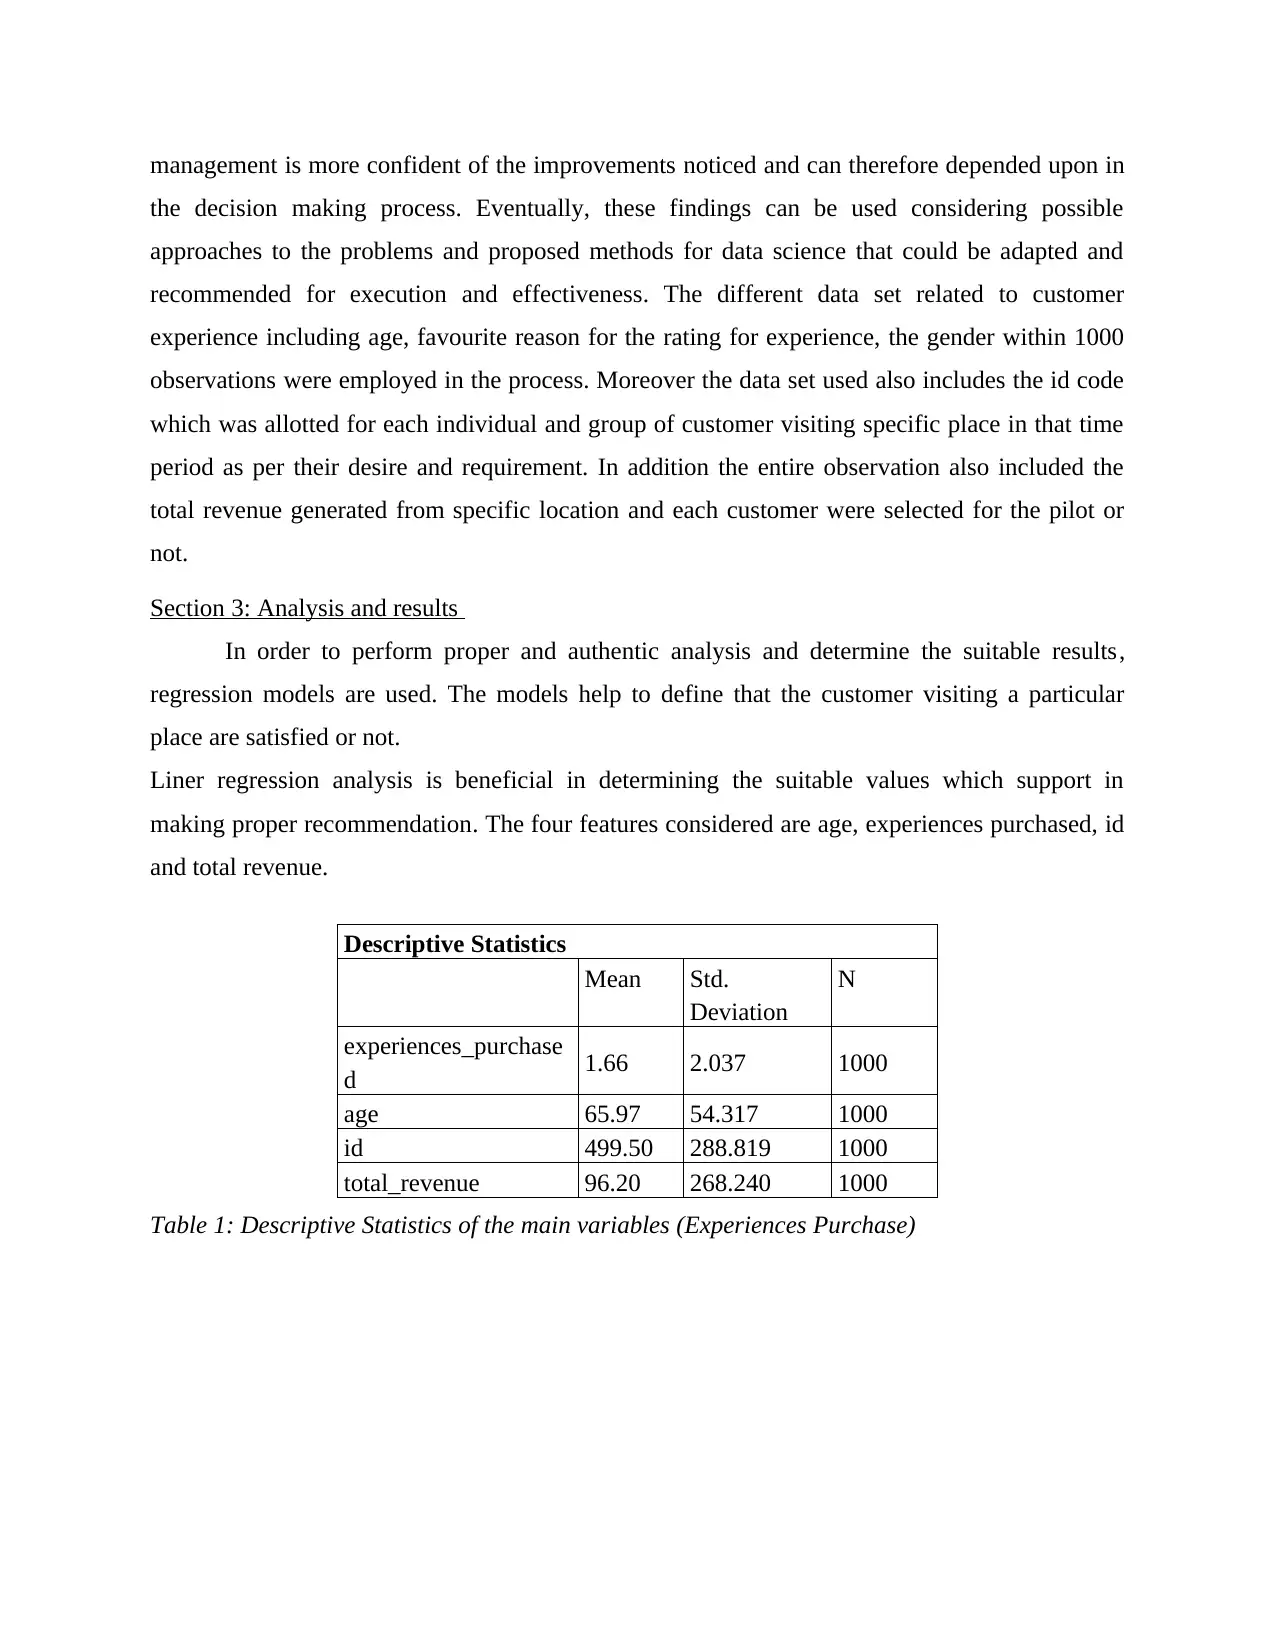
Liner regression analysis is beneficial in determining the suitable values which support in
making proper recommendation. The four features considered are age, experiences purchased, id
and total revenue.
Descriptive Statistics
Mean Std.
Deviation
N
experiences_purchase
d 1.66 2.037 1000
age 65.97 54.317 1000
id 499.50 288.819 1000
total_revenue 96.20 268.240 1000
Table 1: Descriptive Statistics of the main variables (Experiences Purchase)
the decision making process. Eventually, these findings can be used considering possible
approaches to the problems and proposed methods for data science that could be adapted and
recommended for execution and effectiveness. The different data set related to customer
experience including age, favourite reason for the rating for experience, the gender within 1000
observations were employed in the process. Moreover the data set used also includes the id code
which was allotted for each individual and group of customer visiting specific place in that time
period as per their desire and requirement. In addition the entire observation also included the
total revenue generated from specific location and each customer were selected for the pilot or
not.
Section 3: Analysis and results
In order to perform proper and authentic analysis and determine the suitable results,
regression models are used. The models help to define that the customer visiting a particular
place are satisfied or not.
Liner regression analysis is beneficial in determining the suitable values which support in
making proper recommendation. The four features considered are age, experiences purchased, id
and total revenue.
Descriptive Statistics
Mean Std.
Deviation
N
experiences_purchase
d 1.66 2.037 1000
age 65.97 54.317 1000
id 499.50 288.819 1000
total_revenue 96.20 268.240 1000
Table 1: Descriptive Statistics of the main variables (Experiences Purchase)
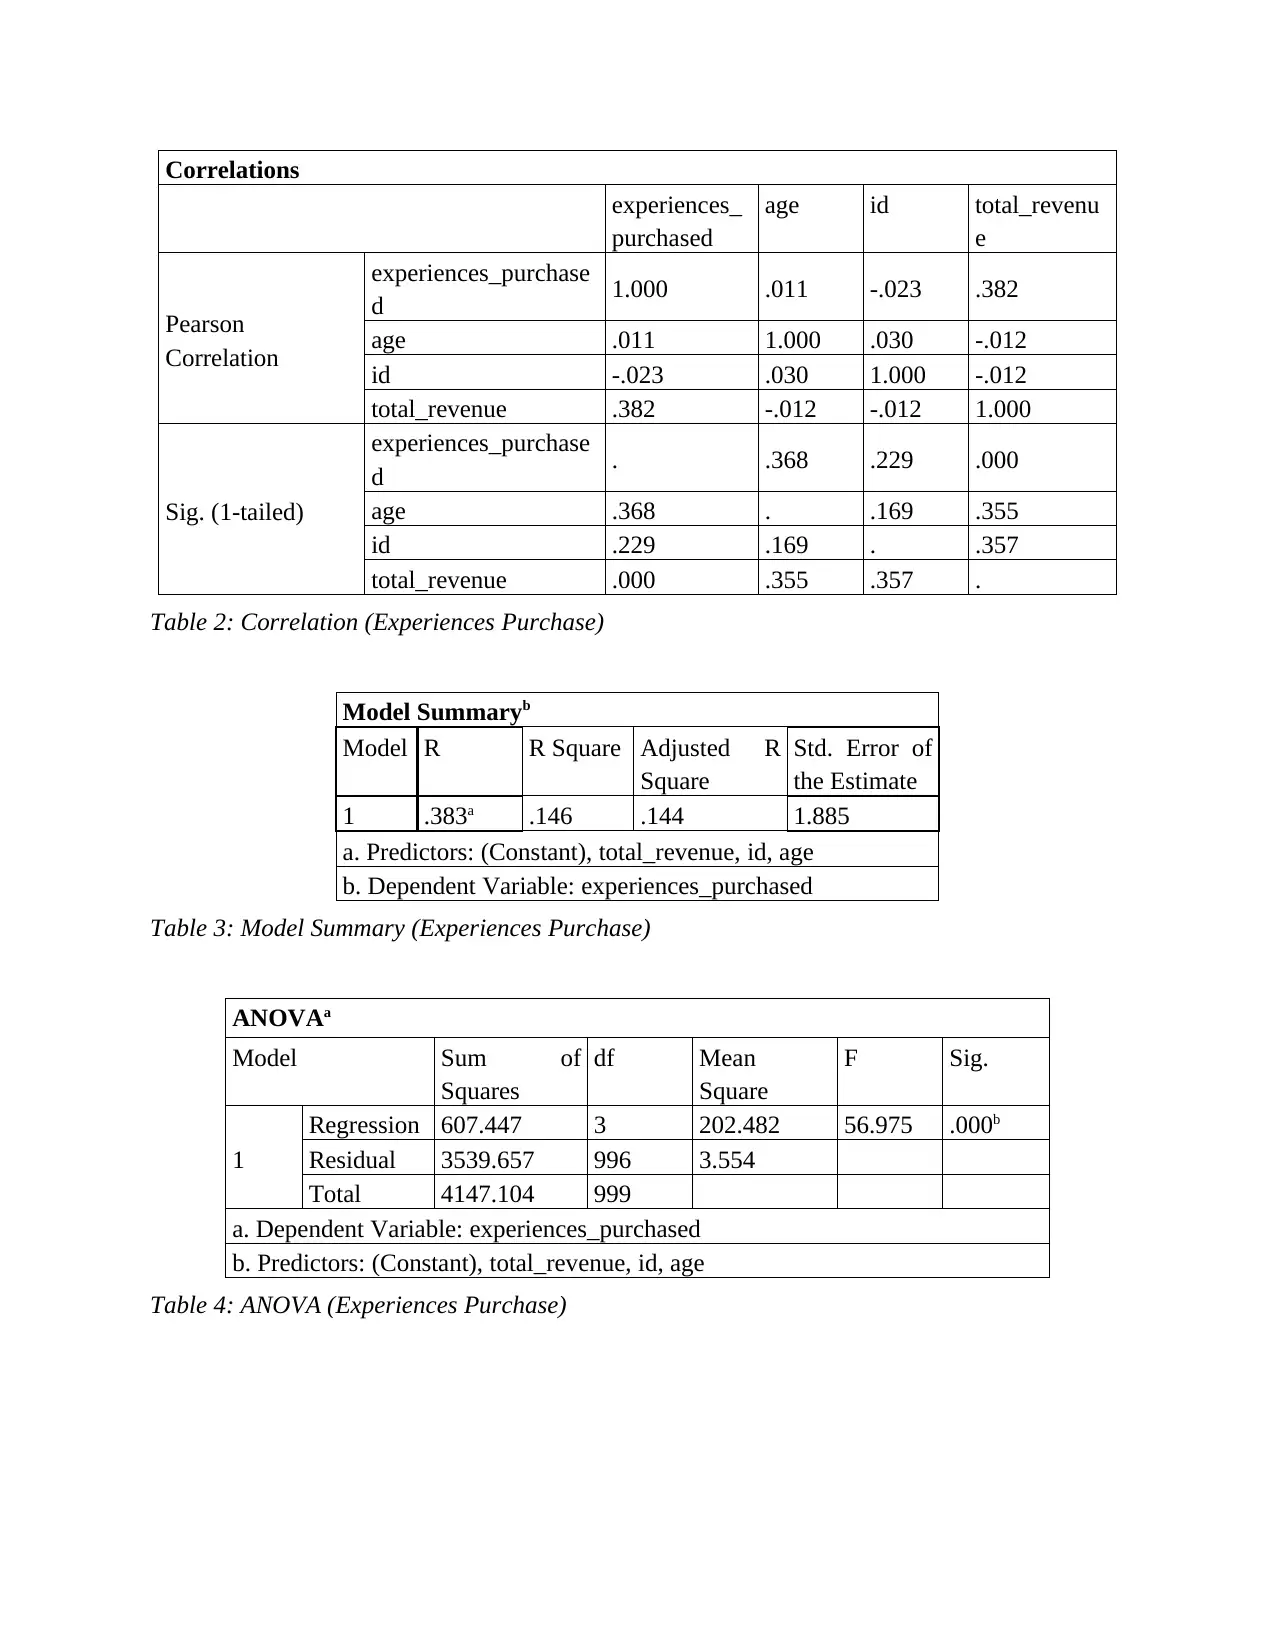
Correlations
experiences_
purchased
age id total_revenu
e
Pearson
Correlation
experiences_purchase
d 1.000 .011 -.023 .382
age .011 1.000 .030 -.012
id -.023 .030 1.000 -.012
total_revenue .382 -.012 -.012 1.000
Sig. (1-tailed)
experiences_purchase
d . .368 .229 .000
age .368 . .169 .355
id .229 .169 . .357
total_revenue .000 .355 .357 .
Table 2: Correlation (Experiences Purchase)
Model Summaryb
Model R R Square Adjusted R
Square
Std. Error of
the Estimate
1 .383a .146 .144 1.885
a. Predictors: (Constant), total_revenue, id, age
b. Dependent Variable: experiences_purchased
Table 3: Model Summary (Experiences Purchase)
ANOVAa
Model Sum of
Squares
df Mean
Square
F Sig.
1
Regression 607.447 3 202.482 56.975 .000b
Residual 3539.657 996 3.554
Total 4147.104 999
a. Dependent Variable: experiences_purchased
b. Predictors: (Constant), total_revenue, id, age
Table 4: ANOVA (Experiences Purchase)
⊘ This is a preview!⊘
Do you want full access?
Subscribe today to unlock all pages.
Trusted by 1+ million students worldwide
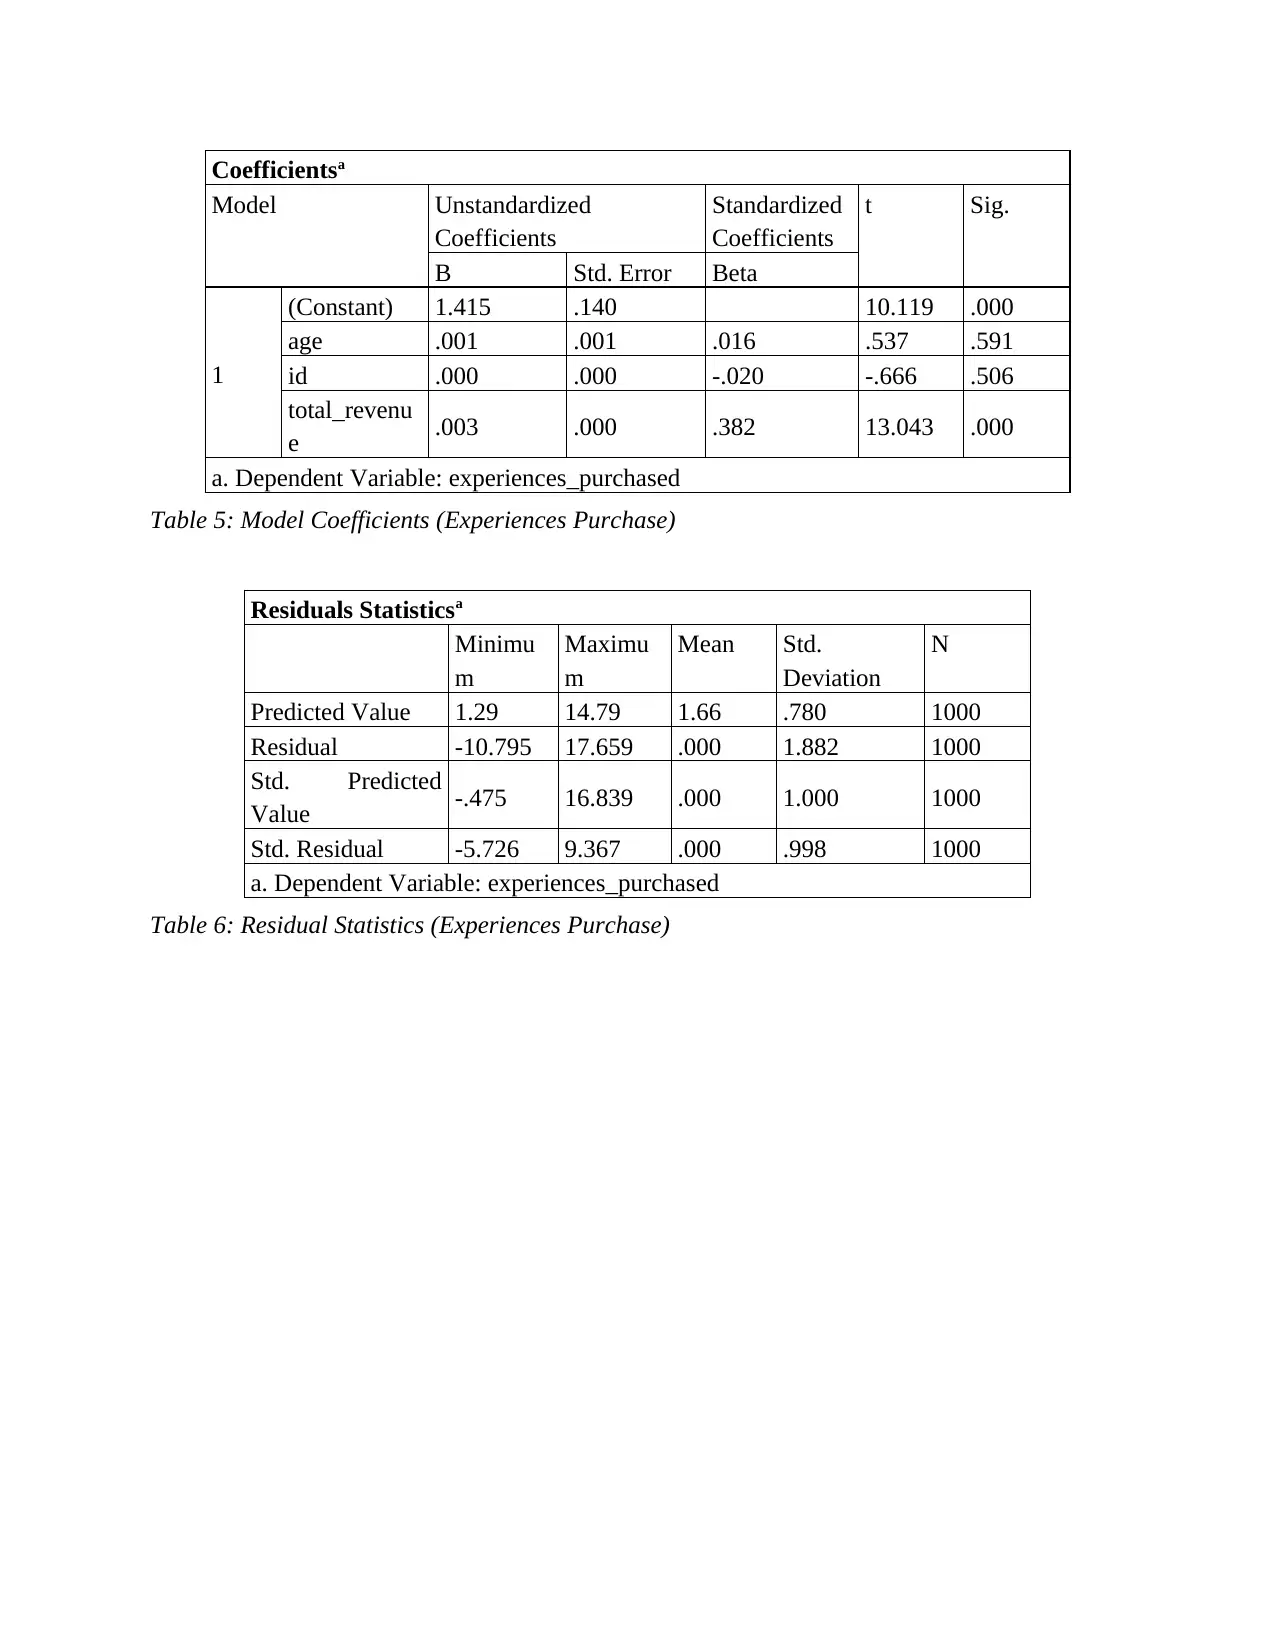
Coefficientsa
Model Unstandardized
Coefficients
Standardized
Coefficients
t Sig.
B Std. Error Beta
1
(Constant) 1.415 .140 10.119 .000
age .001 .001 .016 .537 .591
id .000 .000 -.020 -.666 .506
total_revenu
e .003 .000 .382 13.043 .000
a. Dependent Variable: experiences_purchased
Table 5: Model Coefficients (Experiences Purchase)
Residuals Statisticsa
Minimu
m
Maximu
m
Mean Std.
Deviation
N
Predicted Value 1.29 14.79 1.66 .780 1000
Residual -10.795 17.659 .000 1.882 1000
Std. Predicted
Value -.475 16.839 .000 1.000 1000
Std. Residual -5.726 9.367 .000 .998 1000
a. Dependent Variable: experiences_purchased
Table 6: Residual Statistics (Experiences Purchase)
Paraphrase This Document
Need a fresh take? Get an instant paraphrase of this document with our AI Paraphraser
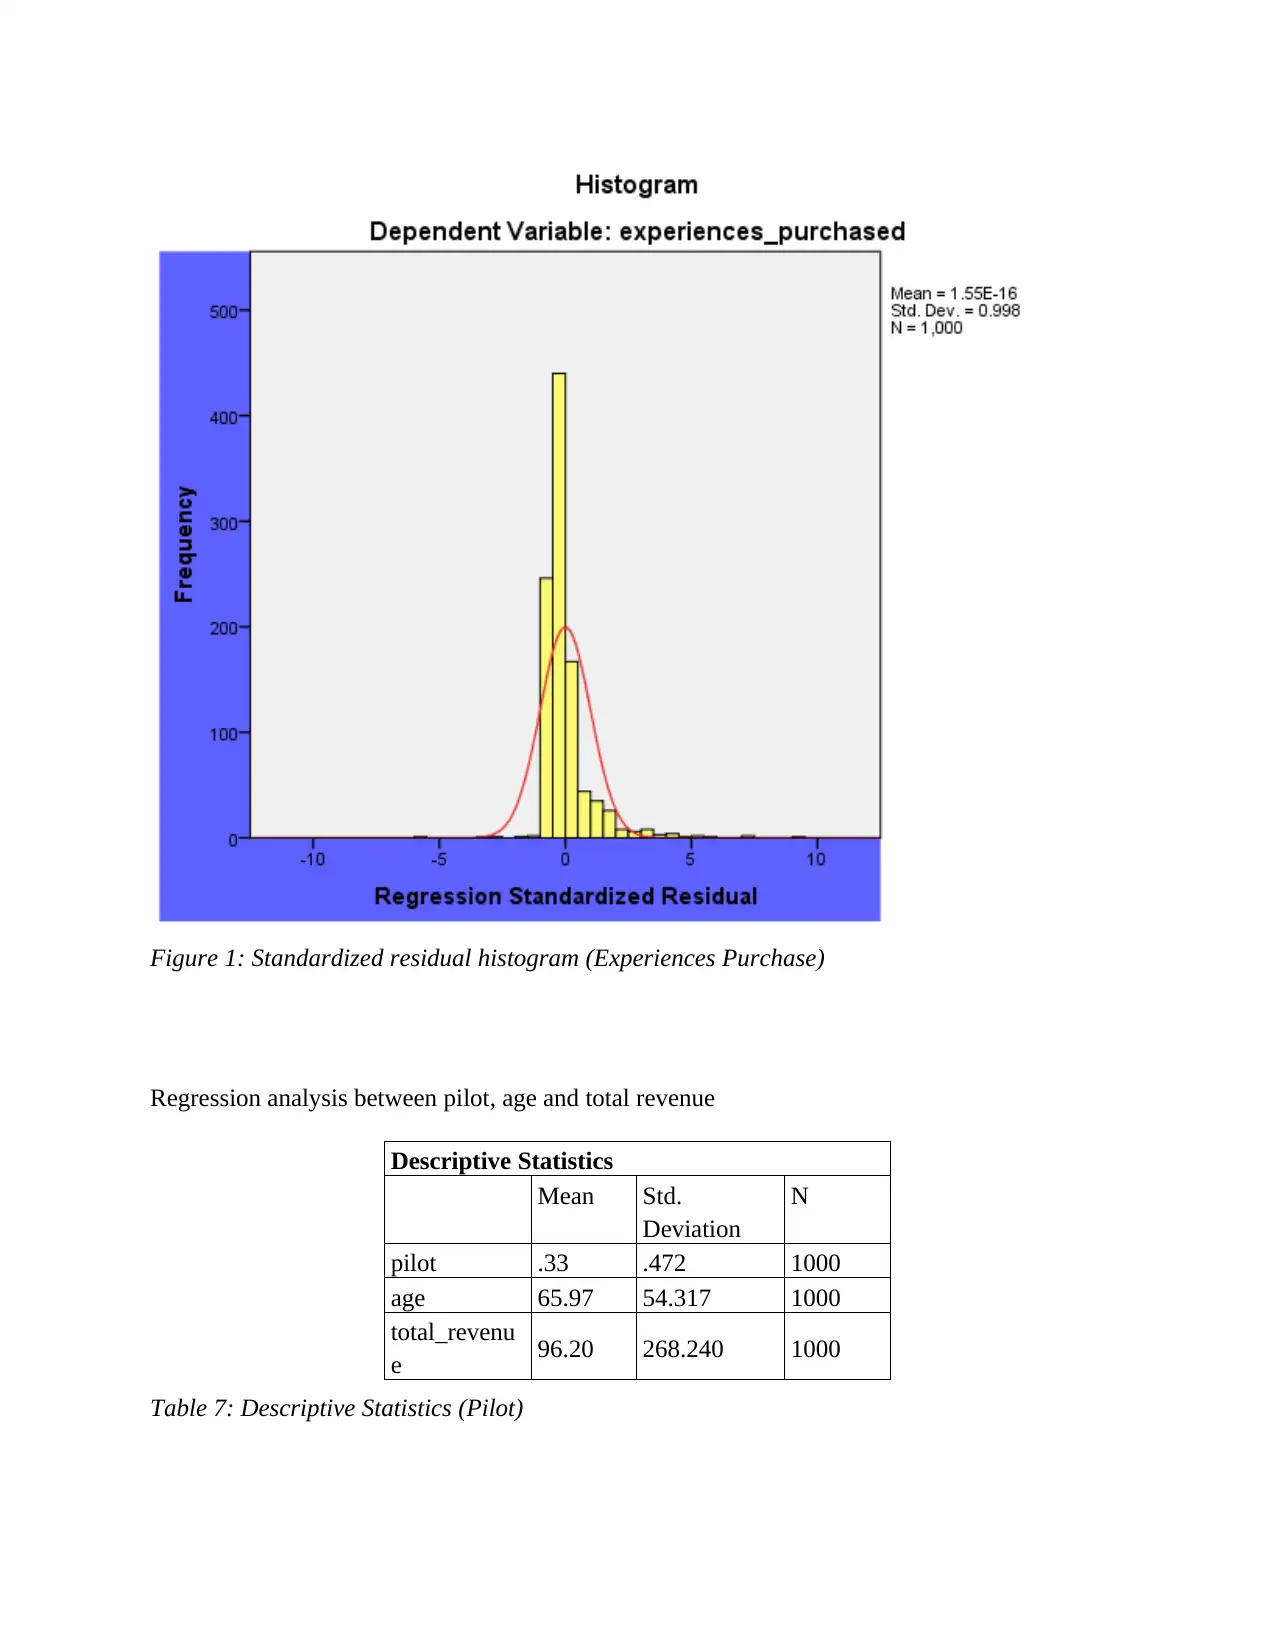
Figure 1: Standardized residual histogram (Experiences Purchase)
Regression analysis between pilot, age and total revenue
Descriptive Statistics
Mean Std.
Deviation
N
pilot .33 .472 1000
age 65.97 54.317 1000
total_revenu
e 96.20 268.240 1000
Table 7: Descriptive Statistics (Pilot)
Regression analysis between pilot, age and total revenue
Descriptive Statistics
Mean Std.
Deviation
N
pilot .33 .472 1000
age 65.97 54.317 1000
total_revenu
e 96.20 268.240 1000
Table 7: Descriptive Statistics (Pilot)
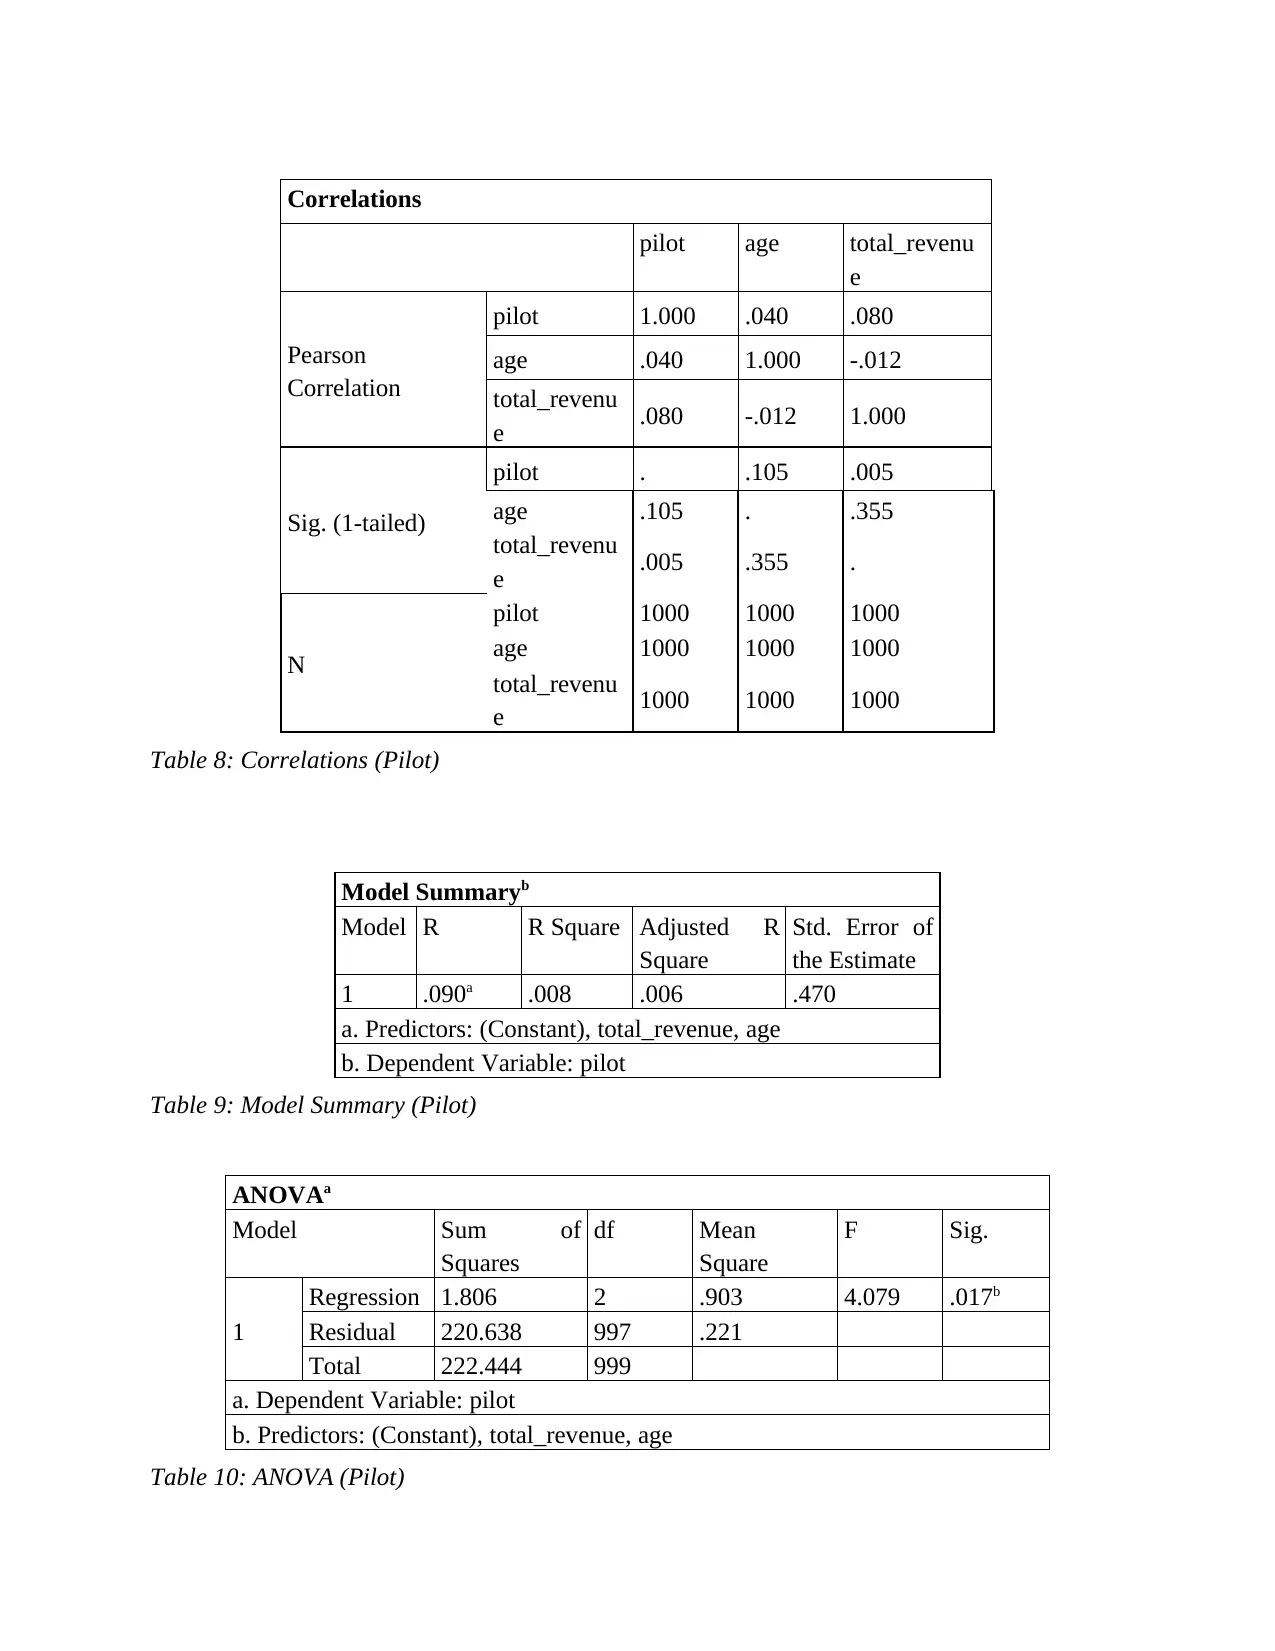
Correlations
pilot age total_revenu
e
Pearson
Correlation
pilot 1.000 .040 .080
age .040 1.000 -.012
total_revenu
e .080 -.012 1.000
Sig. (1-tailed)
pilot . .105 .005
age .105 . .355
total_revenu
e .005 .355 .
N
pilot 1000 1000 1000
age 1000 1000 1000
total_revenu
e 1000 1000 1000
Table 8: Correlations (Pilot)
Model Summaryb
Model R R Square Adjusted R
Square
Std. Error of
the Estimate
1 .090a .008 .006 .470
a. Predictors: (Constant), total_revenue, age
b. Dependent Variable: pilot
Table 9: Model Summary (Pilot)
ANOVAa
Model Sum of
Squares
df Mean
Square
F Sig.
1
Regression 1.806 2 .903 4.079 .017b
Residual 220.638 997 .221
Total 222.444 999
a. Dependent Variable: pilot
b. Predictors: (Constant), total_revenue, age
Table 10: ANOVA (Pilot)
⊘ This is a preview!⊘
Do you want full access?
Subscribe today to unlock all pages.
Trusted by 1+ million students worldwide
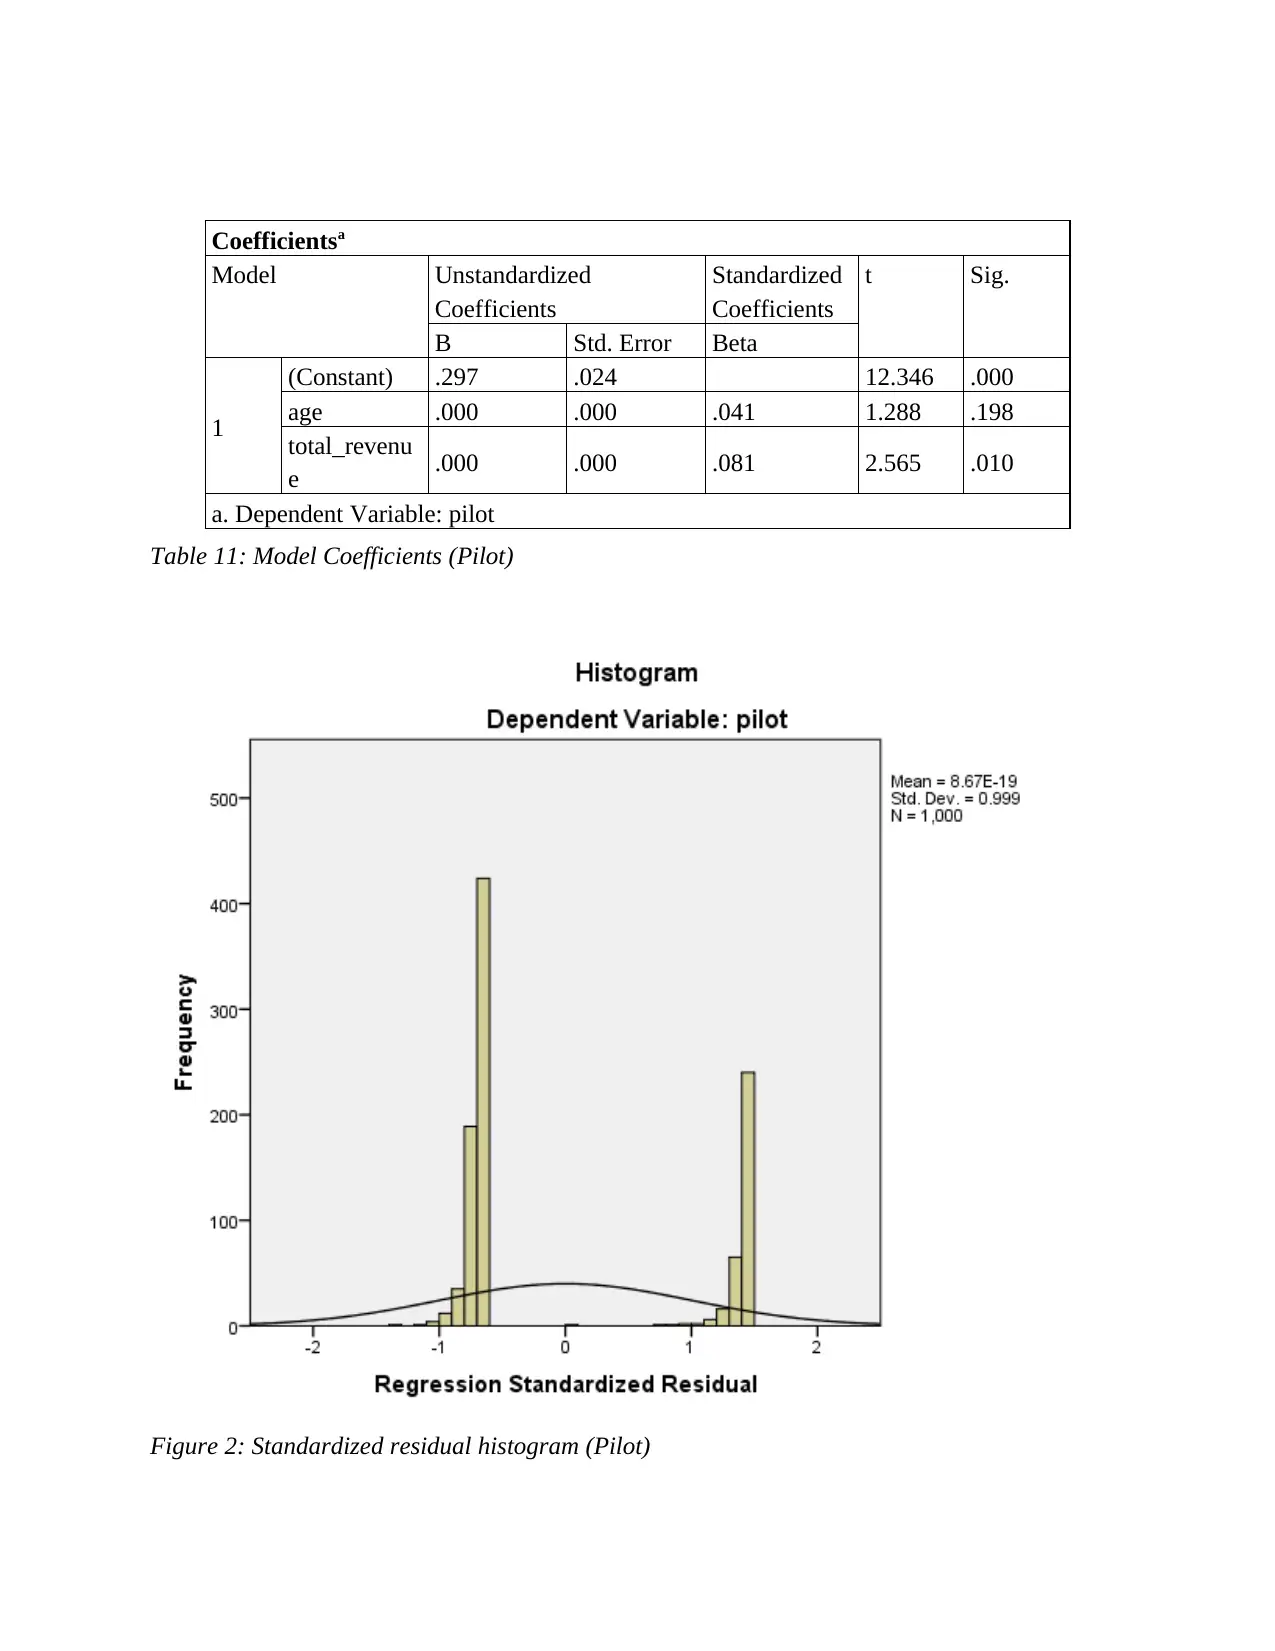
Coefficientsa
Model Unstandardized
Coefficients
Standardized
Coefficients
t Sig.
B Std. Error Beta
1
(Constant) .297 .024 12.346 .000
age .000 .000 .041 1.288 .198
total_revenu
e .000 .000 .081 2.565 .010
a. Dependent Variable: pilot
Table 11: Model Coefficients (Pilot)
Figure 2: Standardized residual histogram (Pilot)
Paraphrase This Document
Need a fresh take? Get an instant paraphrase of this document with our AI Paraphraser
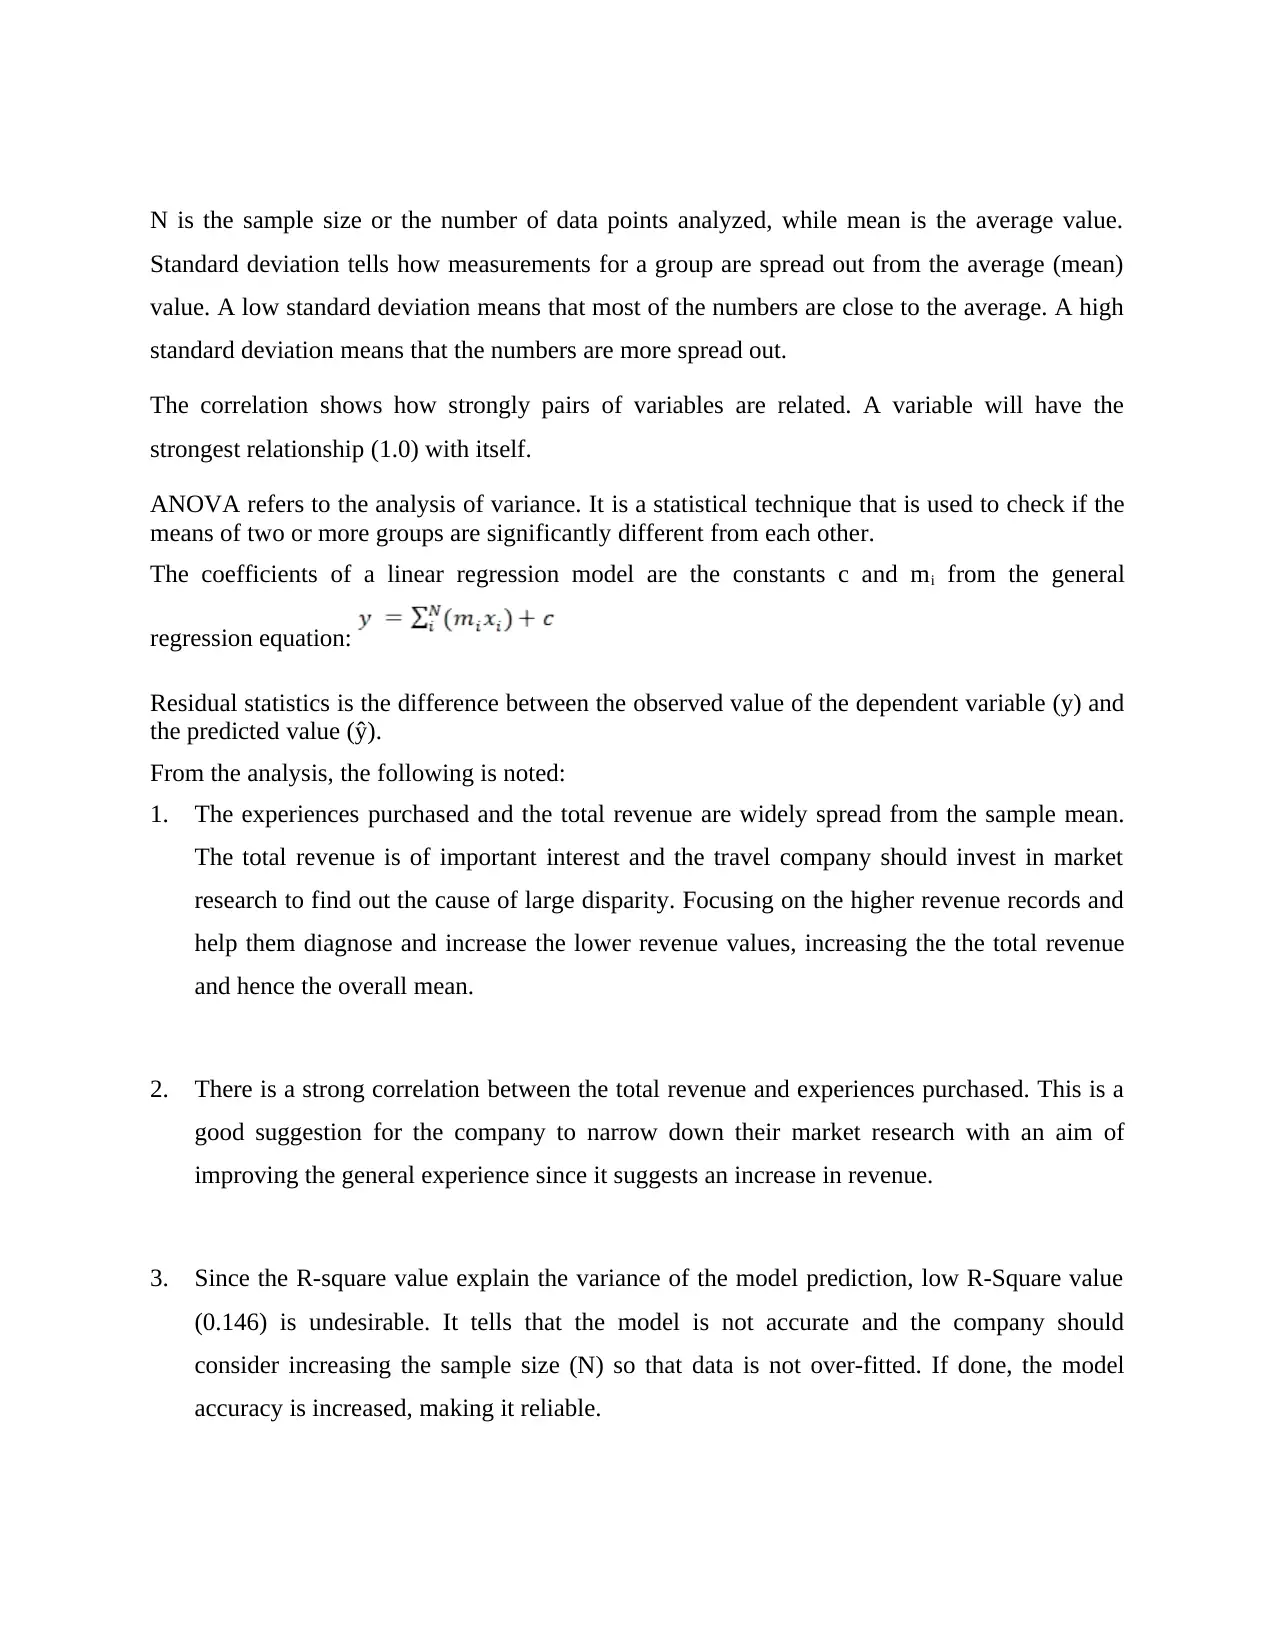
N is the sample size or the number of data points analyzed, while mean is the average value.
Standard deviation tells how measurements for a group are spread out from the average (mean)
value. A low standard deviation means that most of the numbers are close to the average. A high
standard deviation means that the numbers are more spread out.
The correlation shows how strongly pairs of variables are related. A variable will have the
strongest relationship (1.0) with itself.
ANOVA refers to the analysis of variance. It is a statistical technique that is used to check if the
means of two or more groups are significantly different from each other.
The coefficients of a linear regression model are the constants c and mi from the general
regression equation:
Residual statistics is the difference between the observed value of the dependent variable (y) and
the predicted value (ŷ).
From the analysis, the following is noted:
1. The experiences purchased and the total revenue are widely spread from the sample mean.
The total revenue is of important interest and the travel company should invest in market
research to find out the cause of large disparity. Focusing on the higher revenue records and
help them diagnose and increase the lower revenue values, increasing the the total revenue
and hence the overall mean.
2. There is a strong correlation between the total revenue and experiences purchased. This is a
good suggestion for the company to narrow down their market research with an aim of
improving the general experience since it suggests an increase in revenue.
3. Since the R-square value explain the variance of the model prediction, low R-Square value
(0.146) is undesirable. It tells that the model is not accurate and the company should
consider increasing the sample size (N) so that data is not over-fitted. If done, the model
accuracy is increased, making it reliable.
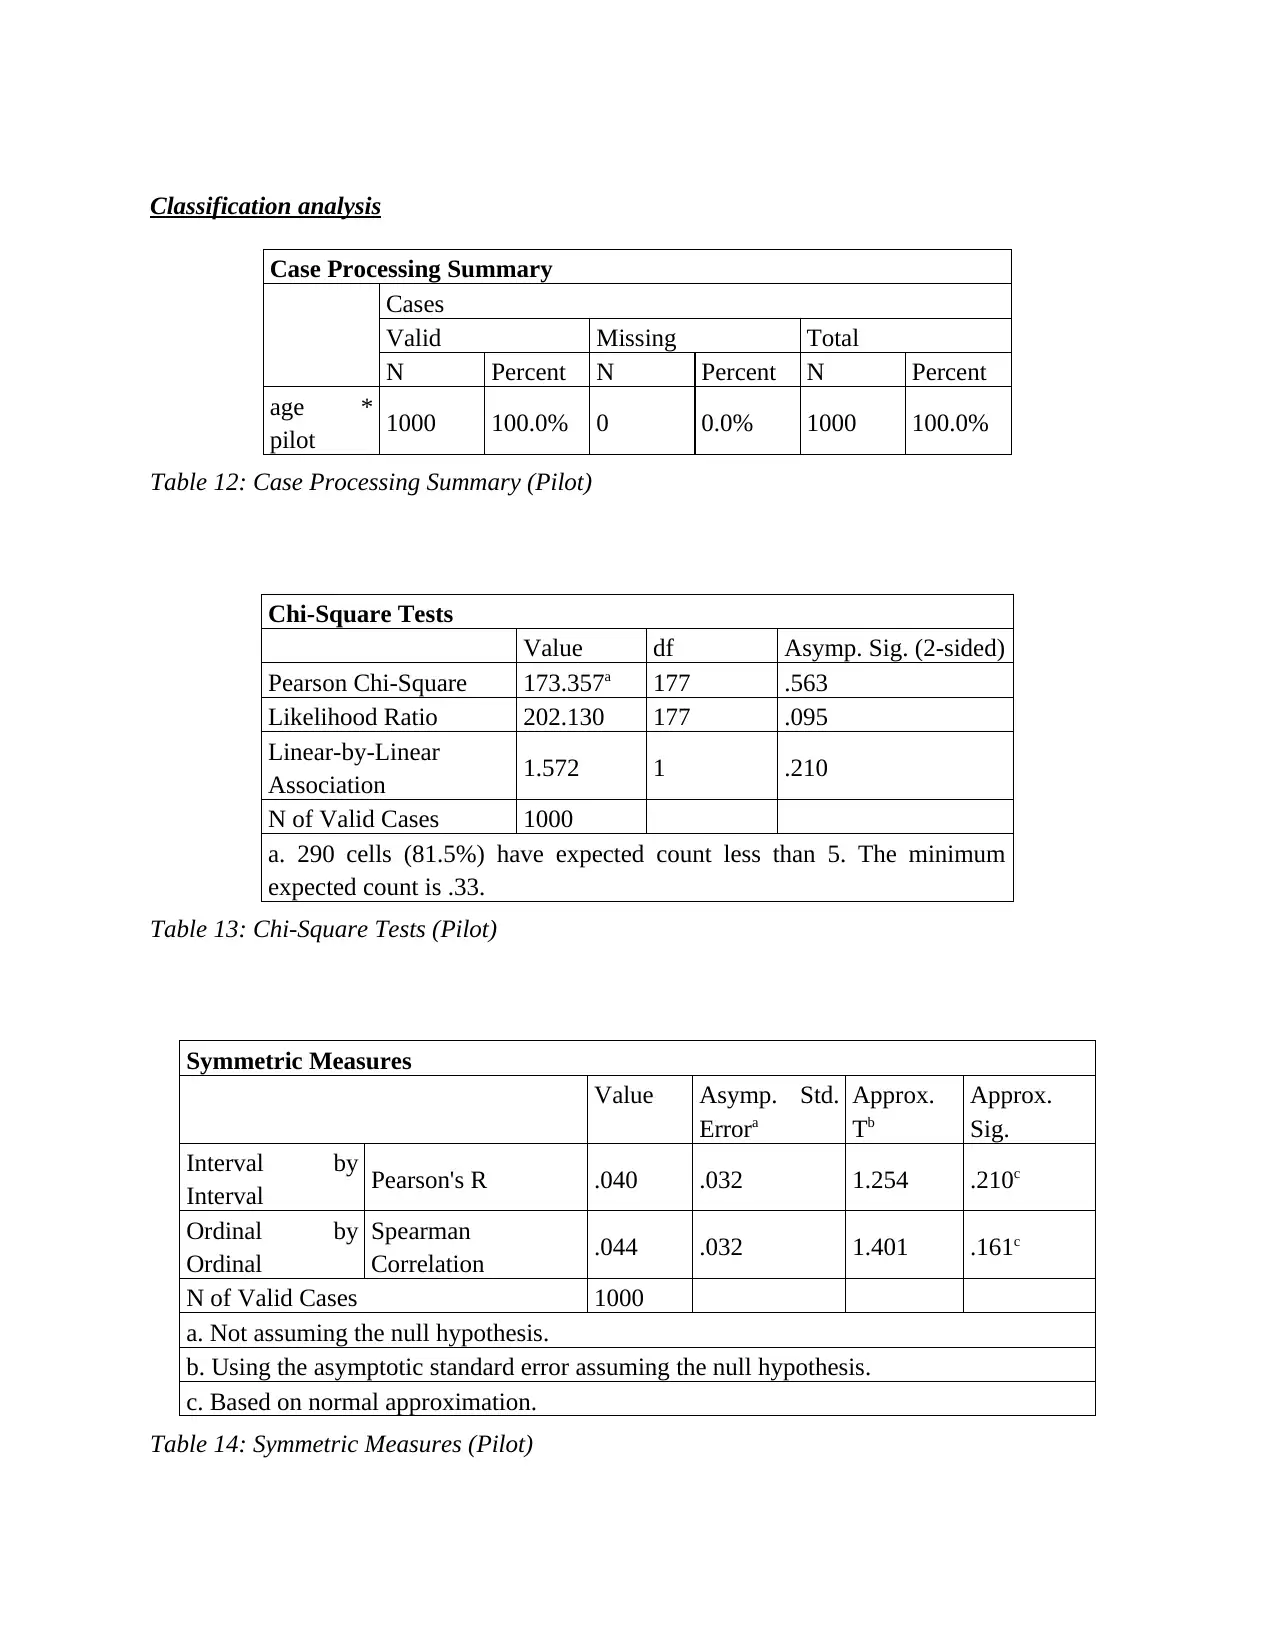
Classification analysis
Case Processing Summary
Cases
Valid Missing Total
N Percent N Percent N Percent
age *
pilot 1000 100.0% 0 0.0% 1000 100.0%
Table 12: Case Processing Summary (Pilot)
Chi-Square Tests
Value df Asymp. Sig. (2-sided)
Pearson Chi-Square 173.357a 177 .563
Likelihood Ratio 202.130 177 .095
Linear-by-Linear
Association 1.572 1 .210
N of Valid Cases 1000
a. 290 cells (81.5%) have expected count less than 5. The minimum
expected count is .33.
Table 13: Chi-Square Tests (Pilot)
Symmetric Measures
Value Asymp. Std.
Errora
Approx.
Tb
Approx.
Sig.
Interval by
Interval Pearson's R .040 .032 1.254 .210c
Ordinal by
Ordinal
Spearman
Correlation .044 .032 1.401 .161c
N of Valid Cases 1000
a. Not assuming the null hypothesis.
b. Using the asymptotic standard error assuming the null hypothesis.
c. Based on normal approximation.
Table 14: Symmetric Measures (Pilot)
⊘ This is a preview!⊘
Do you want full access?
Subscribe today to unlock all pages.
Trusted by 1+ million students worldwide
1 out of 21