Principles of Finance (FIN 601) Assignment: Ratio Analysis

Verified

Added on  2023/01/12

|7
|939
|32
Homework Assignment
AI Summary
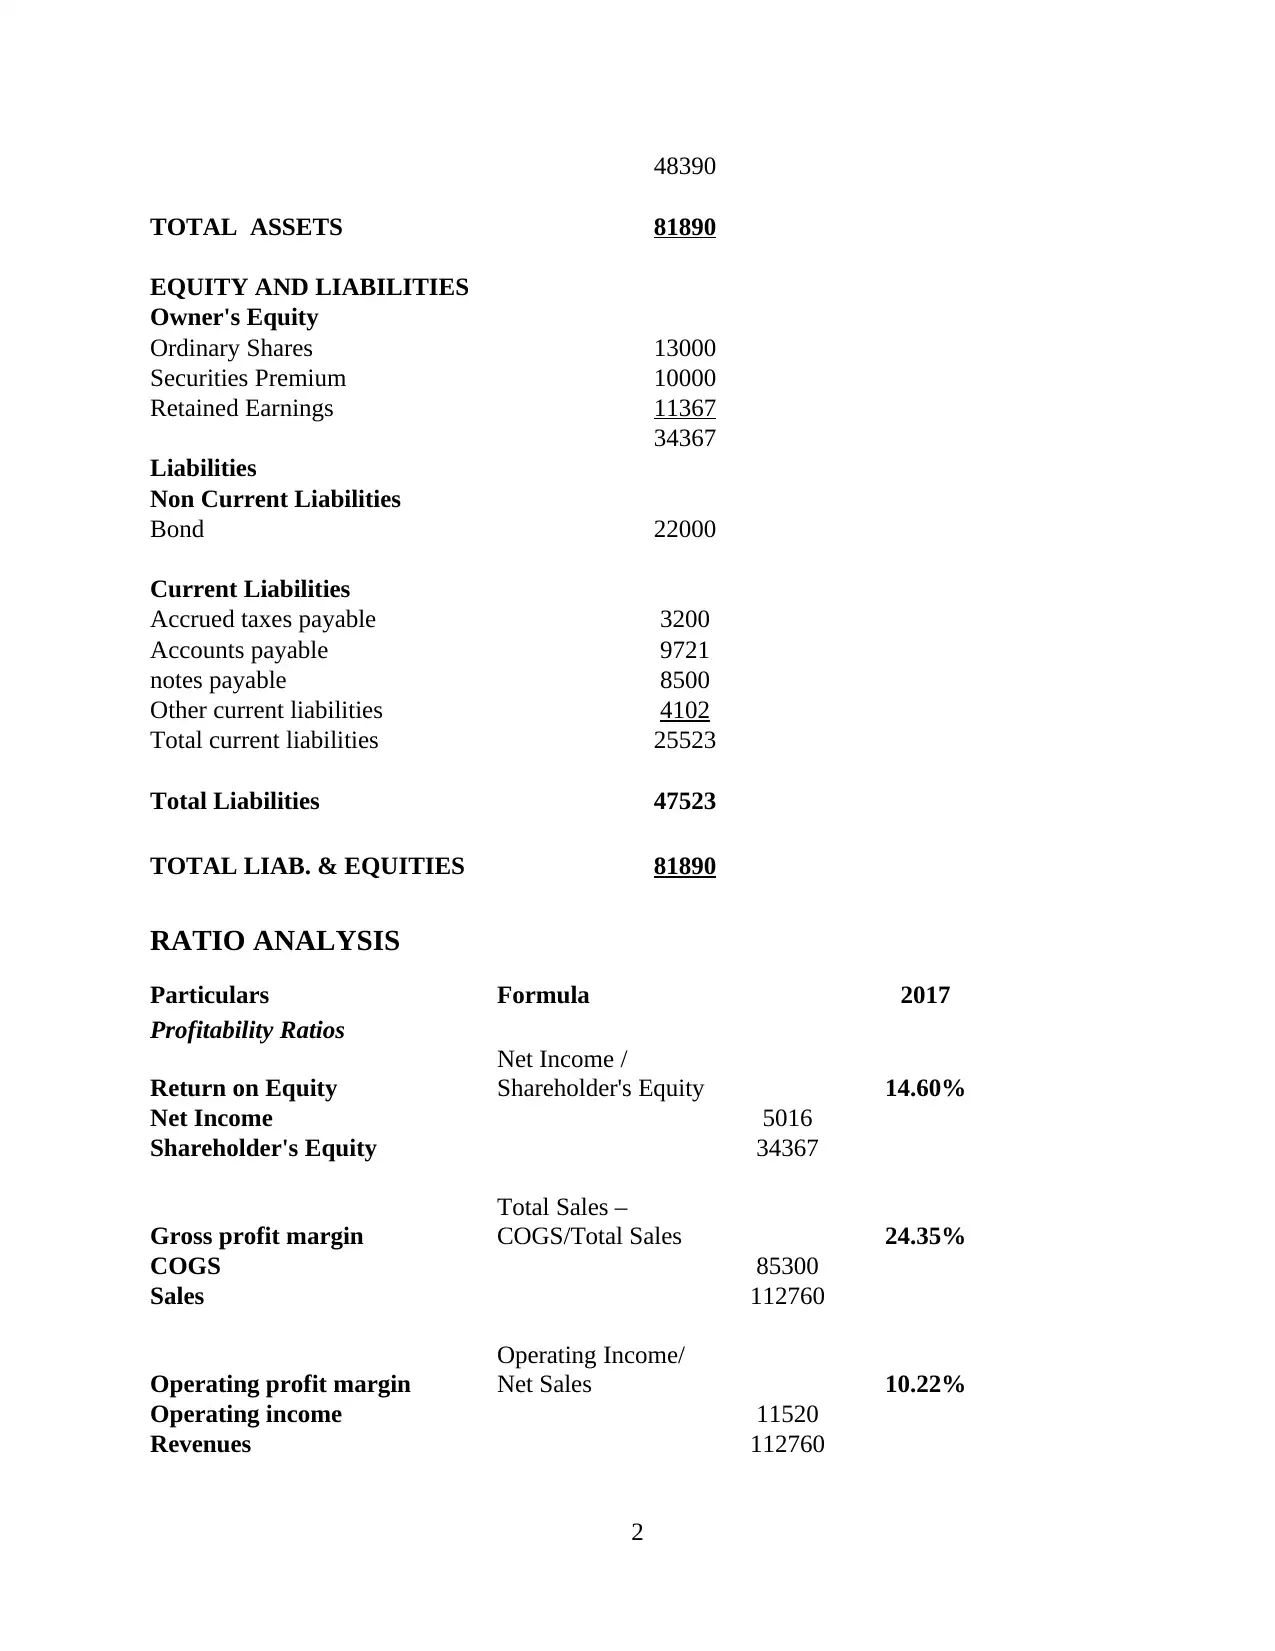
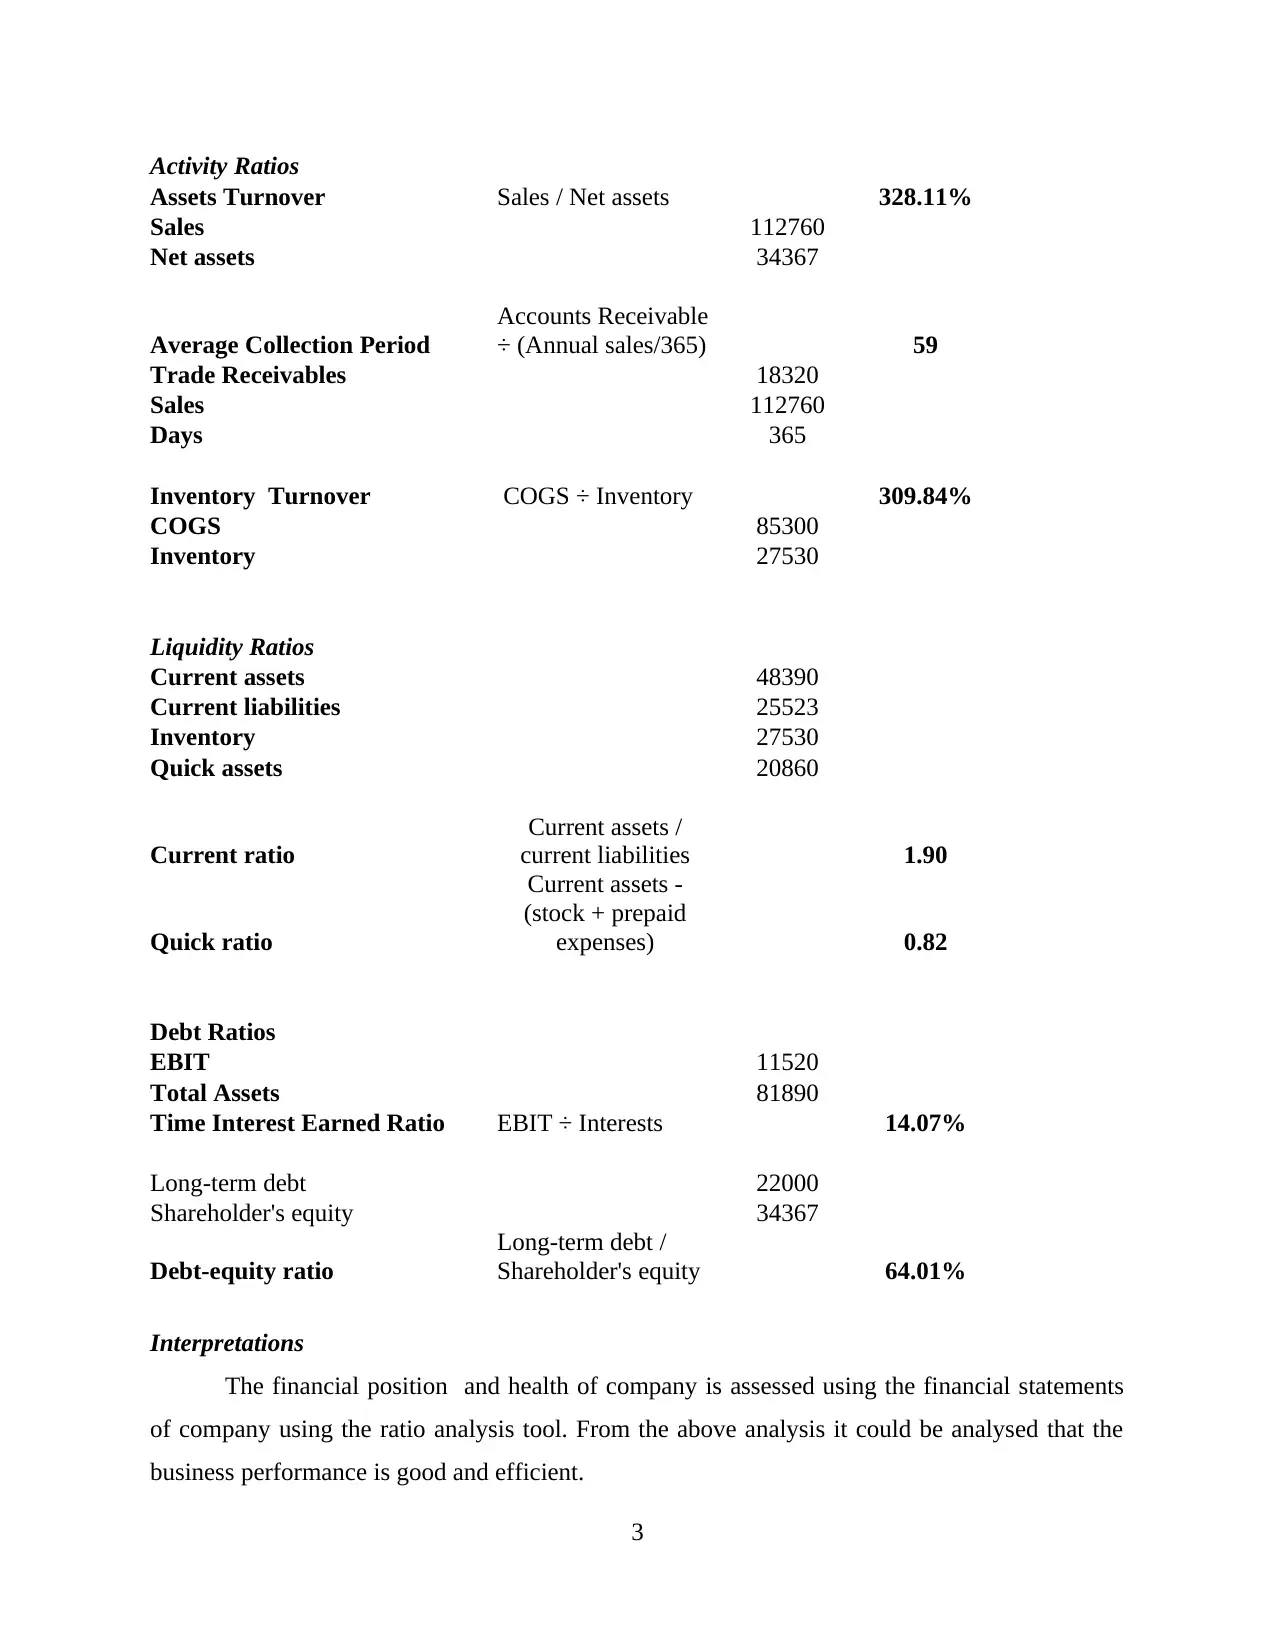
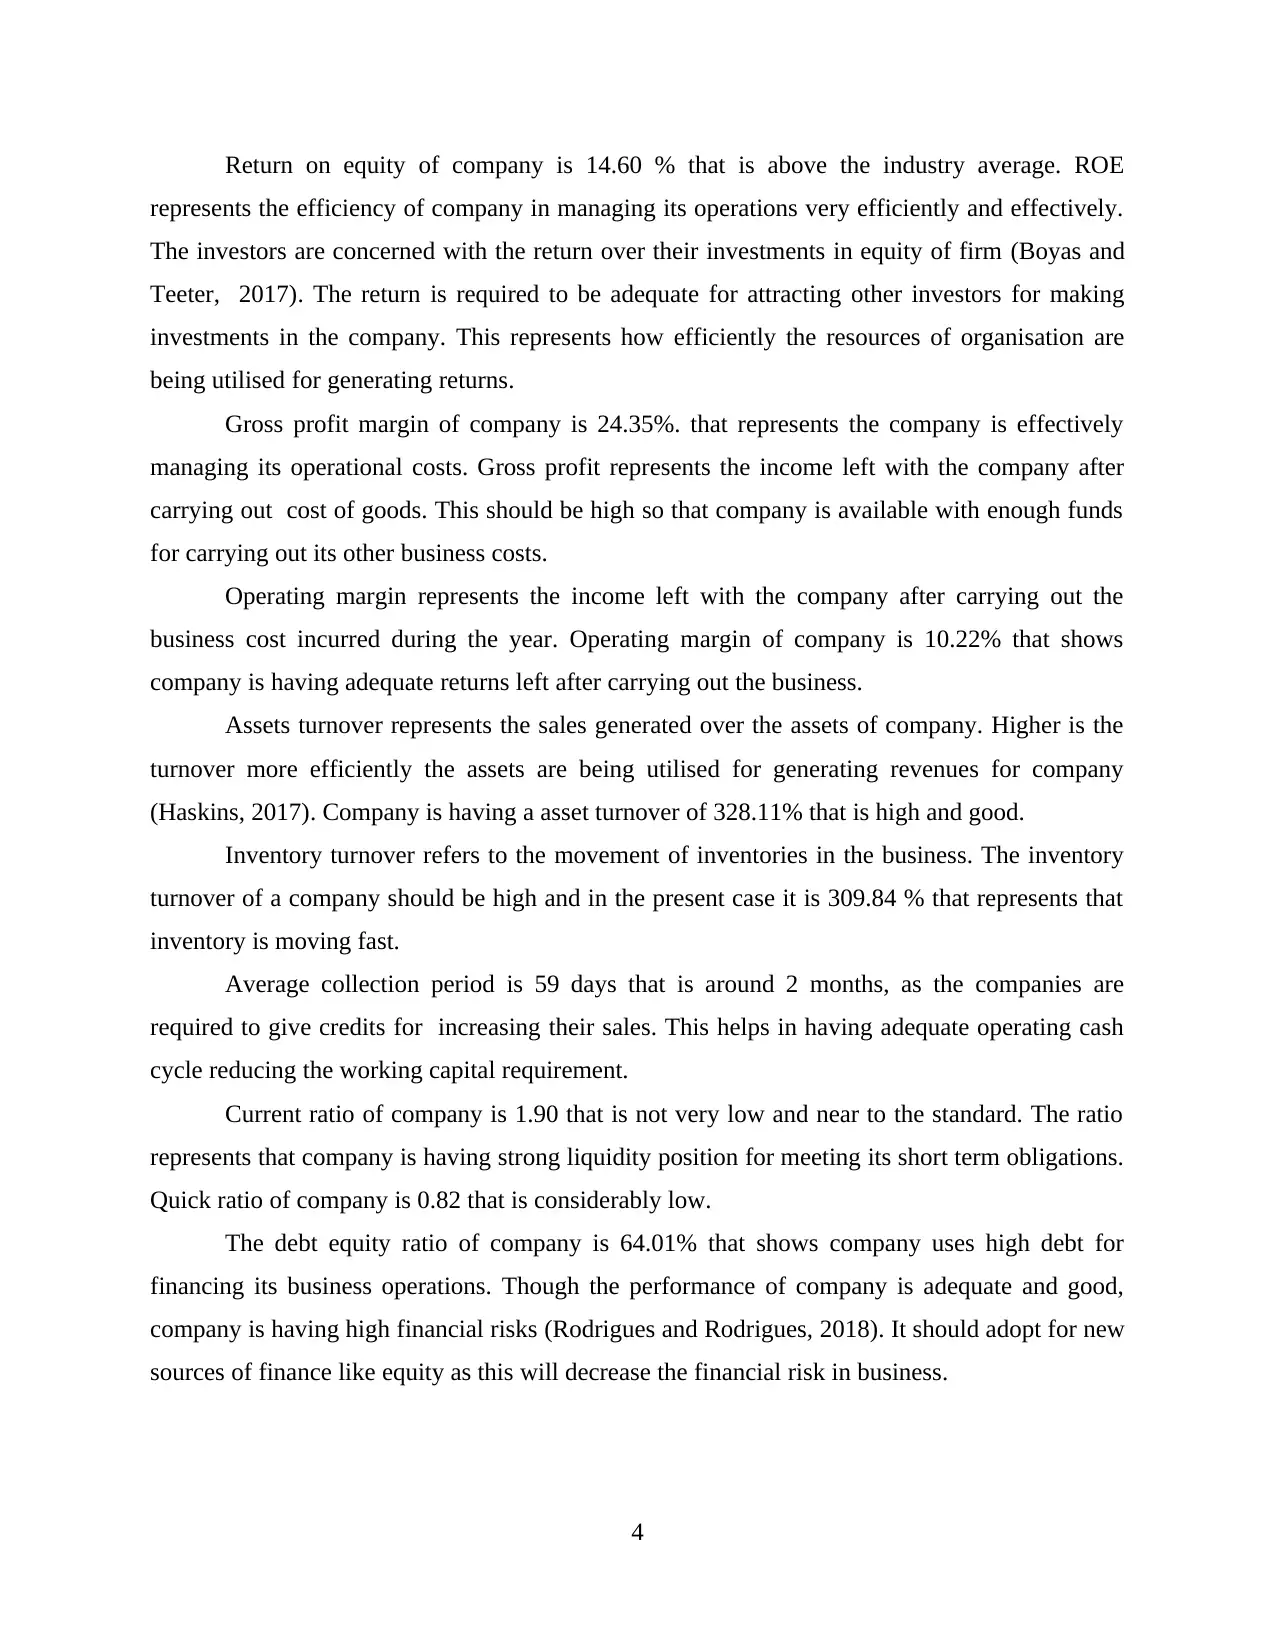
This finance assignment provides a comprehensive analysis of a company's financial performance using its income statement, balance sheet, and ratio analysis. The assignment begins with the preparation of an income statement, calculating key figures such as gross profit, operating profit, and net profit, along with earnings per share and dividends per share. Following this, a balance sheet is constructed to assess the company's assets, liabilities, and equity. The core of the assignment involves a detailed ratio analysis, covering profitability ratios (like Return on Equity and Gross Profit Margin), activity ratios (such as Asset Turnover and Inventory Turnover), liquidity ratios (Current Ratio and Quick Ratio), and debt ratios (Debt-Equity Ratio). The analysis includes the calculation of these ratios and their interpretations, offering insights into the company's financial health, efficiency, and risk profile. The analysis highlights the company's strengths, such as a good return on equity and efficient asset utilization, while also pointing out potential areas of concern, such as a high debt-equity ratio.
Document Page
PRINCIPLE OF FINANCE
tabler-icon-diamond-filled.svg

Paraphrase This Document

Need a fresh take? Get an instant paraphrase of this document with our AI Paraphraser
Document Page
TABLE OF CONTENTS
INCOME STATEMENT ................................................................................................................1
BALANCE SHEET.........................................................................................................................1
RATIO ANALYSIS.........................................................................................................................2
REFERENCES................................................................................................................................5
Document Page
INCOME STATEMENT
Income statement Income statement
Revenues
Sales revenue 112760
Cost of Goods Sold 85300
Gross Profit 27460
Operating Expenses:
Selling expense 6540
General & Administrative expenses 9400
Total Operating Expense 15940
Operating Profits (EBIT-Earnings before interest and
taxes) 11520
Interest expense:
Interest on bank notes: 850
Interest on bonds: 2310
Total Interest expenses 3160
Net Profit before taxes (EBT- Earnings before taxes) 8360
Taxes 3344
Net Profit after taxes (Net Income) 5016
Earnings per share 3.858
Dividends per share 2.154
Notes:
Shares outstanding (000) 1300
Dividends paid on common stock 2800
BALANCE SHEET
Balance Sheet as on June 30, 2014
ASSETS
Fixed Assets
Plant and equipment 31700
Market securities 1800
33500
Current Assets
Accounts receivables 18320
Cash at Bank 2540
Inventory 27530
1
Document Page
48390
TOTAL ASSETS 81890
EQUITY AND LIABILITIES
Owner's Equity
Ordinary Shares 13000
Securities Premium 10000
Retained Earnings 11367
34367
Liabilities
Non Current Liabilities
Bond 22000
Current Liabilities
Accrued taxes payable 3200
Accounts payable 9721
notes payable 8500
Other current liabilities 4102
Total current liabilities 25523
Total Liabilities 47523
TOTAL LIAB. & EQUITIES 81890
RATIO ANALYSIS
Particulars Formula 2017
Profitability Ratios
Return on Equity
Net Income /
Shareholder's Equity 14.60%
Net Income 5016
Shareholder's Equity 34367
Gross profit margin
Total Sales –
COGS/Total Sales 24.35%
COGS 85300
Sales 112760
Operating profit margin
Operating Income/
Net Sales 10.22%
Operating income 11520
Revenues 112760
2
tabler-icon-diamond-filled.svg

Paraphrase This Document

Need a fresh take? Get an instant paraphrase of this document with our AI Paraphraser
Document Page
Activity Ratios
Assets Turnover Sales / Net assets 328.11%
Sales 112760
Net assets 34367
Average Collection Period
Accounts Receivable
÷ (Annual sales/365) 59
Trade Receivables 18320
Sales 112760
Days 365
Inventory Turnover COGS ÷ Inventory 309.84%
COGS 85300
Inventory 27530
Liquidity Ratios
Current assets 48390
Current liabilities 25523
Inventory 27530
Quick assets 20860
Current ratio
Current assets /
current liabilities 1.90
Quick ratio
Current assets -
(stock + prepaid
expenses) 0.82
Debt Ratios
EBIT 11520
Total Assets 81890
Time Interest Earned Ratio EBIT ÷ Interests 14.07%
Long-term debt 22000
Shareholder's equity 34367
Debt-equity ratio
Long-term debt /
Shareholder's equity 64.01%
Interpretations
The financial position and health of company is assessed using the financial statements
of company using the ratio analysis tool. From the above analysis it could be analysed that the
business performance is good and efficient.
3
Document Page
Return on equity of company is 14.60 % that is above the industry average. ROE
represents the efficiency of company in managing its operations very efficiently and effectively.
The investors are concerned with the return over their investments in equity of firm (Boyas and
Teeter, 2017). The return is required to be adequate for attracting other investors for making
investments in the company. This represents how efficiently the resources of organisation are
being utilised for generating returns.
Gross profit margin of company is 24.35%. that represents the company is effectively
managing its operational costs. Gross profit represents the income left with the company after
carrying out cost of goods. This should be high so that company is available with enough funds
for carrying out its other business costs.
Operating margin represents the income left with the company after carrying out the
business cost incurred during the year. Operating margin of company is 10.22% that shows
company is having adequate returns left after carrying out the business.
Assets turnover represents the sales generated over the assets of company. Higher is the
turnover more efficiently the assets are being utilised for generating revenues for company
(Haskins, 2017). Company is having a asset turnover of 328.11% that is high and good.
Inventory turnover refers to the movement of inventories in the business. The inventory
turnover of a company should be high and in the present case it is 309.84 % that represents that
inventory is moving fast.
Average collection period is 59 days that is around 2 months, as the companies are
required to give credits for increasing their sales. This helps in having adequate operating cash
cycle reducing the working capital requirement.
Current ratio of company is 1.90 that is not very low and near to the standard. The ratio
represents that company is having strong liquidity position for meeting its short term obligations.
Quick ratio of company is 0.82 that is considerably low.
The debt equity ratio of company is 64.01% that shows company uses high debt for
financing its business operations. Though the performance of company is adequate and good,
company is having high financial risks (Rodrigues and Rodrigues, 2018). It should adopt for new
sources of finance like equity as this will decrease the financial risk in business.
4
Document Page
REFERENCES
Books and Journals
Boyas, E. and Teeter, R., 2017. Teaching Financial Ratio Analysis using XBRL.
In Developments in Business Simulation and Experiential Learning: Proceedings of the
Annual ABSEL conference (Vol. 44, No. 1).
Haskins, M.E., 2017. Remington, Inc.: Instant Insights for Financial Ratios. Darden Business
Publishing Cases.
Rodrigues, L. and Rodrigues, L., 2018. Economic-financial performance of the Brazilian
sugarcane energy industry: An empirical evaluation using financial ratio, cluster and
discriminant analysis. Biomass and bioenergy.108.pp.289-296.
5
chevron_up_icon
1 out of 7
circle_padding
hide_on_mobile
zoom_out_icon
[object Object]