Analyzing England & Wales Prison Population: Crime Factors Impact
VerifiedAdded on 2023/06/12
|12
|2436
|174
Report
AI Summary
This report examines the significant doubling of the prison population in England and Wales over two decades, attributing the increase to various factors influencing crime rates and subsequently placing immense pressure on the prison system. The analysis includes interpretations of bar charts illustrating public perceptions of safety, concerns about rape, music listening habits while walking alone, educational qualifications, levels of worry when walking in the dark, and problems associated with drug use. The findings suggest complex relationships between gender, marital status, perceived safety, and engagement in risky behaviors, alongside highlighting the varying degrees of concern regarding drug use within the population. Ultimately, the report concludes that rising crime rates, influenced by diverse societal elements, have contributed to the dramatic increase in prisoner numbers, posing substantial challenges to the penal system.
Contribute Materials
Your contribution can guide someone’s learning journey. Share your
documents today.

Assignment
Secure Best Marks with AI Grader
Need help grading? Try our AI Grader for instant feedback on your assignments.
Table of Contents
INTRODUCTION ..........................................................................................................................3
MAIN BODY...................................................................................................................................3
CONCLUSION ...............................................................................................................................9
REFERENCES..............................................................................................................................10
INTRODUCTION
A prison is an institution for the travail of people that have been help by the judicial
authority in their custody or the people that have been deprived of their own freedom because of
the conviction for a crime. An individual that have found guilty of the crime or felony might be
need to serve in a prison conviction. The retention of the guilty people who are awaiting trail
keeps an essential working of current prisons and in various nations such people make up the
majority of the population in the prison. For instance, in the England commonly about around
one fifth of the population in the prison are not sentenced yet as well as non guilty yet. The
following essay will cover about the prison population which has been doubled in England as
well as Wales from around 40000 to more than 80000 in two decades. So, it will cover about the
factors of increasing crime rate as well as pressures it has given the prison system.
MAIN BODY
Bar chart 1 - Feeling of worry about being raped based on gender:
m ale fem ale
0 .0 0 %
1 0 .0 0 %
2 0 .0 0 %
3 0 .0 0 %
4 0 .0 0 %
5 0 .0 0 %
6 0 .0 0 %
7 0 .0 0 %
8 0 .0 0 %
F e e lin g o f w o rry a b o u t b e in g ra p e d b a s e d o n g e n d e r
Very w orried
F airly w orried
Not v ery w orried
Not at all w orried
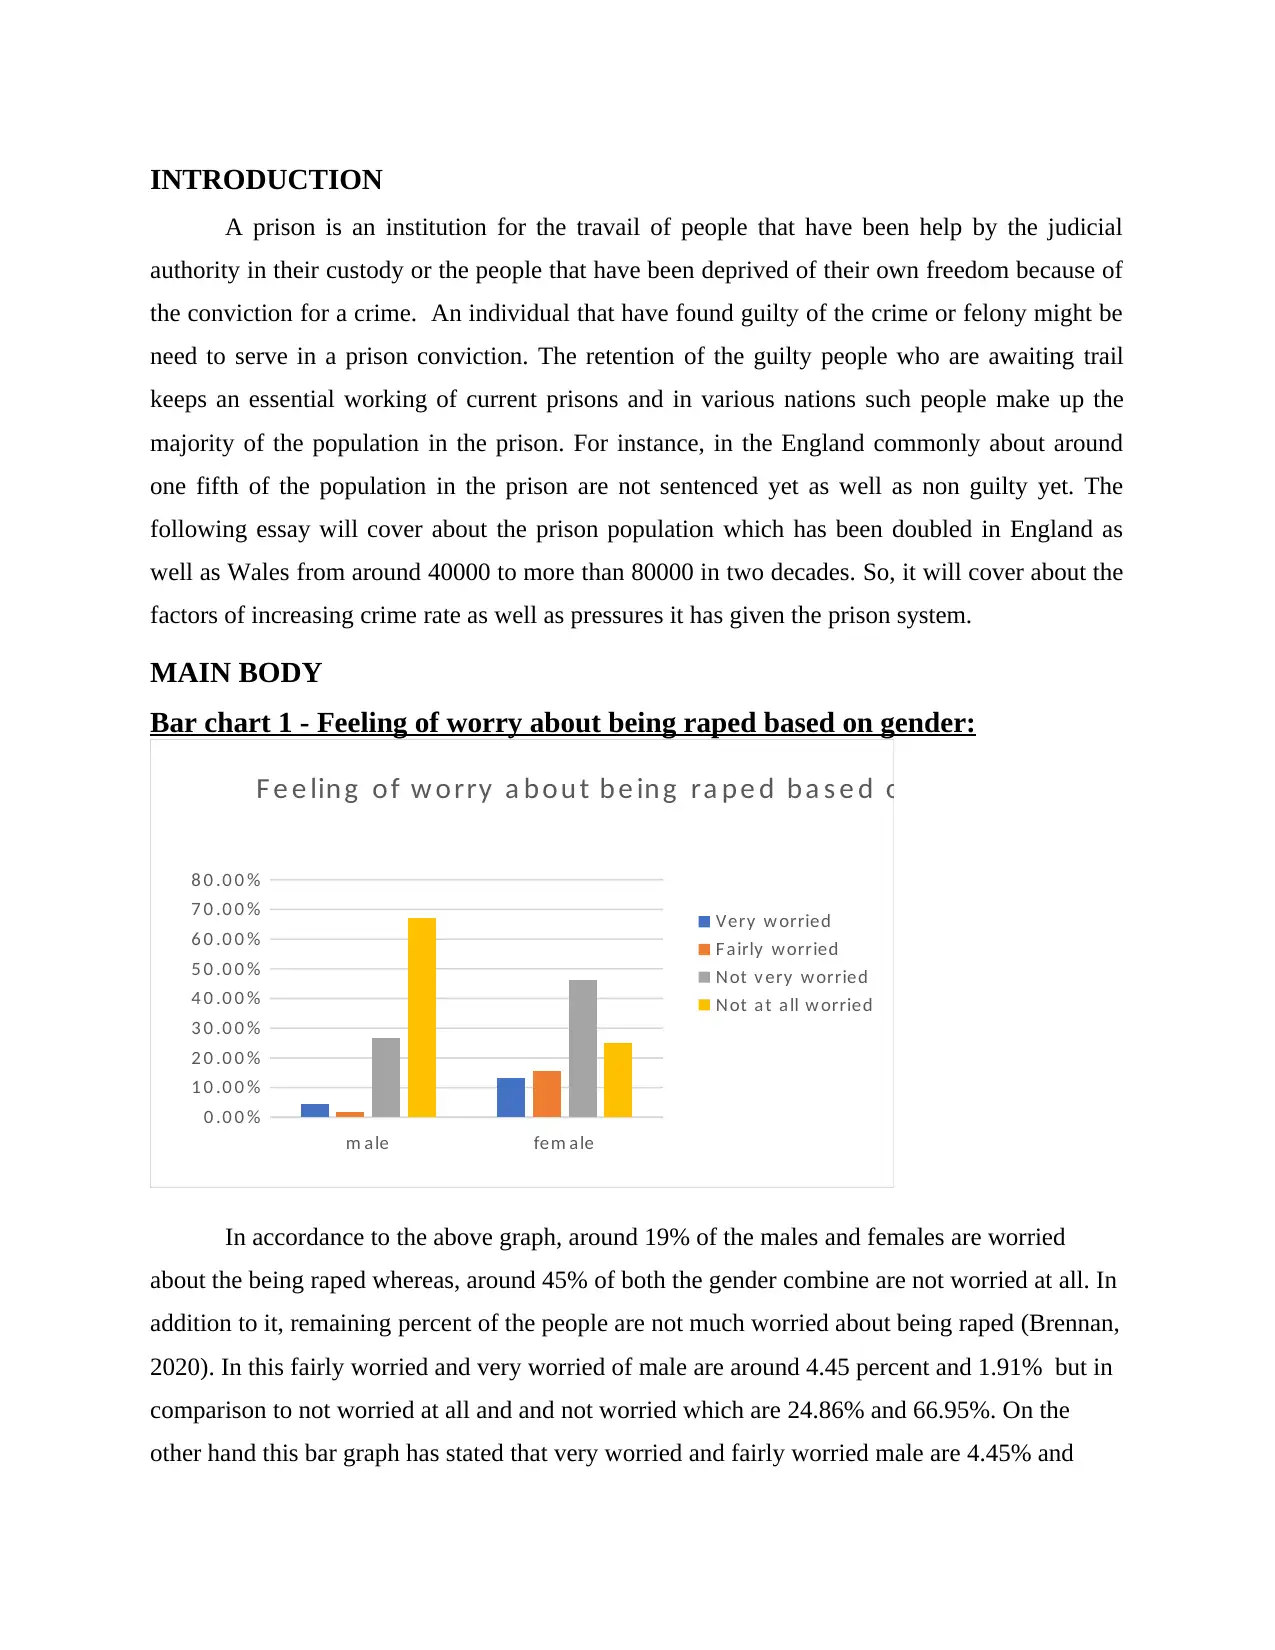
In accordance to the above graph, around 19% of the males and females are worried
about the being raped whereas, around 45% of both the gender combine are not worried at all. In
addition to it, remaining percent of the people are not much worried about being raped (Brennan,
2020). In this fairly worried and very worried of male are around 4.45 percent and 1.91% but in
comparison to not worried at all and and not worried which are 24.86% and 66.95%. On the
other hand this bar graph has stated that very worried and fairly worried male are 4.45% and
A prison is an institution for the travail of people that have been help by the judicial
authority in their custody or the people that have been deprived of their own freedom because of
the conviction for a crime. An individual that have found guilty of the crime or felony might be
need to serve in a prison conviction. The retention of the guilty people who are awaiting trail
keeps an essential working of current prisons and in various nations such people make up the
majority of the population in the prison. For instance, in the England commonly about around
one fifth of the population in the prison are not sentenced yet as well as non guilty yet. The
following essay will cover about the prison population which has been doubled in England as
well as Wales from around 40000 to more than 80000 in two decades. So, it will cover about the
factors of increasing crime rate as well as pressures it has given the prison system.
MAIN BODY
Bar chart 1 - Feeling of worry about being raped based on gender:
m ale fem ale
0 .0 0 %
1 0 .0 0 %
2 0 .0 0 %
3 0 .0 0 %
4 0 .0 0 %
5 0 .0 0 %
6 0 .0 0 %
7 0 .0 0 %
8 0 .0 0 %
F e e lin g o f w o rry a b o u t b e in g ra p e d b a s e d o n g e n d e r
Very w orried
F airly w orried
Not v ery w orried
Not at all w orried
In accordance to the above graph, around 19% of the males and females are worried
about the being raped whereas, around 45% of both the gender combine are not worried at all. In
addition to it, remaining percent of the people are not much worried about being raped (Brennan,
2020). In this fairly worried and very worried of male are around 4.45 percent and 1.91% but in
comparison to not worried at all and and not worried which are 24.86% and 66.95%. On the
other hand this bar graph has stated that very worried and fairly worried male are 4.45% and
1.91% respectively. Moreover to this, in comparison to the male, female are 13.08% and 15.70%
very and fairy worried. Additionally, females are not worried and not worried at all are 46.36%
and 24.86%. Therefore, the above graphs shows that majority of the people either not very
worried and not at all worried about being based on the gender base.
Bar chart 2 - Feeling of safety when walking alone after dark based on marital
status :
Married /c iv il p artn ered
S ep arated
0 .0 0 %
1 0 .0 0 %
2 0 .0 0 %
3 0 .0 0 %
4 0 .0 0 %
5 0 .0 0 %
6 0 .0 0 %
F e e lin g o f s a fe ty w h e n w a lk in g a lo n e in th e d a rk b a s e d o n m a rita l s ta tu
Very s afe
F airly safe
A b it u n s afe
Very u n s afe
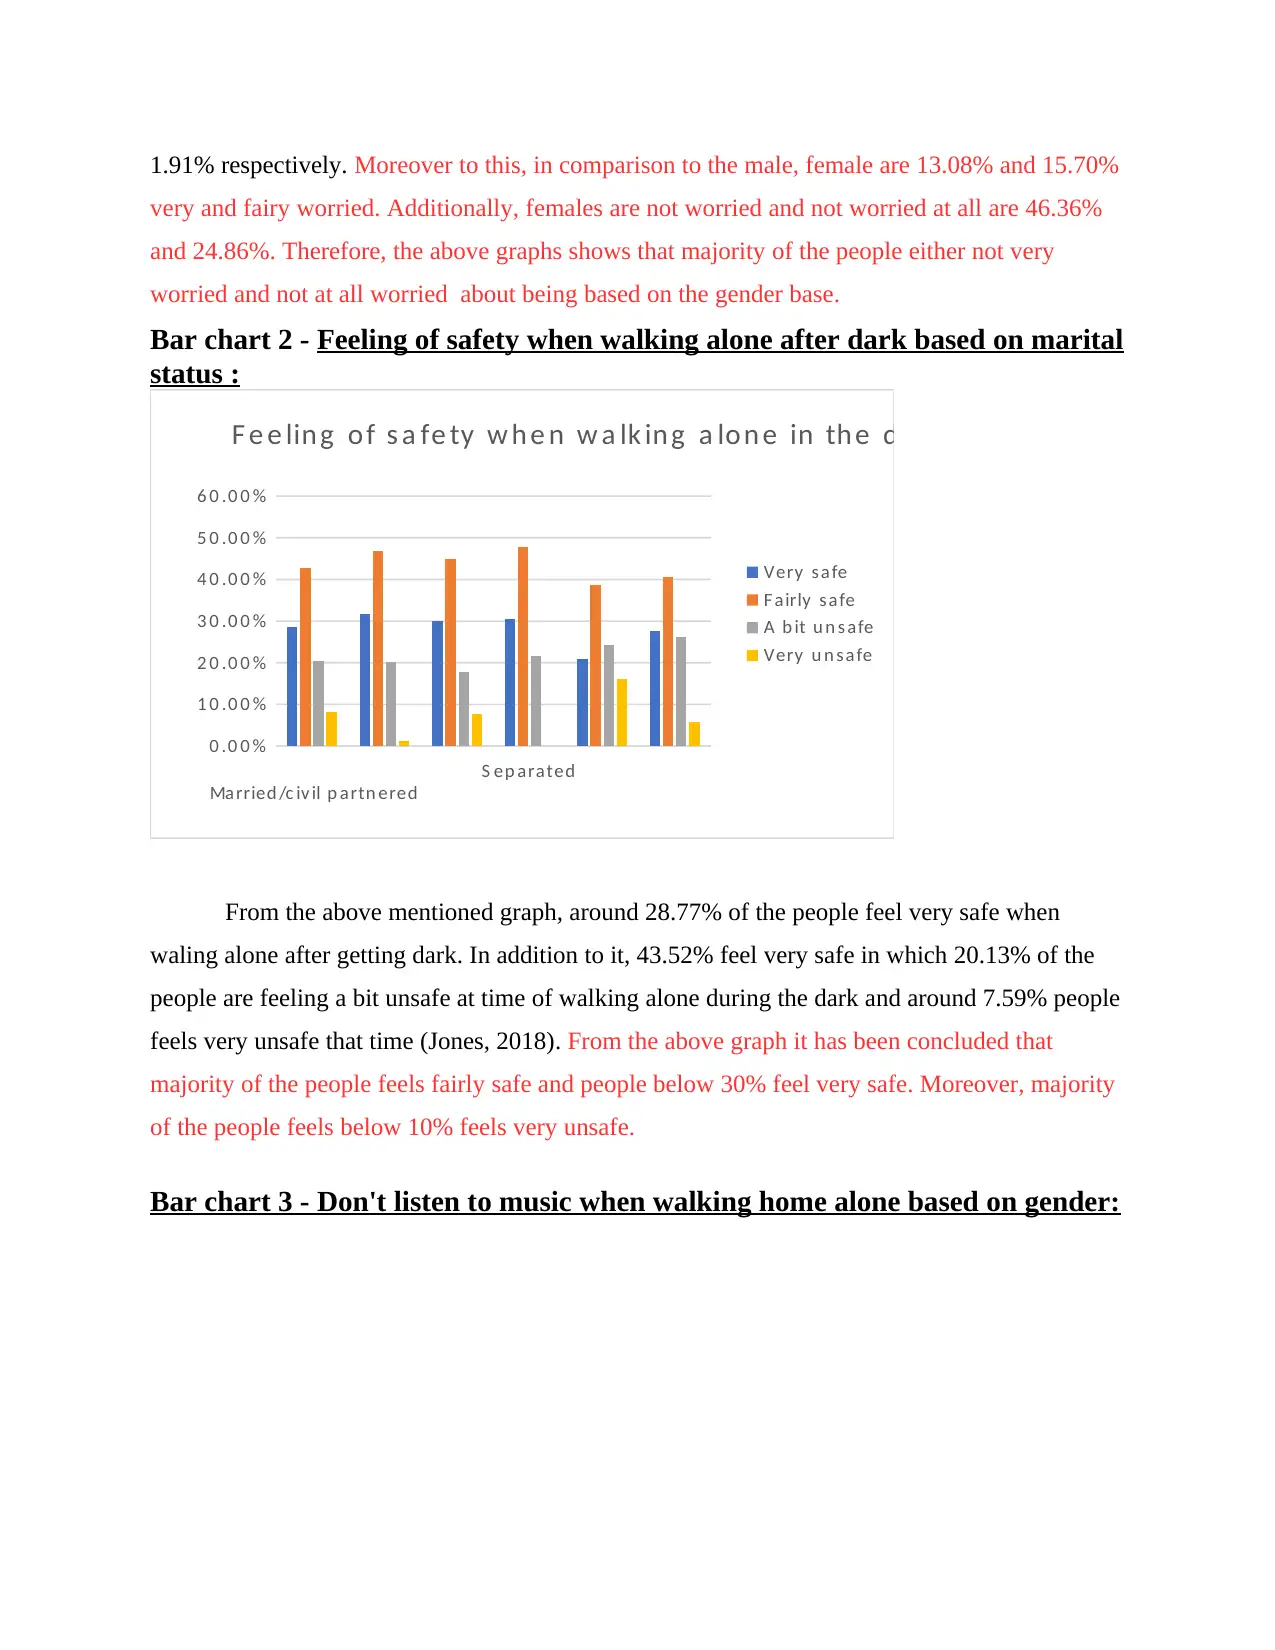
From the above mentioned graph, around 28.77% of the people feel very safe when
waling alone after getting dark. In addition to it, 43.52% feel very safe in which 20.13% of the
people are feeling a bit unsafe at time of walking alone during the dark and around 7.59% people
feels very unsafe that time (Jones, 2018). From the above graph it has been concluded that
majority of the people feels fairly safe and people below 30% feel very safe. Moreover, majority
of the people feels below 10% feels very unsafe.
Bar chart 3 - Don't listen to music when walking home alone based on gender:
very and fairy worried. Additionally, females are not worried and not worried at all are 46.36%
and 24.86%. Therefore, the above graphs shows that majority of the people either not very
worried and not at all worried about being based on the gender base.
Bar chart 2 - Feeling of safety when walking alone after dark based on marital
status :
Married /c iv il p artn ered
S ep arated
0 .0 0 %
1 0 .0 0 %
2 0 .0 0 %
3 0 .0 0 %
4 0 .0 0 %
5 0 .0 0 %
6 0 .0 0 %
F e e lin g o f s a fe ty w h e n w a lk in g a lo n e in th e d a rk b a s e d o n m a rita l s ta tu
Very s afe
F airly safe
A b it u n s afe
Very u n s afe
From the above mentioned graph, around 28.77% of the people feel very safe when
waling alone after getting dark. In addition to it, 43.52% feel very safe in which 20.13% of the
people are feeling a bit unsafe at time of walking alone during the dark and around 7.59% people
feels very unsafe that time (Jones, 2018). From the above graph it has been concluded that
majority of the people feels fairly safe and people below 30% feel very safe. Moreover, majority
of the people feels below 10% feels very unsafe.
Bar chart 3 - Don't listen to music when walking home alone based on gender:
Secure Best Marks with AI Grader
Need help grading? Try our AI Grader for instant feedback on your assignments.
m ale fem ale
0 .0 0 %
1 0 .0 0 %
2 0 .0 0 %
3 0 .0 0 %
4 0 .0 0 %
5 0 .0 0 %
6 0 .0 0 %
7 0 .0 0 %
8 0 .0 0 %
D o n 't lis te n to m u s ic w h e n w a lk in g h o m e a lo n e b a s e d o n g e n d e r
n o
y es
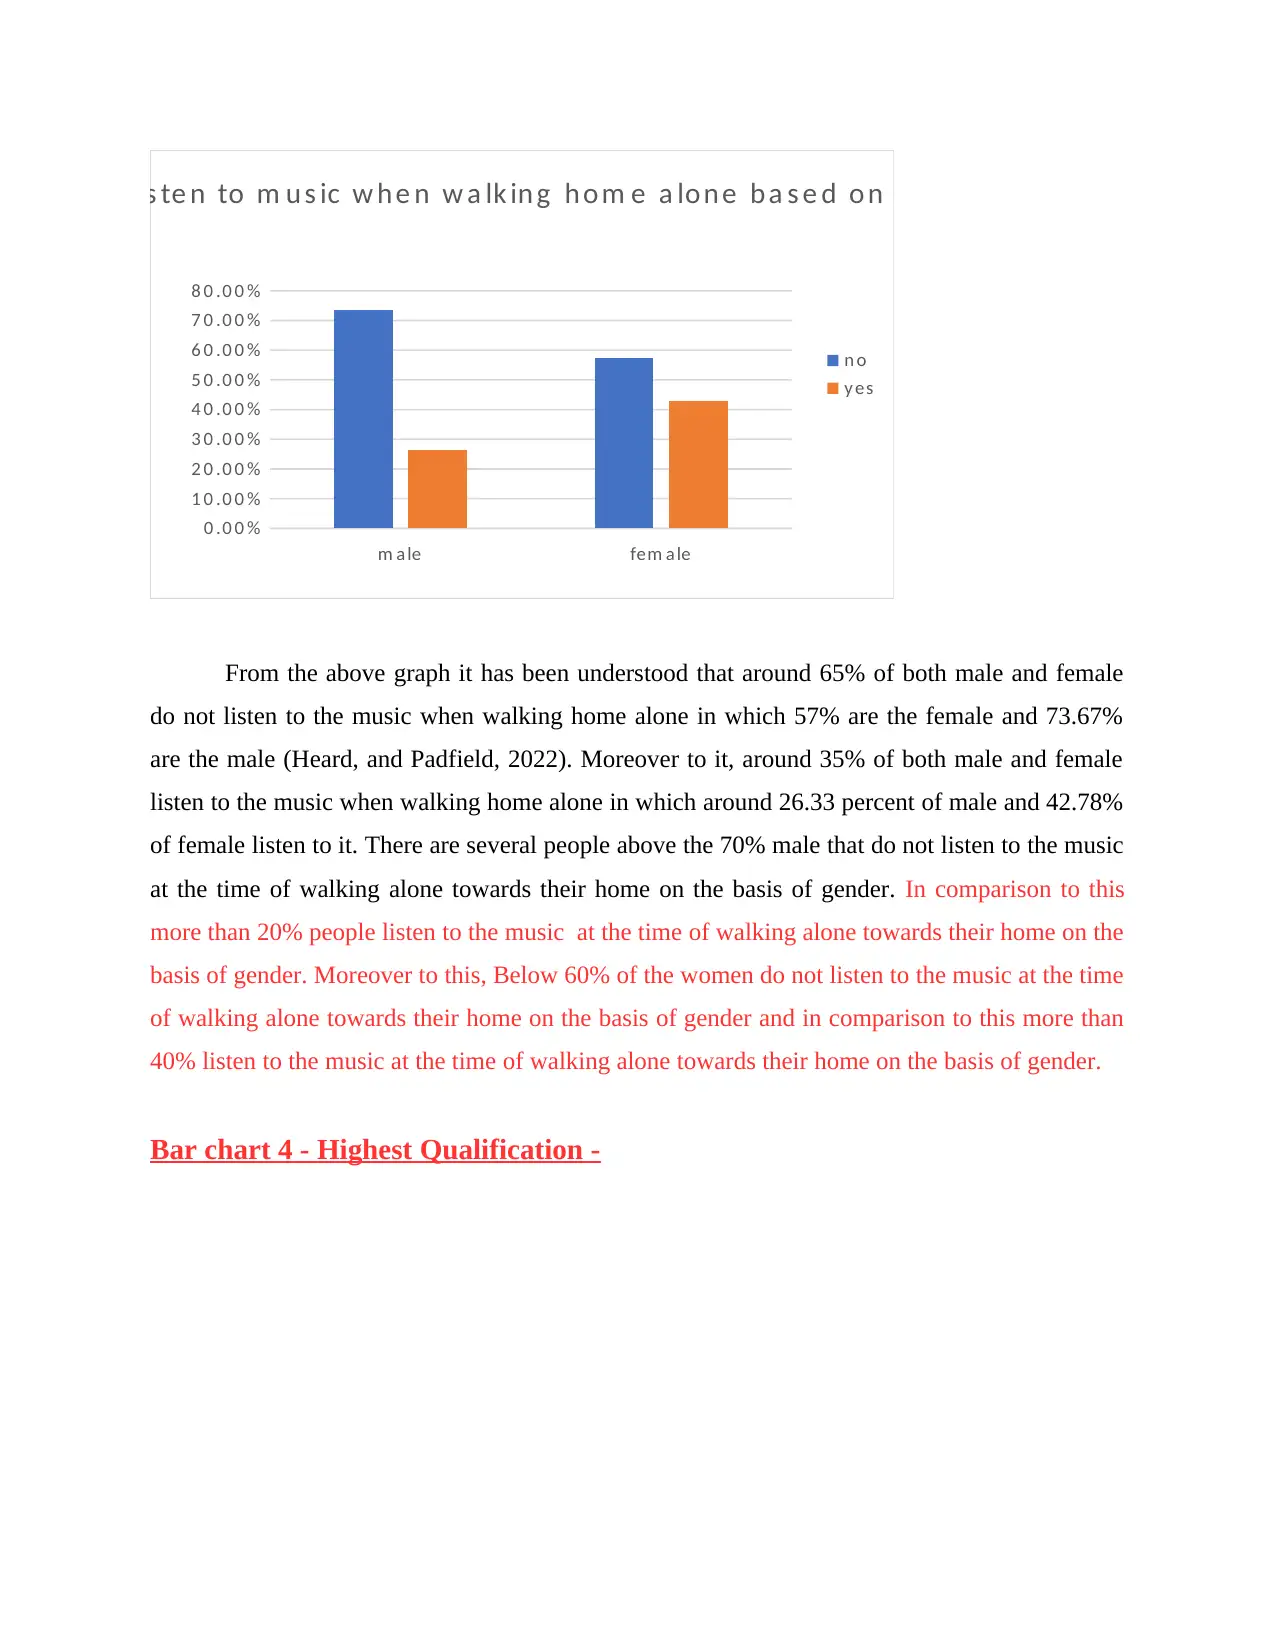
From the above graph it has been understood that around 65% of both male and female
do not listen to the music when walking home alone in which 57% are the female and 73.67%
are the male (Heard, and Padfield, 2022). Moreover to it, around 35% of both male and female
listen to the music when walking home alone in which around 26.33 percent of male and 42.78%
of female listen to it. There are several people above the 70% male that do not listen to the music
at the time of walking alone towards their home on the basis of gender. In comparison to this
more than 20% people listen to the music at the time of walking alone towards their home on the
basis of gender. Moreover to this, Below 60% of the women do not listen to the music at the time
of walking alone towards their home on the basis of gender and in comparison to this more than
40% listen to the music at the time of walking alone towards their home on the basis of gender.
Bar chart 4 - Highest Qualification -
0 .0 0 %
1 0 .0 0 %
2 0 .0 0 %
3 0 .0 0 %
4 0 .0 0 %
5 0 .0 0 %
6 0 .0 0 %
7 0 .0 0 %
8 0 .0 0 %
D o n 't lis te n to m u s ic w h e n w a lk in g h o m e a lo n e b a s e d o n g e n d e r
n o
y es
From the above graph it has been understood that around 65% of both male and female
do not listen to the music when walking home alone in which 57% are the female and 73.67%
are the male (Heard, and Padfield, 2022). Moreover to it, around 35% of both male and female
listen to the music when walking home alone in which around 26.33 percent of male and 42.78%
of female listen to it. There are several people above the 70% male that do not listen to the music
at the time of walking alone towards their home on the basis of gender. In comparison to this
more than 20% people listen to the music at the time of walking alone towards their home on the
basis of gender. Moreover to this, Below 60% of the women do not listen to the music at the time
of walking alone towards their home on the basis of gender and in comparison to this more than
40% listen to the music at the time of walking alone towards their home on the basis of gender.
Bar chart 4 - Highest Qualification -
H ig h er d eg ree etc .
F irs t d eg ree etc .
D ip lom as etc .
A/AS lev els etc .
Trad e Ap p ren tic es h ip s
O L ev el/G C S E g rad es A-C
O L ev el/G C S E g rad es D -G
Oth er q u alific ati on s ( in c lu d in g ov ers ea s)
0 .0 0 % 2 0 .0 0 % 4 0 .0 0 %
H ig h e s t
Q u a lifi c a tio n
Total
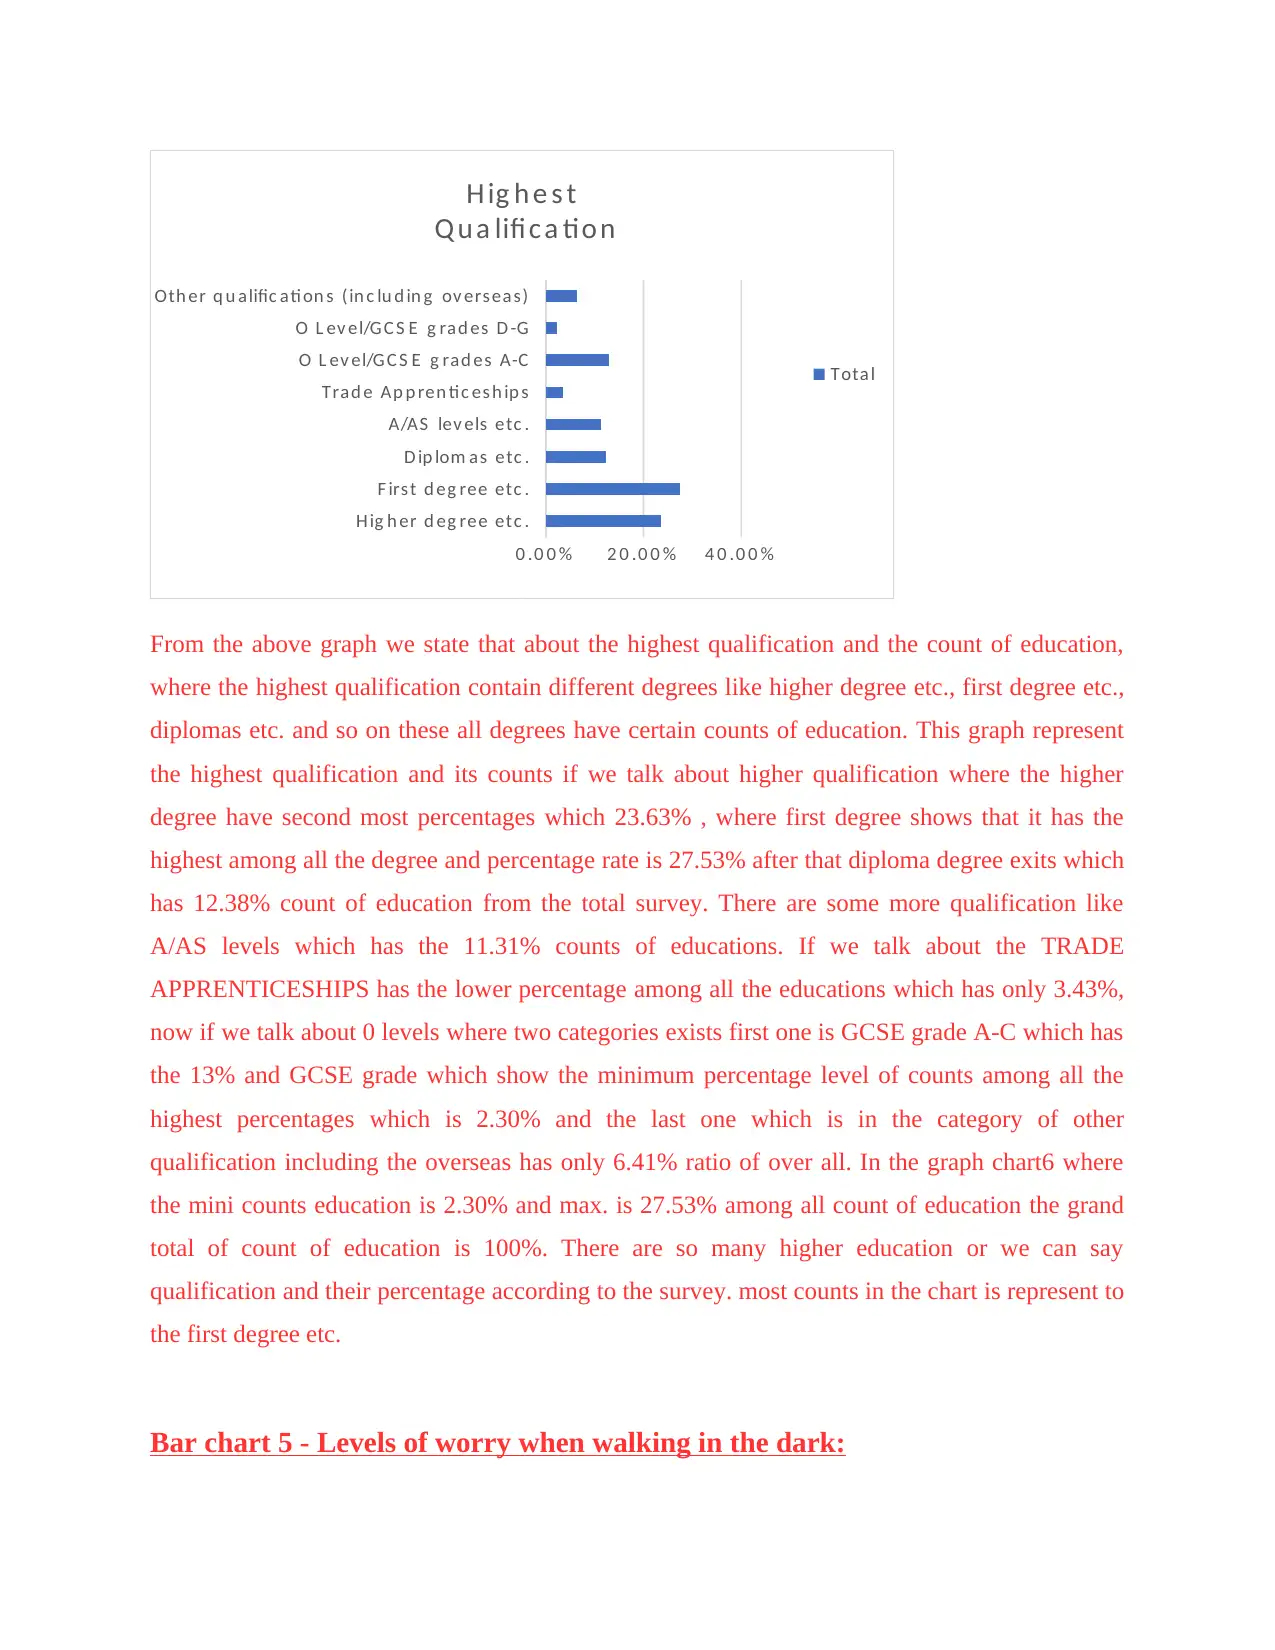
From the above graph we state that about the highest qualification and the count of education,
where the highest qualification contain different degrees like higher degree etc., first degree etc.,
diplomas etc. and so on these all degrees have certain counts of education. This graph represent
the highest qualification and its counts if we talk about higher qualification where the higher
degree have second most percentages which 23.63% , where first degree shows that it has the
highest among all the degree and percentage rate is 27.53% after that diploma degree exits which
has 12.38% count of education from the total survey. There are some more qualification like
A/AS levels which has the 11.31% counts of educations. If we talk about the TRADE
APPRENTICESHIPS has the lower percentage among all the educations which has only 3.43%,
now if we talk about 0 levels where two categories exists first one is GCSE grade A-C which has
the 13% and GCSE grade which show the minimum percentage level of counts among all the
highest percentages which is 2.30% and the last one which is in the category of other
qualification including the overseas has only 6.41% ratio of over all. In the graph chart6 where
the mini counts education is 2.30% and max. is 27.53% among all count of education the grand
total of count of education is 100%. There are so many higher education or we can say
qualification and their percentage according to the survey. most counts in the chart is represent to
the first degree etc.
Bar chart 5 - Levels of worry when walking in the dark:
F irs t d eg ree etc .
D ip lom as etc .
A/AS lev els etc .
Trad e Ap p ren tic es h ip s
O L ev el/G C S E g rad es A-C
O L ev el/G C S E g rad es D -G
Oth er q u alific ati on s ( in c lu d in g ov ers ea s)
0 .0 0 % 2 0 .0 0 % 4 0 .0 0 %
H ig h e s t
Q u a lifi c a tio n
Total
From the above graph we state that about the highest qualification and the count of education,
where the highest qualification contain different degrees like higher degree etc., first degree etc.,
diplomas etc. and so on these all degrees have certain counts of education. This graph represent
the highest qualification and its counts if we talk about higher qualification where the higher
degree have second most percentages which 23.63% , where first degree shows that it has the
highest among all the degree and percentage rate is 27.53% after that diploma degree exits which
has 12.38% count of education from the total survey. There are some more qualification like
A/AS levels which has the 11.31% counts of educations. If we talk about the TRADE
APPRENTICESHIPS has the lower percentage among all the educations which has only 3.43%,
now if we talk about 0 levels where two categories exists first one is GCSE grade A-C which has
the 13% and GCSE grade which show the minimum percentage level of counts among all the
highest percentages which is 2.30% and the last one which is in the category of other
qualification including the overseas has only 6.41% ratio of over all. In the graph chart6 where
the mini counts education is 2.30% and max. is 27.53% among all count of education the grand
total of count of education is 100%. There are so many higher education or we can say
qualification and their percentage according to the survey. most counts in the chart is represent to
the first degree etc.
Bar chart 5 - Levels of worry when walking in the dark:
v ery s afe
fairly s a fe
a b it u n s afe
v ery u n s afe
0 .0 0 % 1 0 .0 0 % 2 0 .0 0 % 3 0 .0 0 % 4 0 .0 0 % 5 0 .0 0 %
F e e lin g o f w o rry a b o u t w a lk in g a lo n e in th e d a rk
Total
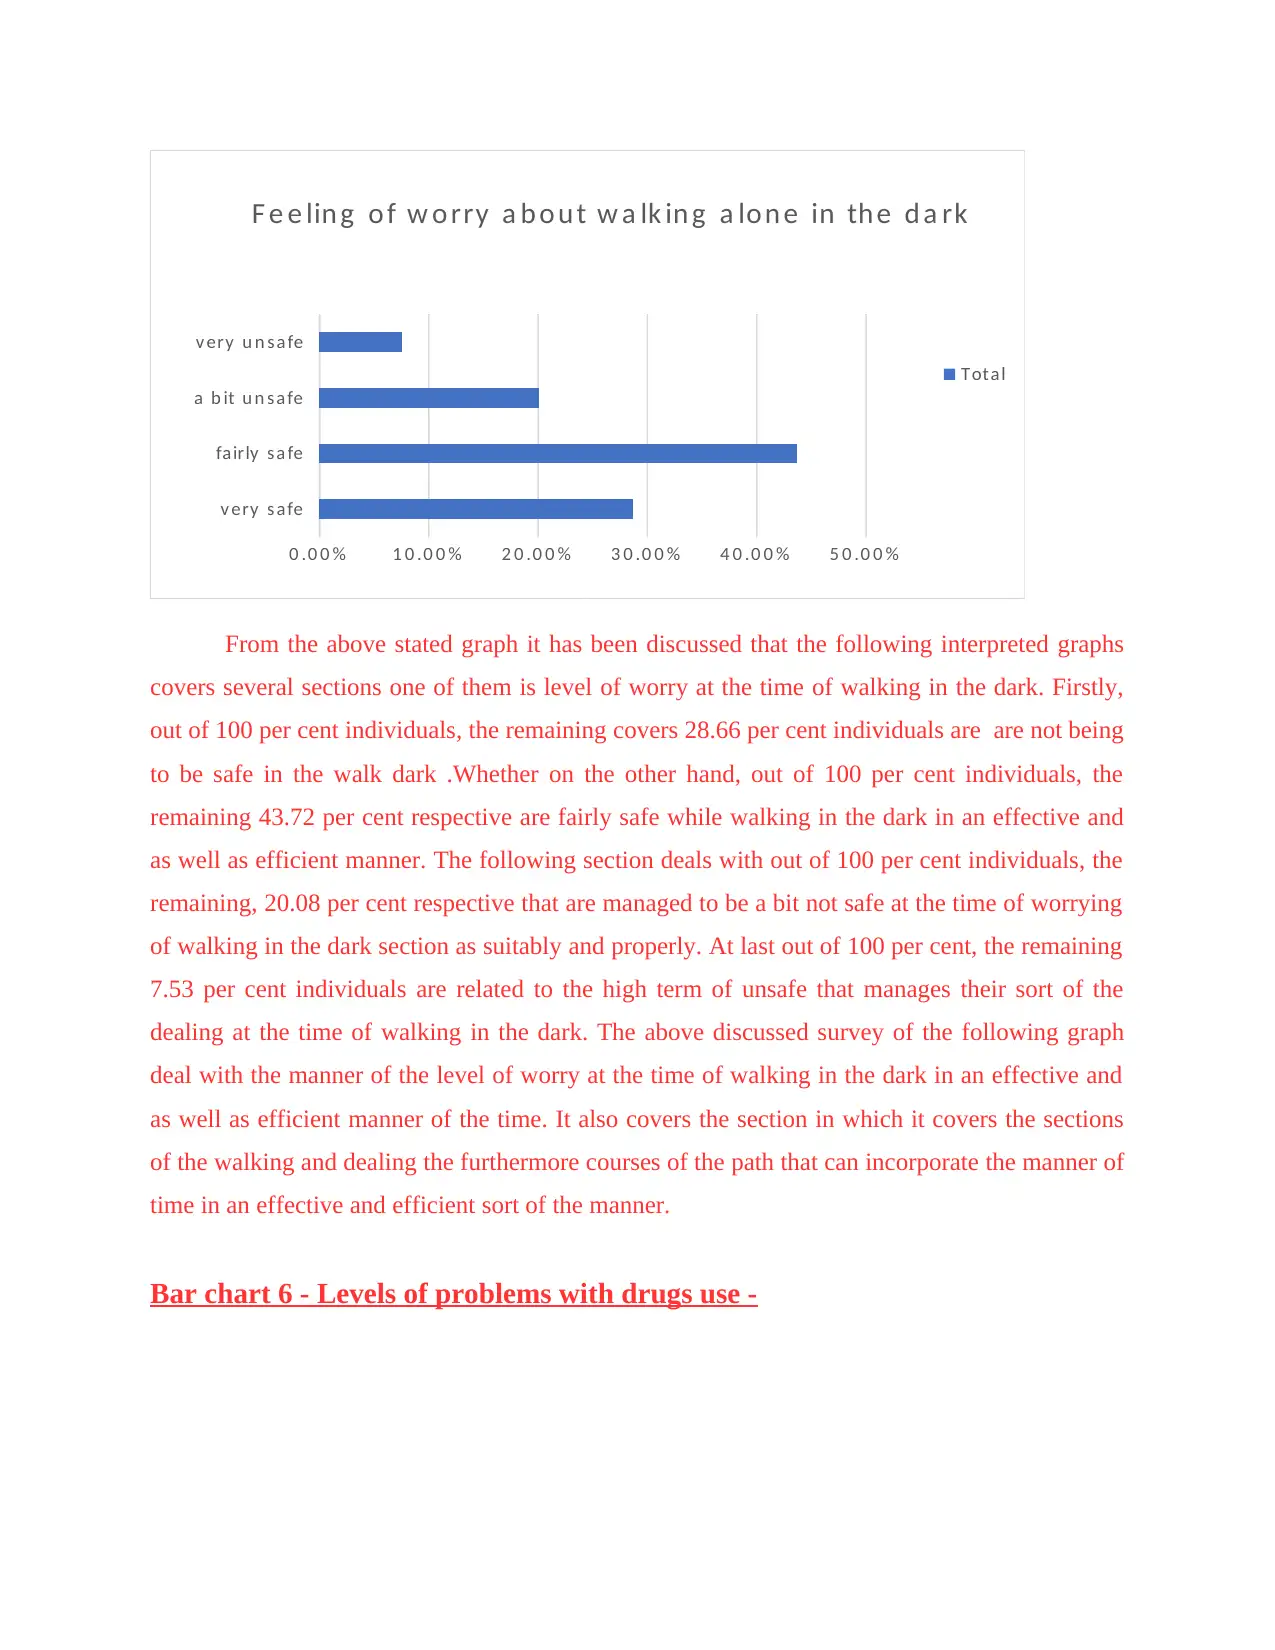
From the above stated graph it has been discussed that the following interpreted graphs
covers several sections one of them is level of worry at the time of walking in the dark. Firstly,
out of 100 per cent individuals, the remaining covers 28.66 per cent individuals are are not being
to be safe in the walk dark .Whether on the other hand, out of 100 per cent individuals, the
remaining 43.72 per cent respective are fairly safe while walking in the dark in an effective and
as well as efficient manner. The following section deals with out of 100 per cent individuals, the
remaining, 20.08 per cent respective that are managed to be a bit not safe at the time of worrying
of walking in the dark section as suitably and properly. At last out of 100 per cent, the remaining
7.53 per cent individuals are related to the high term of unsafe that manages their sort of the
dealing at the time of walking in the dark. The above discussed survey of the following graph
deal with the manner of the level of worry at the time of walking in the dark in an effective and
as well as efficient manner of the time. It also covers the section in which it covers the sections
of the walking and dealing the furthermore courses of the path that can incorporate the manner of
time in an effective and efficient sort of the manner.
Bar chart 6 - Levels of problems with drugs use -
fairly s a fe
a b it u n s afe
v ery u n s afe
0 .0 0 % 1 0 .0 0 % 2 0 .0 0 % 3 0 .0 0 % 4 0 .0 0 % 5 0 .0 0 %
F e e lin g o f w o rry a b o u t w a lk in g a lo n e in th e d a rk
Total
From the above stated graph it has been discussed that the following interpreted graphs
covers several sections one of them is level of worry at the time of walking in the dark. Firstly,
out of 100 per cent individuals, the remaining covers 28.66 per cent individuals are are not being
to be safe in the walk dark .Whether on the other hand, out of 100 per cent individuals, the
remaining 43.72 per cent respective are fairly safe while walking in the dark in an effective and
as well as efficient manner. The following section deals with out of 100 per cent individuals, the
remaining, 20.08 per cent respective that are managed to be a bit not safe at the time of worrying
of walking in the dark section as suitably and properly. At last out of 100 per cent, the remaining
7.53 per cent individuals are related to the high term of unsafe that manages their sort of the
dealing at the time of walking in the dark. The above discussed survey of the following graph
deal with the manner of the level of worry at the time of walking in the dark in an effective and
as well as efficient manner of the time. It also covers the section in which it covers the sections
of the walking and dealing the furthermore courses of the path that can incorporate the manner of
time in an effective and efficient sort of the manner.
Bar chart 6 - Levels of problems with drugs use -
Paraphrase This Document
Need a fresh take? Get an instant paraphrase of this document with our AI Paraphraser
Very b ig p rob lem
F airly b ig p rob lem
Not a v ery b ig p rob lem
Not a p rob lem at all
0 .0 0 % 2 0 .0 0 % 4 0 .0 0 % 6 0 .0 0 %
L e v e ls o f p ro b le m s w ith d ru g s
Total
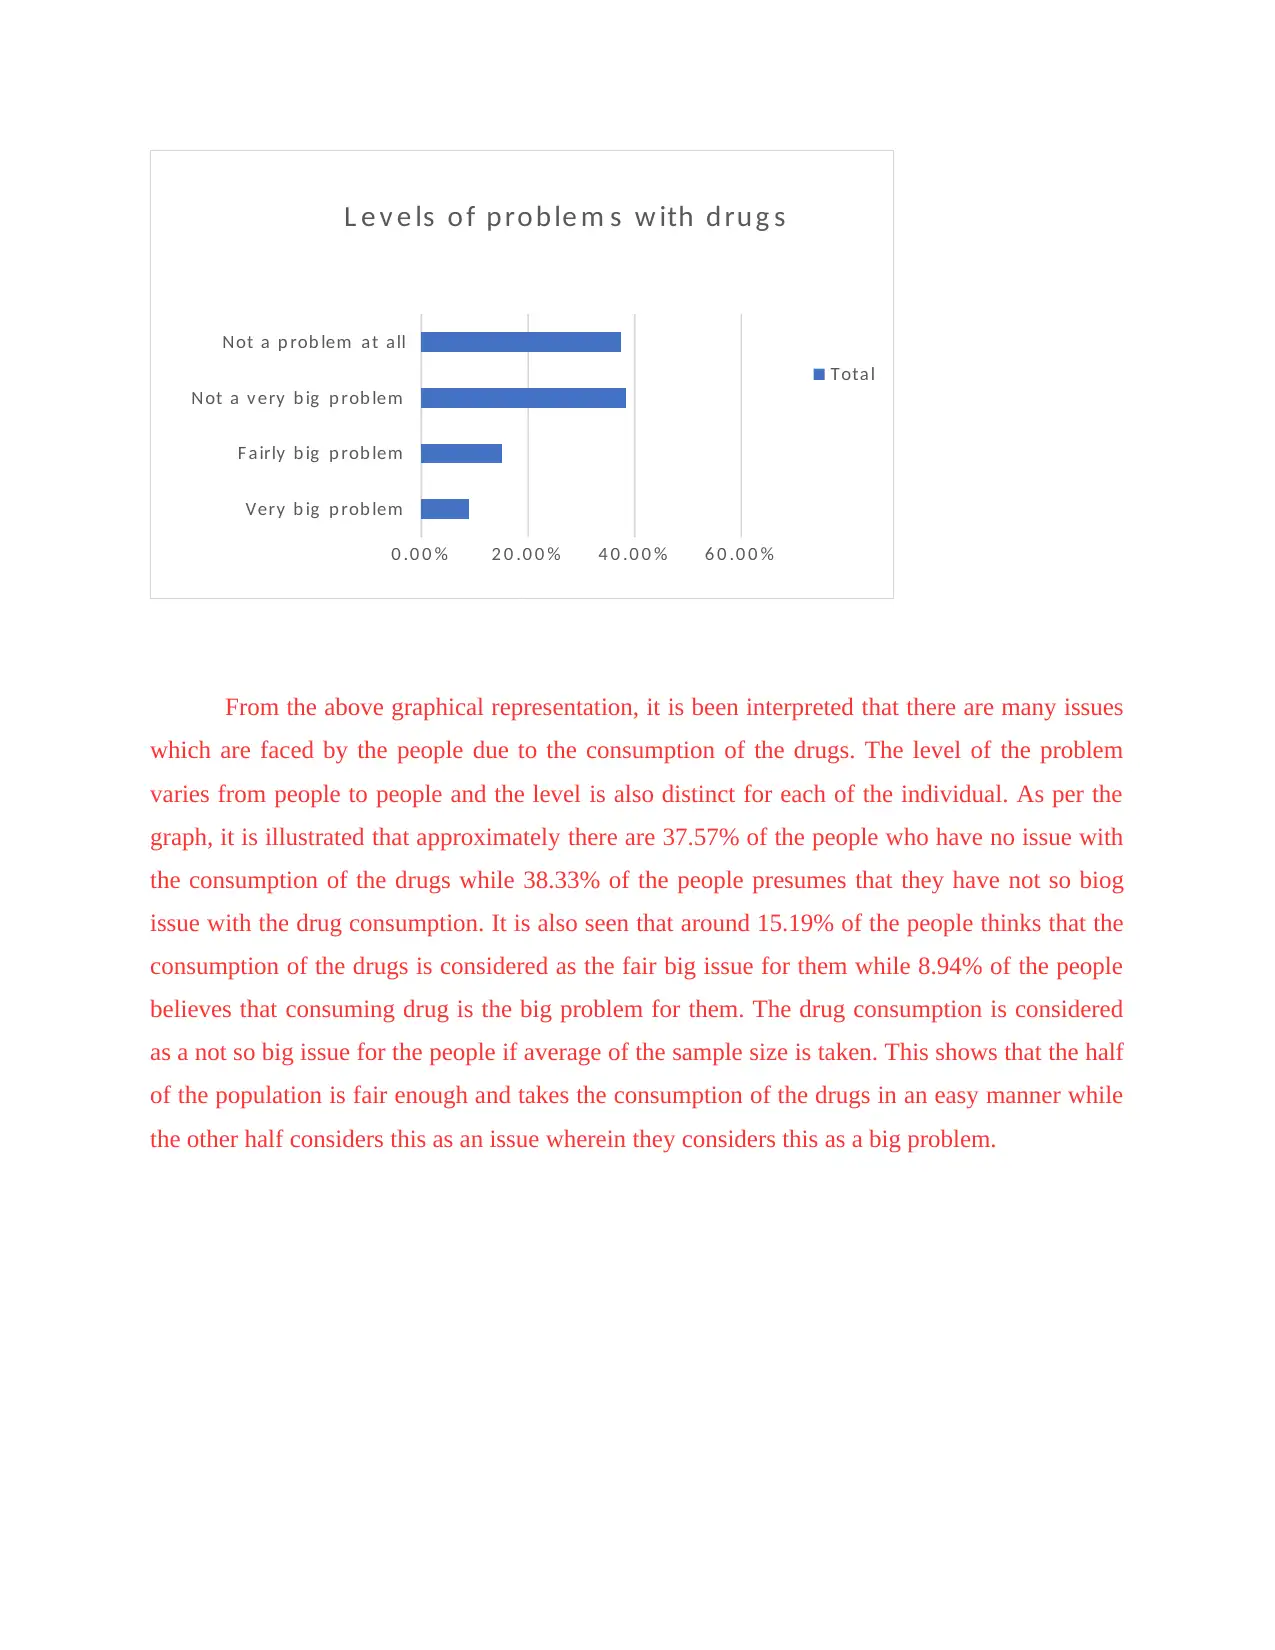
From the above graphical representation, it is been interpreted that there are many issues
which are faced by the people due to the consumption of the drugs. The level of the problem
varies from people to people and the level is also distinct for each of the individual. As per the
graph, it is illustrated that approximately there are 37.57% of the people who have no issue with
the consumption of the drugs while 38.33% of the people presumes that they have not so biog
issue with the drug consumption. It is also seen that around 15.19% of the people thinks that the
consumption of the drugs is considered as the fair big issue for them while 8.94% of the people
believes that consuming drug is the big problem for them. The drug consumption is considered
as a not so big issue for the people if average of the sample size is taken. This shows that the half
of the population is fair enough and takes the consumption of the drugs in an easy manner while
the other half considers this as an issue wherein they considers this as a big problem.
F airly b ig p rob lem
Not a v ery b ig p rob lem
Not a p rob lem at all
0 .0 0 % 2 0 .0 0 % 4 0 .0 0 % 6 0 .0 0 %
L e v e ls o f p ro b le m s w ith d ru g s
Total
From the above graphical representation, it is been interpreted that there are many issues
which are faced by the people due to the consumption of the drugs. The level of the problem
varies from people to people and the level is also distinct for each of the individual. As per the
graph, it is illustrated that approximately there are 37.57% of the people who have no issue with
the consumption of the drugs while 38.33% of the people presumes that they have not so biog
issue with the drug consumption. It is also seen that around 15.19% of the people thinks that the
consumption of the drugs is considered as the fair big issue for them while 8.94% of the people
believes that consuming drug is the big problem for them. The drug consumption is considered
as a not so big issue for the people if average of the sample size is taken. This shows that the half
of the population is fair enough and takes the consumption of the drugs in an easy manner while
the other half considers this as an issue wherein they considers this as a big problem.
CONCLUSION
From the above report it has been concluded that due to many unwanted elements or the
factors it has given the rise to the rate of crimes in the country and because of this rate of
prisoners has been increased drastically in around two decades which is actually double since the
1990. Moreover to it, enhanced number of the prisoners are done because of the several factors
which are drugs, sex abuse, violence and many more. Due to it, it has given the pressure on to
the prisons of the nations because of the overcrowding in the jails of UK. In order to overcome
this government of the country need to make several strict rules to decrease the rate of crime
which will ultimately will decline the pressure on the prisons as well.
REFERENCES
Books and Journals
Heard, C. and Padfield, N., 2022. 14 England and Wales. The Impact of Covid-19 on Prison
Conditions and Penal Policy, p.9.
Jones, R., 2018. Imprisonment in Wales: A factfile.
Dodd, S., Prison Libraries in England & Wales: Collection Development & Management 1999-
2019.
Brennan, P.K., 2020. Responses taken to mitigate COVID-19 in prisons in England and
Wales. Victims & Offenders, 15(7-8), pp.1215-1233.
Boone, M., Pakes, F. and van Wingerden, S., 2020. Explaining the collapse of the prison
population in the Netherlands: Testing the theories. European journal of criminology,
p.1477370819896220.
Cummins, I.D., 2019. The criminal justice system. Social Work and Society: Political and
Ideological Perspectives, p.132.
Bebbington, et. al 2021. The mental health of ex-prisoners: analysis of the 2014 English
National Survey of Psychiatric Morbidity. Social Psychiatry and Psychiatric
Epidemiology, 56(11), pp.2083-2093.
Boswell, G., 2018. Imprisoned fathers and their children: A reflection on two decades of
research. Child Care in Practice, 24(2), pp.212-224.
Secure Best Marks with AI Grader
Need help grading? Try our AI Grader for instant feedback on your assignments.


1 out of 12
Your All-in-One AI-Powered Toolkit for Academic Success.
+13062052269
info@desklib.com
Available 24*7 on WhatsApp / Email
![[object Object]](/_next/static/media/star-bottom.7253800d.svg)
Unlock your academic potential
© 2024 | Zucol Services PVT LTD | All rights reserved.