Probability Distributions and Decision Making Tools Assignment
VerifiedAdded on 2023/04/08
|11
|2386
|433
Homework Assignment
AI Summary
This assignment solution covers key concepts in probability and decision-making tools. It includes the definition and computation of expected value in discrete probability distributions, illustrated with a coin toss example. The assignment further analyzes daily sales data using Excel, calculating probabilities, mean, variance, and standard deviation. It also addresses probability calculations related to machine production quality control and applies normal distribution to sales forecasting. Additionally, the solution incorporates research on Australian population statistics and statistical inference for hypothesis testing, specifically addressing a claim of age discrimination in retrenchment. Desklib provides more solved assignments and study resources for students.
Probability Assignment 1
Probability Assignment
Decision Making Tools
Students Name:
Course Code:
Probability Assignment
Decision Making Tools
Students Name:
Course Code:
Paraphrase This Document
Need a fresh take? Get an instant paraphrase of this document with our AI Paraphraser
Probability Assignment 2
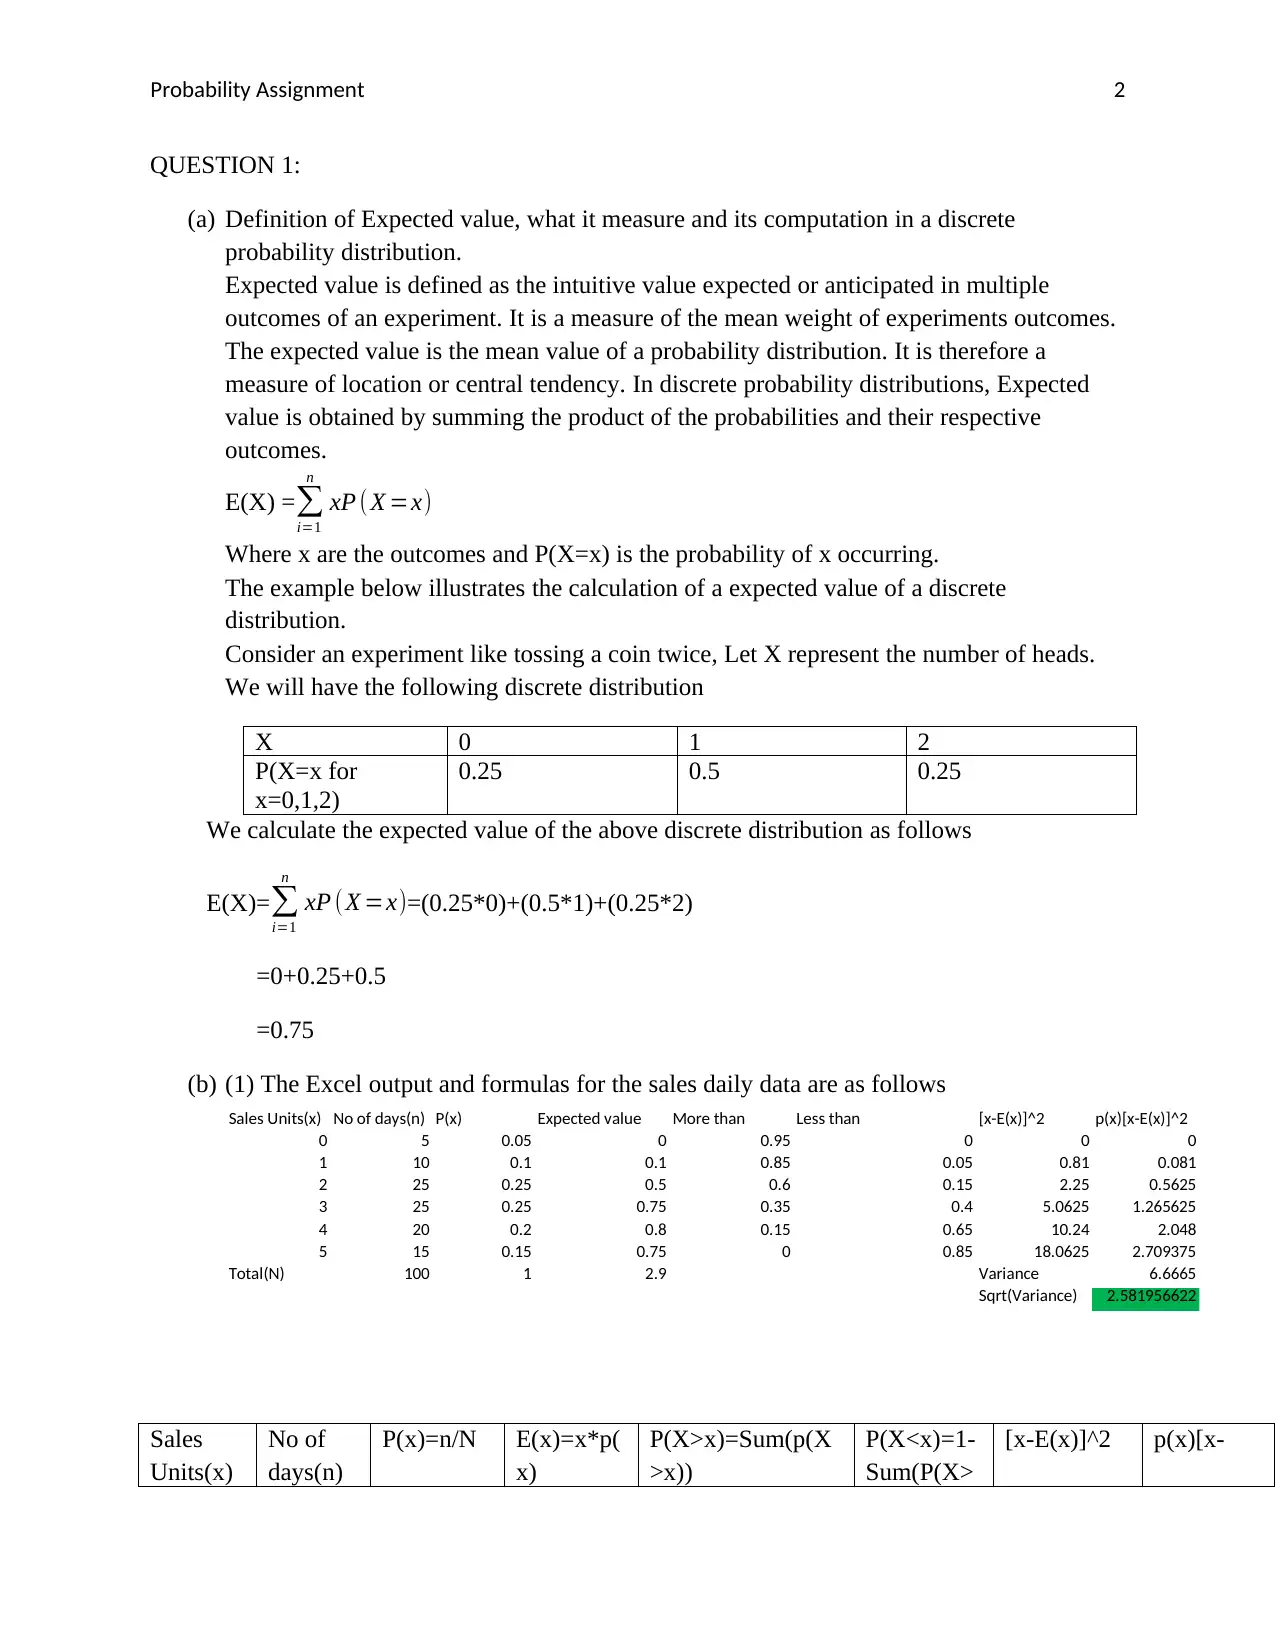
QUESTION 1:
(a) Definition of Expected value, what it measure and its computation in a discrete
probability distribution.
Expected value is defined as the intuitive value expected or anticipated in multiple
outcomes of an experiment. It is a measure of the mean weight of experiments outcomes.
The expected value is the mean value of a probability distribution. It is therefore a
measure of location or central tendency. In discrete probability distributions, Expected
value is obtained by summing the product of the probabilities and their respective
outcomes.
E(X) =∑
i=1
n
xP ( X =x)
Where x are the outcomes and P(X=x) is the probability of x occurring.
The example below illustrates the calculation of a expected value of a discrete
distribution.
Consider an experiment like tossing a coin twice, Let X represent the number of heads.
We will have the following discrete distribution
X 0 1 2
P(X=x for
x=0,1,2)
0.25 0.5 0.25
We calculate the expected value of the above discrete distribution as follows
E(X)=∑
i=1
n
xP (X =x)=(0.25*0)+(0.5*1)+(0.25*2)
=0+0.25+0.5
=0.75
(b) (1) The Excel output and formulas for the sales daily data are as follows
Sales Units(x) No of days(n) P(x) Expected value More than Less than [x-E(x)]^2 p(x)[x-E(x)]^2
0 5 0.05 0 0.95 0 0 0
1 10 0.1 0.1 0.85 0.05 0.81 0.081
2 25 0.25 0.5 0.6 0.15 2.25 0.5625
3 25 0.25 0.75 0.35 0.4 5.0625 1.265625
4 20 0.2 0.8 0.15 0.65 10.24 2.048
5 15 0.15 0.75 0 0.85 18.0625 2.709375
Total(N) 100 1 2.9 Variance 6.6665
Sqrt(Variance) 2.581956622
Sales
Units(x)
No of
days(n)
P(x)=n/N E(x)=x*p(
x)
P(X>x)=Sum(p(X
>x))
P(X<x)=1-
Sum(P(X>
[x-E(x)]^2 p(x)[x-
Probability Assignment 3
x)) E(x)]^2
0 5 0.0476190
48
0 0.952380952 0 0 0
1 15 0.1428571
43
0.1428571
43
0.80952381 0.0476190
48
0.73469387
8
0.1049562
68
2 25 0.2380952
38
0.4761904
76
0.571428571 0.1904761
9
2.32199546
5
0.5528560
63
3 25 0.2380952
38
0.7142857
14
0.333333333 0.4285714
29
5.22448979
6
1.2439261
42
4 20 0.1904761
9
0.7619047
62
0.142857143 0.6666666
67
10.4852607
7
1.9971925
28
5 15 0.1428571
43
0.7142857
14
0 0.8571428
57
18.3673469
4
2.6239067
06
Total(N) 105 1 2.8095238
1
Variance 6.5228377
07
Sqrt(Varian
ce)
2.5539846
72
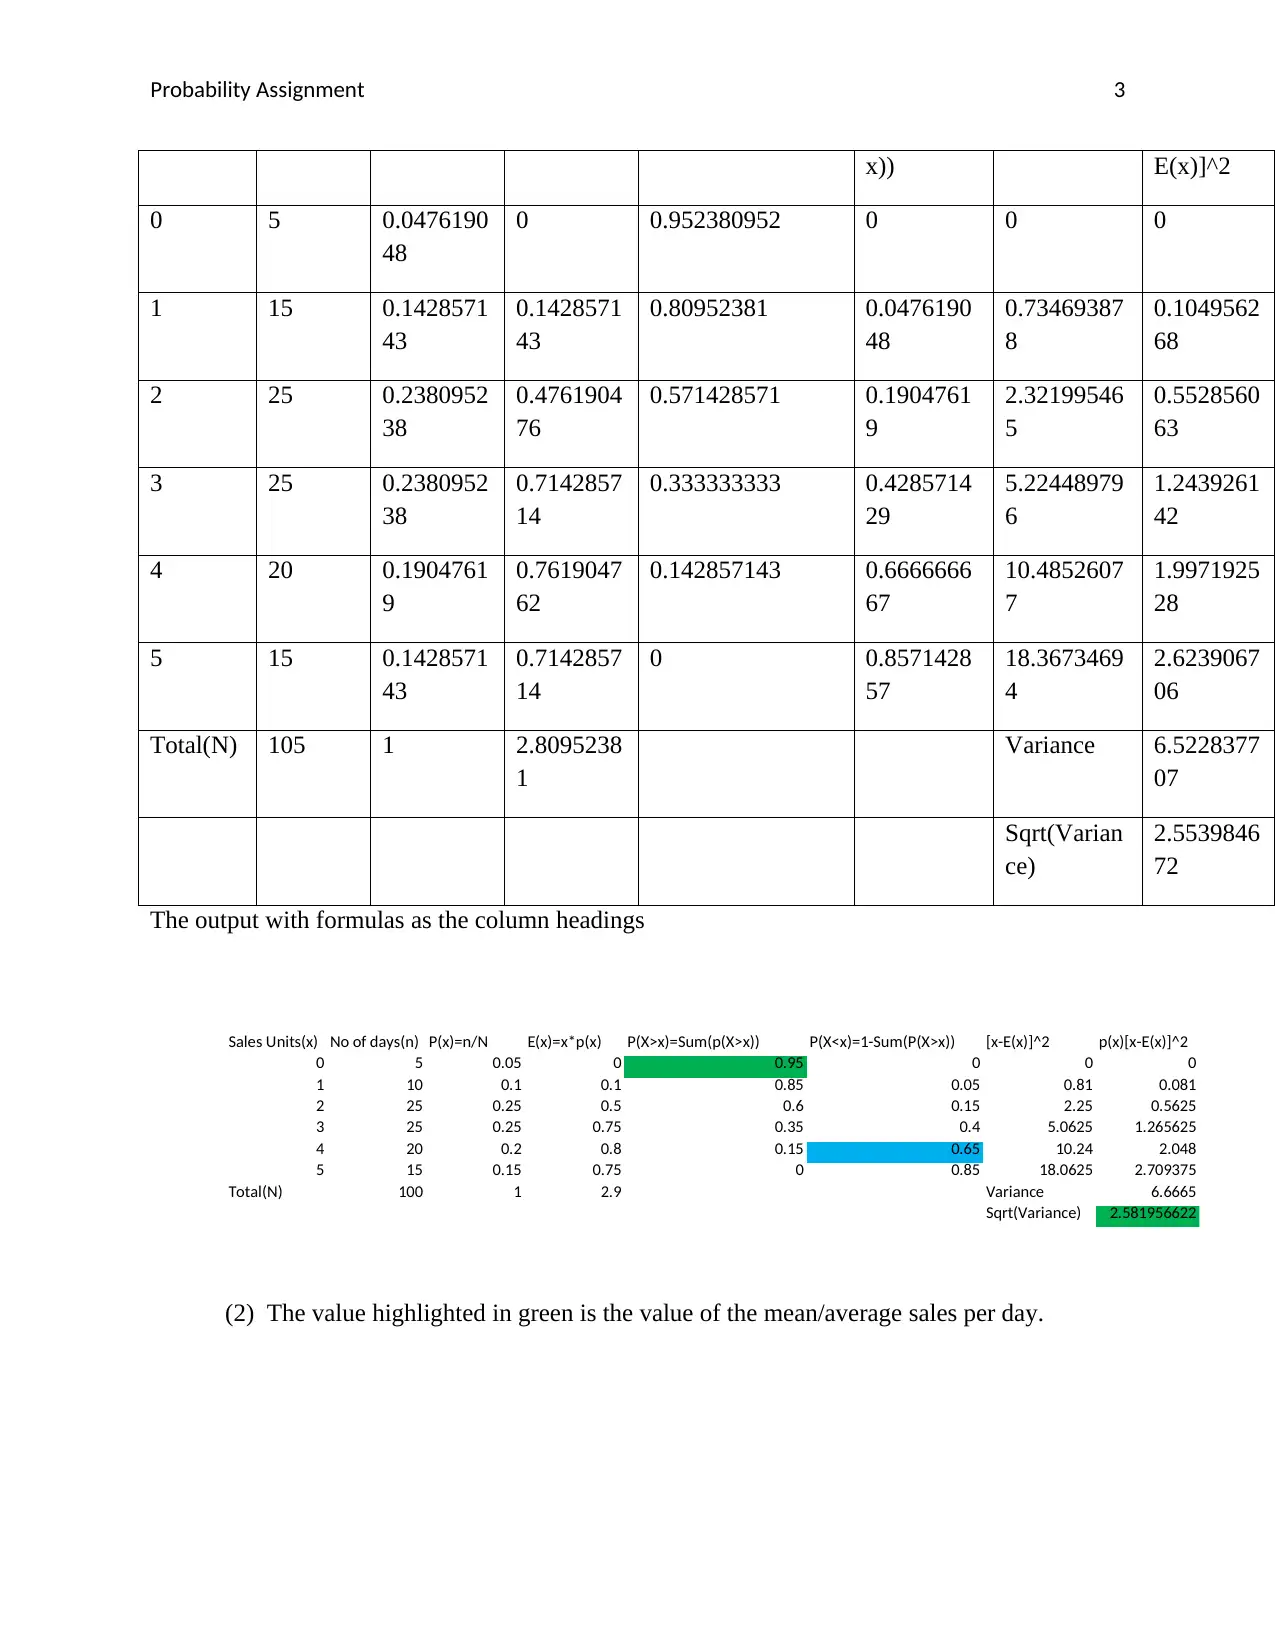
The output with formulas as the column headings
Sales Units(x) No of days(n) P(x)=n/N E(x)=x*p(x) P(X>x)=Sum(p(X>x)) P(X<x)=1-Sum(P(X>x)) [x-E(x)]^2 p(x)[x-E(x)]^2
0 5 0.05 0 0.95 0 0 0
1 10 0.1 0.1 0.85 0.05 0.81 0.081
2 25 0.25 0.5 0.6 0.15 2.25 0.5625
3 25 0.25 0.75 0.35 0.4 5.0625 1.265625
4 20 0.2 0.8 0.15 0.65 10.24 2.048
5 15 0.15 0.75 0 0.85 18.0625 2.709375
Total(N) 100 1 2.9 Variance 6.6665
Sqrt(Variance) 2.581956622
(2) The value highlighted in green is the value of the mean/average sales per day.
x)) E(x)]^2
0 5 0.0476190
48
0 0.952380952 0 0 0
1 15 0.1428571
43
0.1428571
43
0.80952381 0.0476190
48
0.73469387
8
0.1049562
68
2 25 0.2380952
38
0.4761904
76
0.571428571 0.1904761
9
2.32199546
5
0.5528560
63
3 25 0.2380952
38
0.7142857
14
0.333333333 0.4285714
29
5.22448979
6
1.2439261
42
4 20 0.1904761
9
0.7619047
62
0.142857143 0.6666666
67
10.4852607
7
1.9971925
28
5 15 0.1428571
43
0.7142857
14
0 0.8571428
57
18.3673469
4
2.6239067
06
Total(N) 105 1 2.8095238
1
Variance 6.5228377
07
Sqrt(Varian
ce)
2.5539846
72
The output with formulas as the column headings
Sales Units(x) No of days(n) P(x)=n/N E(x)=x*p(x) P(X>x)=Sum(p(X>x)) P(X<x)=1-Sum(P(X>x)) [x-E(x)]^2 p(x)[x-E(x)]^2
0 5 0.05 0 0.95 0 0 0
1 10 0.1 0.1 0.85 0.05 0.81 0.081
2 25 0.25 0.5 0.6 0.15 2.25 0.5625
3 25 0.25 0.75 0.35 0.4 5.0625 1.265625
4 20 0.2 0.8 0.15 0.65 10.24 2.048
5 15 0.15 0.75 0 0.85 18.0625 2.709375
Total(N) 100 1 2.9 Variance 6.6665
Sqrt(Variance) 2.581956622
(2) The value highlighted in green is the value of the mean/average sales per day.
⊘ This is a preview!⊘
Do you want full access?
Subscribe today to unlock all pages.
Trusted by 1+ million students worldwide
Probability Assignment 4
Sales Units(x) No of days(n) P(x)=n/N E(x)=x*p(x) P(X>x)=Sum(p(X>x)) P(X<x)=1-Sum(P(X>x)) [x-E(x)]^2 p(x)[x-E(x)]^2
0 5 0.05 0 0.95 0 0 0
1 10 0.1 0.1 0.85 0.05 0.81 0.081
2 25 0.25 0.5 0.6 0.15 2.25 0.5625
3 25 0.25 0.75 0.35 0.4 5.0625 1.265625
4 20 0.2 0.8 0.15 0.65 10.24 2.048
5 15 0.15 0.75 0 0.85 18.0625 2.709375
Total(N) 100 1 2.9 Variance 6.6665
Sqrt(Variance) 2.581956622
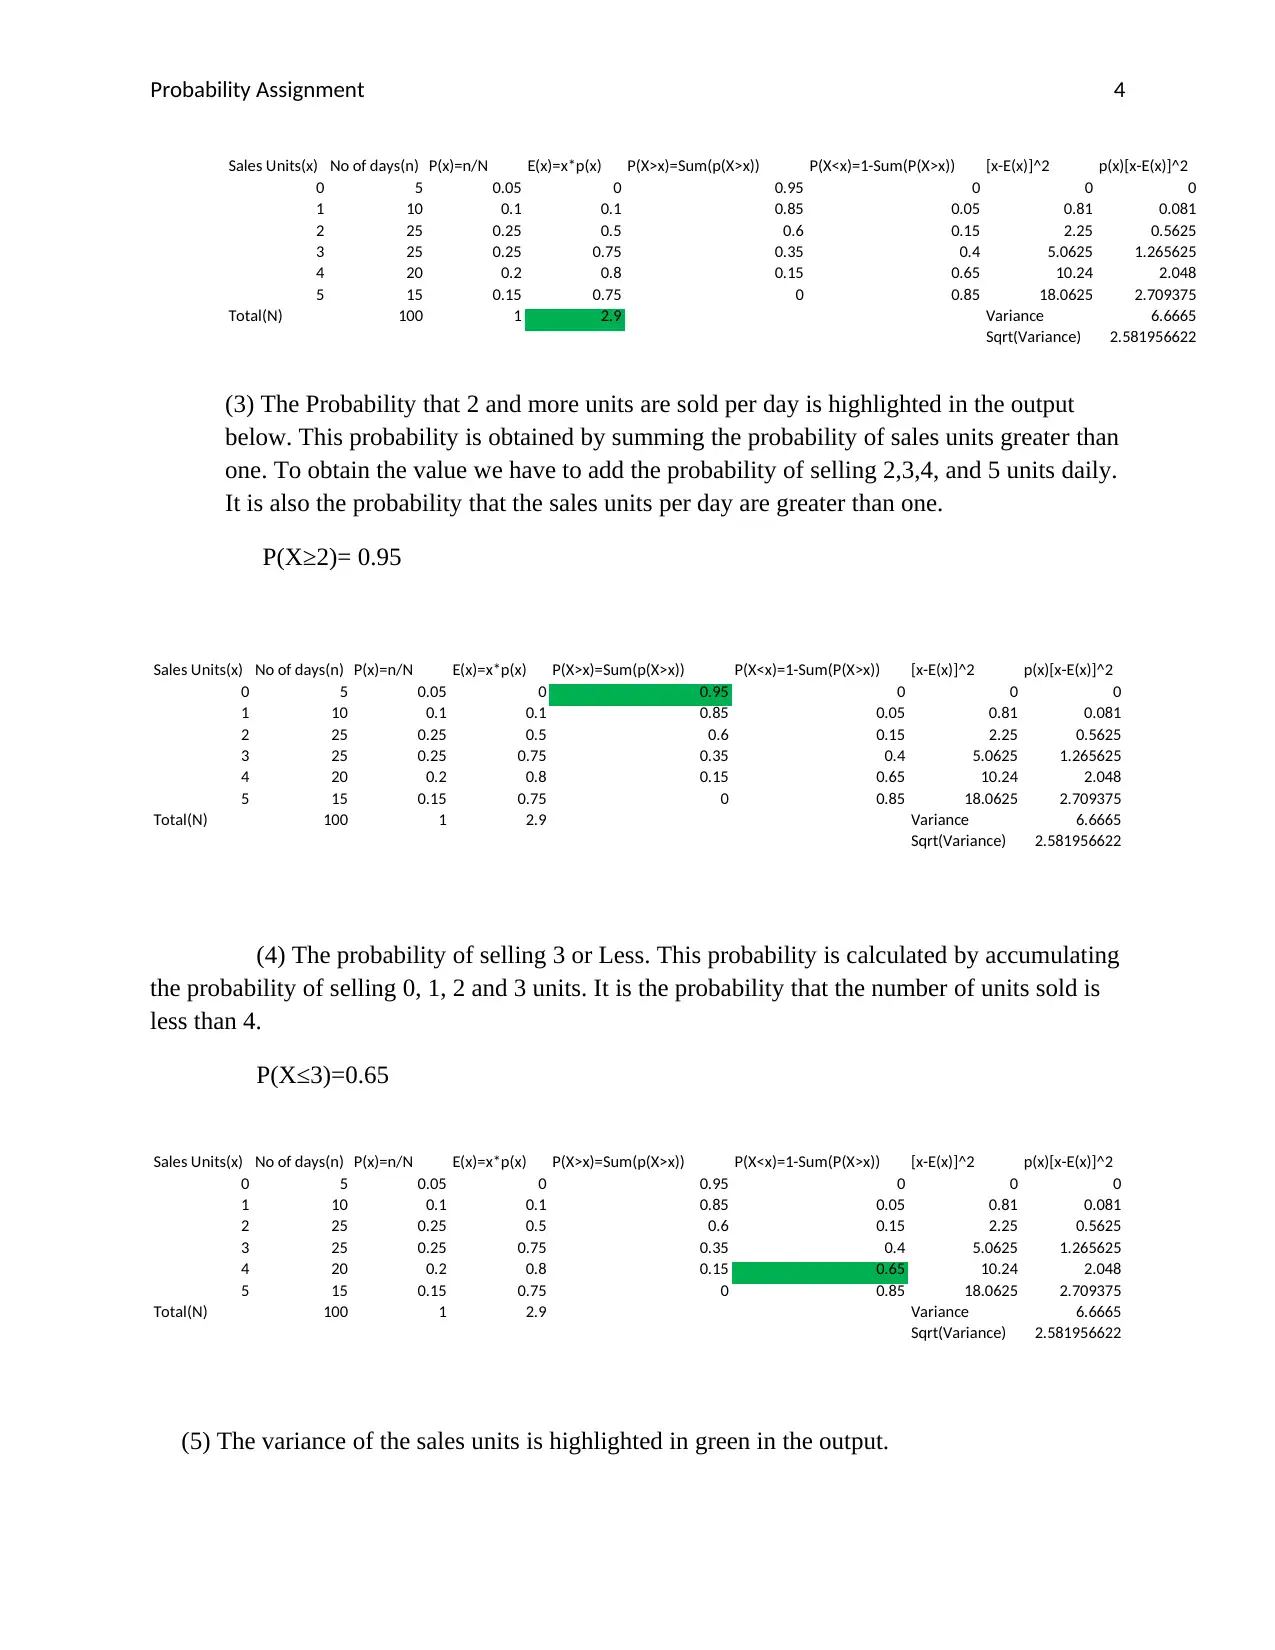
(3) The Probability that 2 and more units are sold per day is highlighted in the output
below. This probability is obtained by summing the probability of sales units greater than
one. To obtain the value we have to add the probability of selling 2,3,4, and 5 units daily.
It is also the probability that the sales units per day are greater than one.
P(X≥2)= 0.95
Sales Units(x) No of days(n) P(x)=n/N E(x)=x*p(x) P(X>x)=Sum(p(X>x)) P(X<x)=1-Sum(P(X>x)) [x-E(x)]^2 p(x)[x-E(x)]^2
0 5 0.05 0 0.95 0 0 0
1 10 0.1 0.1 0.85 0.05 0.81 0.081
2 25 0.25 0.5 0.6 0.15 2.25 0.5625
3 25 0.25 0.75 0.35 0.4 5.0625 1.265625
4 20 0.2 0.8 0.15 0.65 10.24 2.048
5 15 0.15 0.75 0 0.85 18.0625 2.709375
Total(N) 100 1 2.9 Variance 6.6665
Sqrt(Variance) 2.581956622
(4) The probability of selling 3 or Less. This probability is calculated by accumulating
the probability of selling 0, 1, 2 and 3 units. It is the probability that the number of units sold is
less than 4.
P(X≤3)=0.65
Sales Units(x) No of days(n) P(x)=n/N E(x)=x*p(x) P(X>x)=Sum(p(X>x)) P(X<x)=1-Sum(P(X>x)) [x-E(x)]^2 p(x)[x-E(x)]^2
0 5 0.05 0 0.95 0 0 0
1 10 0.1 0.1 0.85 0.05 0.81 0.081
2 25 0.25 0.5 0.6 0.15 2.25 0.5625
3 25 0.25 0.75 0.35 0.4 5.0625 1.265625
4 20 0.2 0.8 0.15 0.65 10.24 2.048
5 15 0.15 0.75 0 0.85 18.0625 2.709375
Total(N) 100 1 2.9 Variance 6.6665
Sqrt(Variance) 2.581956622
(5) The variance of the sales units is highlighted in green in the output.
Sales Units(x) No of days(n) P(x)=n/N E(x)=x*p(x) P(X>x)=Sum(p(X>x)) P(X<x)=1-Sum(P(X>x)) [x-E(x)]^2 p(x)[x-E(x)]^2
0 5 0.05 0 0.95 0 0 0
1 10 0.1 0.1 0.85 0.05 0.81 0.081
2 25 0.25 0.5 0.6 0.15 2.25 0.5625
3 25 0.25 0.75 0.35 0.4 5.0625 1.265625
4 20 0.2 0.8 0.15 0.65 10.24 2.048
5 15 0.15 0.75 0 0.85 18.0625 2.709375
Total(N) 100 1 2.9 Variance 6.6665
Sqrt(Variance) 2.581956622
(3) The Probability that 2 and more units are sold per day is highlighted in the output
below. This probability is obtained by summing the probability of sales units greater than
one. To obtain the value we have to add the probability of selling 2,3,4, and 5 units daily.
It is also the probability that the sales units per day are greater than one.
P(X≥2)= 0.95
Sales Units(x) No of days(n) P(x)=n/N E(x)=x*p(x) P(X>x)=Sum(p(X>x)) P(X<x)=1-Sum(P(X>x)) [x-E(x)]^2 p(x)[x-E(x)]^2
0 5 0.05 0 0.95 0 0 0
1 10 0.1 0.1 0.85 0.05 0.81 0.081
2 25 0.25 0.5 0.6 0.15 2.25 0.5625
3 25 0.25 0.75 0.35 0.4 5.0625 1.265625
4 20 0.2 0.8 0.15 0.65 10.24 2.048
5 15 0.15 0.75 0 0.85 18.0625 2.709375
Total(N) 100 1 2.9 Variance 6.6665
Sqrt(Variance) 2.581956622
(4) The probability of selling 3 or Less. This probability is calculated by accumulating
the probability of selling 0, 1, 2 and 3 units. It is the probability that the number of units sold is
less than 4.
P(X≤3)=0.65
Sales Units(x) No of days(n) P(x)=n/N E(x)=x*p(x) P(X>x)=Sum(p(X>x)) P(X<x)=1-Sum(P(X>x)) [x-E(x)]^2 p(x)[x-E(x)]^2
0 5 0.05 0 0.95 0 0 0
1 10 0.1 0.1 0.85 0.05 0.81 0.081
2 25 0.25 0.5 0.6 0.15 2.25 0.5625
3 25 0.25 0.75 0.35 0.4 5.0625 1.265625
4 20 0.2 0.8 0.15 0.65 10.24 2.048
5 15 0.15 0.75 0 0.85 18.0625 2.709375
Total(N) 100 1 2.9 Variance 6.6665
Sqrt(Variance) 2.581956622
(5) The variance of the sales units is highlighted in green in the output.
Paraphrase This Document
Need a fresh take? Get an instant paraphrase of this document with our AI Paraphraser
Probability Assignment 5
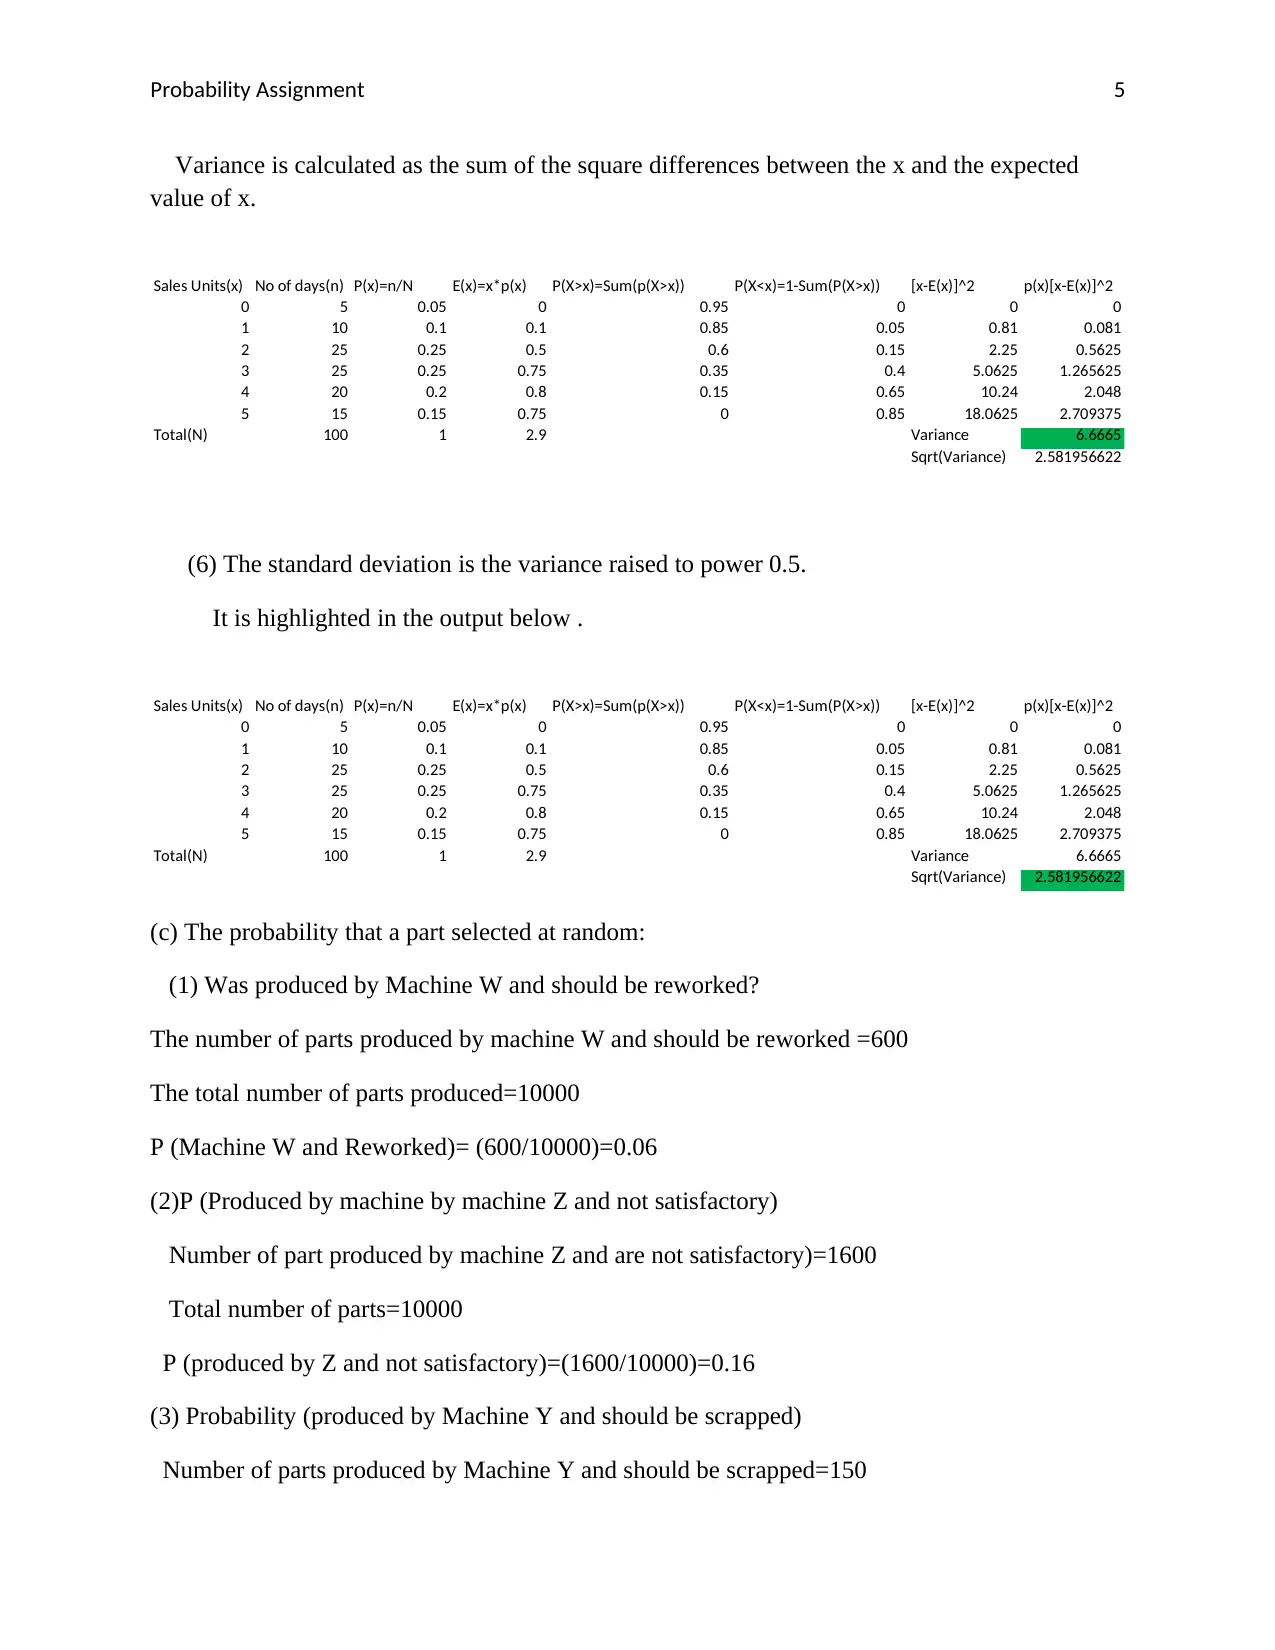
Variance is calculated as the sum of the square differences between the x and the expected
value of x.
Sales Units(x) No of days(n) P(x)=n/N E(x)=x*p(x) P(X>x)=Sum(p(X>x)) P(X<x)=1-Sum(P(X>x)) [x-E(x)]^2 p(x)[x-E(x)]^2
0 5 0.05 0 0.95 0 0 0
1 10 0.1 0.1 0.85 0.05 0.81 0.081
2 25 0.25 0.5 0.6 0.15 2.25 0.5625
3 25 0.25 0.75 0.35 0.4 5.0625 1.265625
4 20 0.2 0.8 0.15 0.65 10.24 2.048
5 15 0.15 0.75 0 0.85 18.0625 2.709375
Total(N) 100 1 2.9 Variance 6.6665
Sqrt(Variance) 2.581956622
(6) The standard deviation is the variance raised to power 0.5.
It is highlighted in the output below .
Sales Units(x) No of days(n) P(x)=n/N E(x)=x*p(x) P(X>x)=Sum(p(X>x)) P(X<x)=1-Sum(P(X>x)) [x-E(x)]^2 p(x)[x-E(x)]^2
0 5 0.05 0 0.95 0 0 0
1 10 0.1 0.1 0.85 0.05 0.81 0.081
2 25 0.25 0.5 0.6 0.15 2.25 0.5625
3 25 0.25 0.75 0.35 0.4 5.0625 1.265625
4 20 0.2 0.8 0.15 0.65 10.24 2.048
5 15 0.15 0.75 0 0.85 18.0625 2.709375
Total(N) 100 1 2.9 Variance 6.6665
Sqrt(Variance) 2.581956622
(c) The probability that a part selected at random:
(1) Was produced by Machine W and should be reworked?
The number of parts produced by machine W and should be reworked =600
The total number of parts produced=10000
P (Machine W and Reworked)= (600/10000)=0.06
(2)P (Produced by machine by machine Z and not satisfactory)
Number of part produced by machine Z and are not satisfactory)=1600
Total number of parts=10000
P (produced by Z and not satisfactory)=(1600/10000)=0.16
(3) Probability (produced by Machine Y and should be scrapped)
Number of parts produced by Machine Y and should be scrapped=150
Probability Assignment 6
Total number of parts produced=10000
Probability (produced by Machine Y and should be scrapped)=150/10000=0.015
(4) Probability (part need to be reworked)
Number of parts that require reworking=1500
Total number of parts=10000
Probability (part need to be reworked)= 1500/10000=0.15
(5) Probability (Part needs to be scrapped given that it was produced by machine W)
Number of parts that need scrapping given they were produced by Machine W= 200
Number of parts produced by Machine W=4000
Probability (Part needs to be scrapped given that it was produced by machine W)
=200/4000=0.05
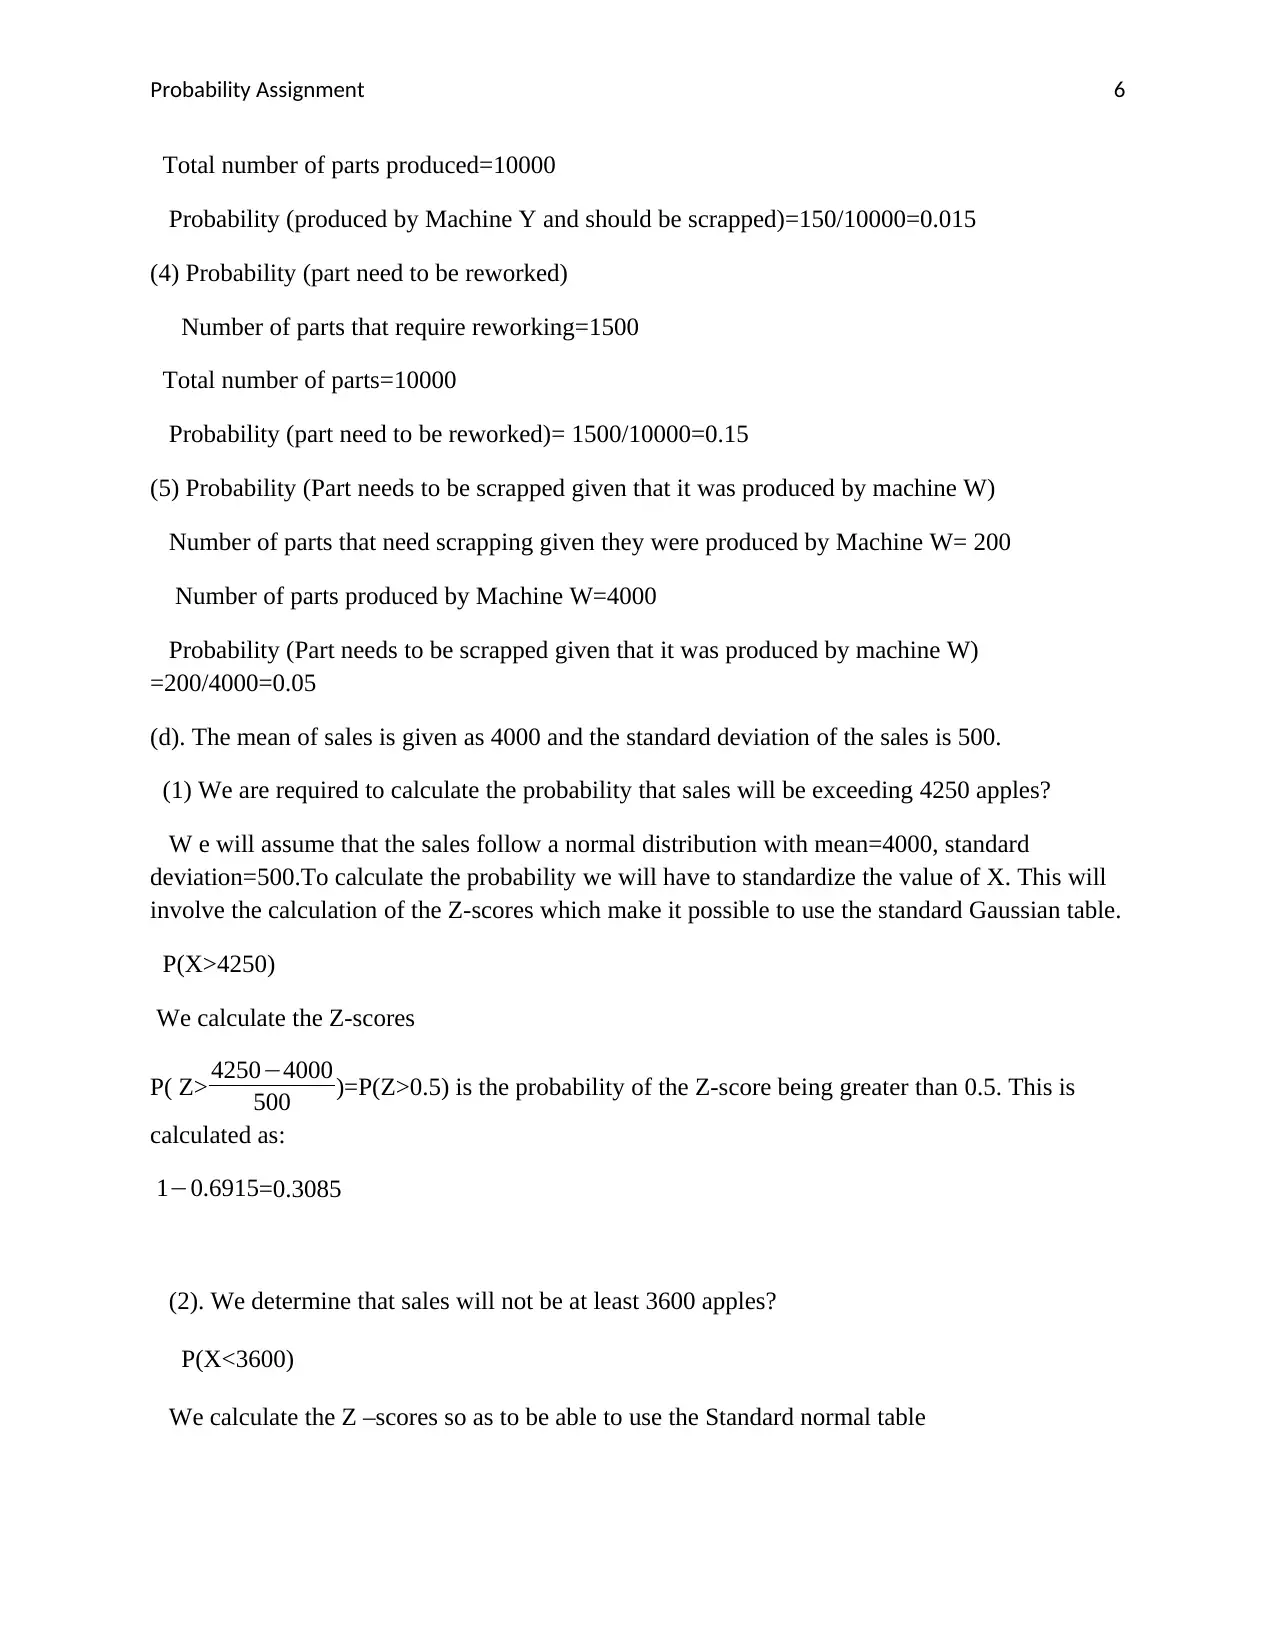
(d). The mean of sales is given as 4000 and the standard deviation of the sales is 500.
(1) We are required to calculate the probability that sales will be exceeding 4250 apples?
W e will assume that the sales follow a normal distribution with mean=4000, standard
deviation=500.To calculate the probability we will have to standardize the value of X. This will
involve the calculation of the Z-scores which make it possible to use the standard Gaussian table.
P(X>4250)
We calculate the Z-scores
P( Z> 4250−4000
500 )=P(Z>0.5) is the probability of the Z-score being greater than 0.5. This is
calculated as:
1−0.6915=0.3085
(2). We determine that sales will not be at least 3600 apples?
P(X<3600)
We calculate the Z –scores so as to be able to use the Standard normal table
Total number of parts produced=10000
Probability (produced by Machine Y and should be scrapped)=150/10000=0.015
(4) Probability (part need to be reworked)
Number of parts that require reworking=1500
Total number of parts=10000
Probability (part need to be reworked)= 1500/10000=0.15
(5) Probability (Part needs to be scrapped given that it was produced by machine W)
Number of parts that need scrapping given they were produced by Machine W= 200
Number of parts produced by Machine W=4000
Probability (Part needs to be scrapped given that it was produced by machine W)
=200/4000=0.05
(d). The mean of sales is given as 4000 and the standard deviation of the sales is 500.
(1) We are required to calculate the probability that sales will be exceeding 4250 apples?
W e will assume that the sales follow a normal distribution with mean=4000, standard
deviation=500.To calculate the probability we will have to standardize the value of X. This will
involve the calculation of the Z-scores which make it possible to use the standard Gaussian table.
P(X>4250)
We calculate the Z-scores
P( Z> 4250−4000
500 )=P(Z>0.5) is the probability of the Z-score being greater than 0.5. This is
calculated as:
1−0.6915=0.3085
(2). We determine that sales will not be at least 3600 apples?
P(X<3600)
We calculate the Z –scores so as to be able to use the Standard normal table
⊘ This is a preview!⊘
Do you want full access?
Subscribe today to unlock all pages.
Trusted by 1+ million students worldwide
Probability Assignment 7
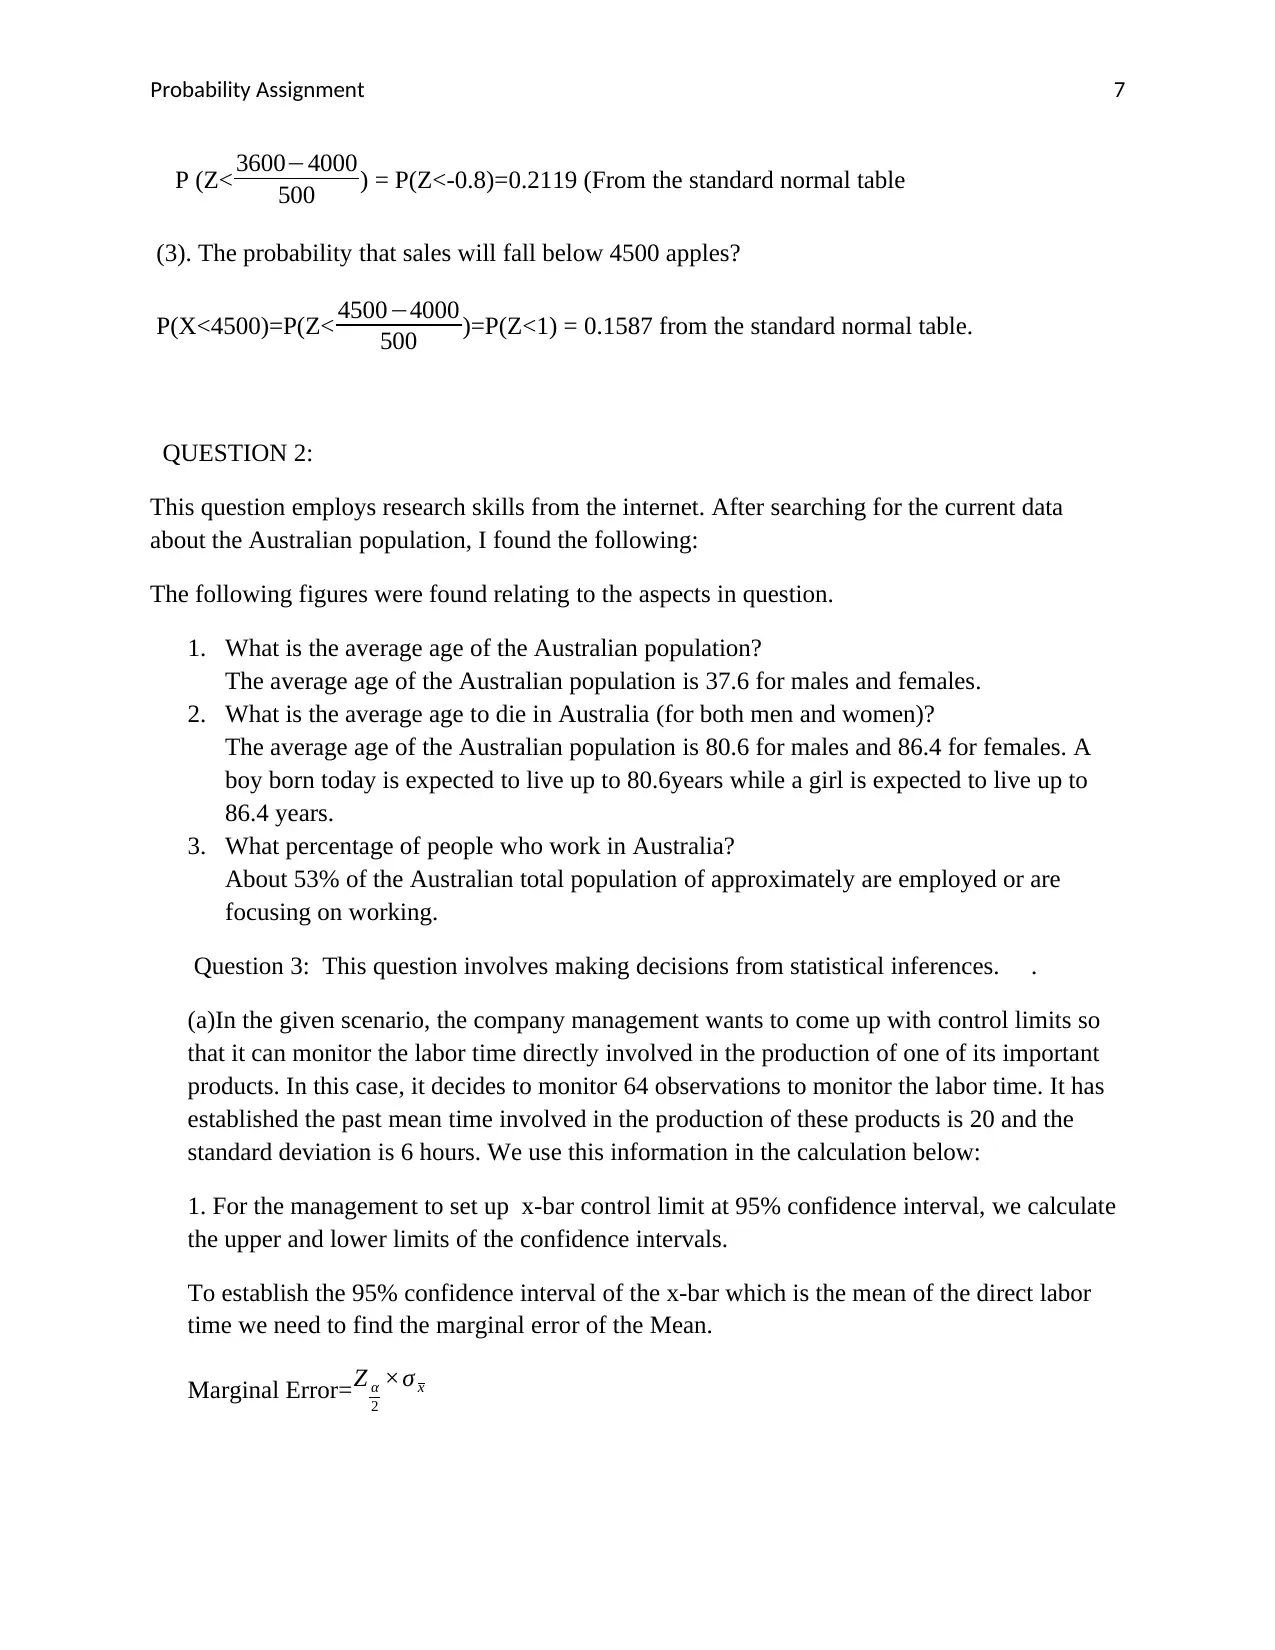
P (Z< 3600−4000
500 ) = P(Z<-0.8)=0.2119 (From the standard normal table
(3). The probability that sales will fall below 4500 apples?
P(X<4500)=P(Z< 4500−4000
500 )=P(Z<1) = 0.1587 from the standard normal table.
QUESTION 2:
This question employs research skills from the internet. After searching for the current data
about the Australian population, I found the following:
The following figures were found relating to the aspects in question.
1. What is the average age of the Australian population?
The average age of the Australian population is 37.6 for males and females.
2. What is the average age to die in Australia (for both men and women)?
The average age of the Australian population is 80.6 for males and 86.4 for females. A
boy born today is expected to live up to 80.6years while a girl is expected to live up to
86.4 years.
3. What percentage of people who work in Australia?
About 53% of the Australian total population of approximately are employed or are
focusing on working.
Question 3: This question involves making decisions from statistical inferences. .
(a)In the given scenario, the company management wants to come up with control limits so
that it can monitor the labor time directly involved in the production of one of its important
products. In this case, it decides to monitor 64 observations to monitor the labor time. It has
established the past mean time involved in the production of these products is 20 and the
standard deviation is 6 hours. We use this information in the calculation below:
1. For the management to set up x-bar control limit at 95% confidence interval, we calculate
the upper and lower limits of the confidence intervals.
To establish the 95% confidence interval of the x-bar which is the mean of the direct labor
time we need to find the marginal error of the Mean.
Marginal Error=Z α
2
×σ x
Paraphrase This Document
Need a fresh take? Get an instant paraphrase of this document with our AI Paraphraser
Probability Assignment 8
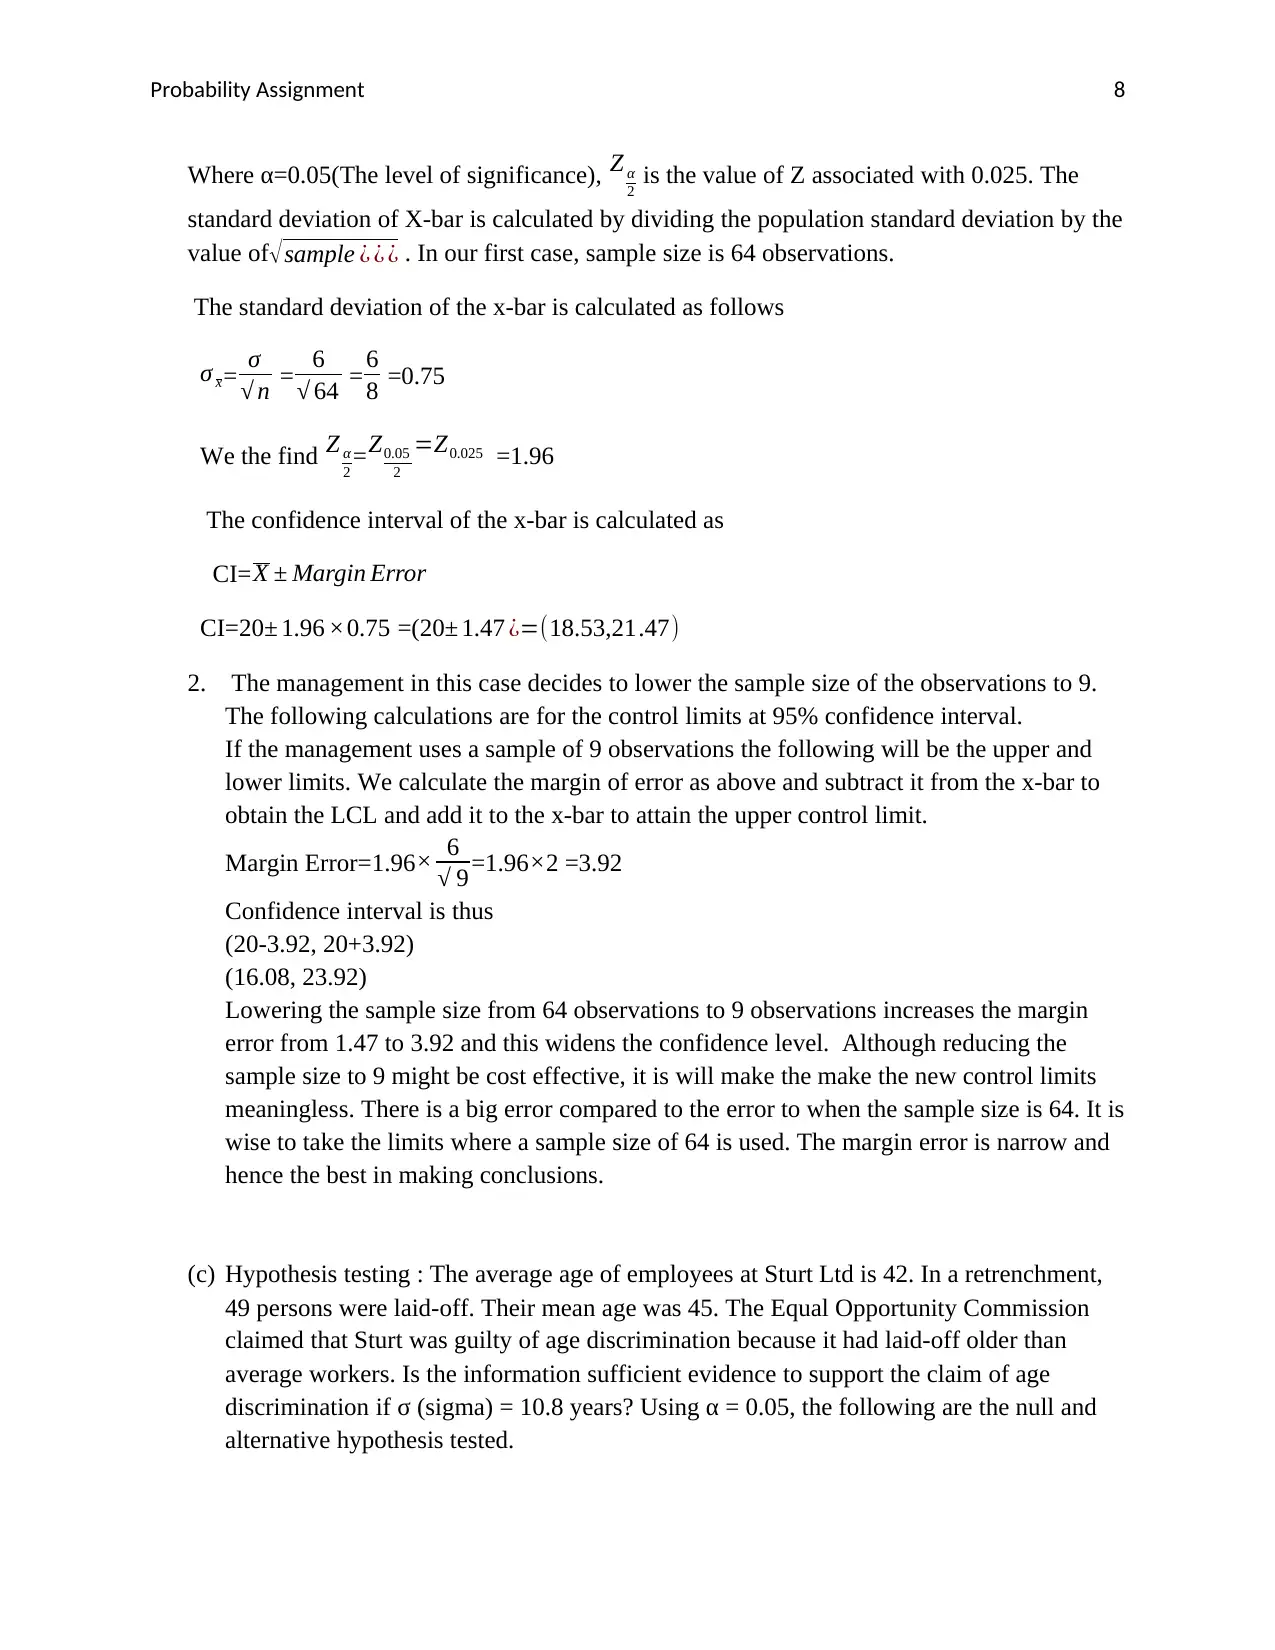
Where α=0.05(The level of significance), Z α
2 is the value of Z associated with 0.025. The
standard deviation of X-bar is calculated by dividing the population standard deviation by the
value of√sample ¿ ¿ ¿ . In our first case, sample size is 64 observations.
The standard deviation of the x-bar is calculated as follows
σ x= σ
√ n = 6
√ 64 = 6
8 =0.75
We the find Z α
2 = Z0.05
2
=Z0.025 =1.96
The confidence interval of the x-bar is calculated as
CI= X ± Margin Error
CI=20± 1.96 ×0.75 =(20± 1.47 ¿=(18.53,21.47)
2. The management in this case decides to lower the sample size of the observations to 9.
The following calculations are for the control limits at 95% confidence interval.
If the management uses a sample of 9 observations the following will be the upper and
lower limits. We calculate the margin of error as above and subtract it from the x-bar to
obtain the LCL and add it to the x-bar to attain the upper control limit.
Margin Error=1.96× 6
√ 9=1.96 ×2 =3.92
Confidence interval is thus
(20-3.92, 20+3.92)
(16.08, 23.92)
Lowering the sample size from 64 observations to 9 observations increases the margin
error from 1.47 to 3.92 and this widens the confidence level. Although reducing the
sample size to 9 might be cost effective, it is will make the make the new control limits
meaningless. There is a big error compared to the error to when the sample size is 64. It is
wise to take the limits where a sample size of 64 is used. The margin error is narrow and
hence the best in making conclusions.
(c) Hypothesis testing : The average age of employees at Sturt Ltd is 42. In a retrenchment,
49 persons were laid-off. Their mean age was 45. The Equal Opportunity Commission
claimed that Sturt was guilty of age discrimination because it had laid-off older than
average workers. Is the information sufficient evidence to support the claim of age
discrimination if σ (sigma) = 10.8 years? Using α = 0.05, the following are the null and
alternative hypothesis tested.
Probability Assignment 9
(i). The Null hypothesis should state that mean age of those who were laid off is less than
or equal to 42
The alternative hypothesis should state that the mean age of those laid off is greater than
42
H0:u0 ≤ 42
H1:u0 > 42
(ii).We calculate the Z-value (the test statistics)
Z=
x−u0
σ
√ n
=
45−42
10.8
√ 49
= 3
1.5428571143 =1.94
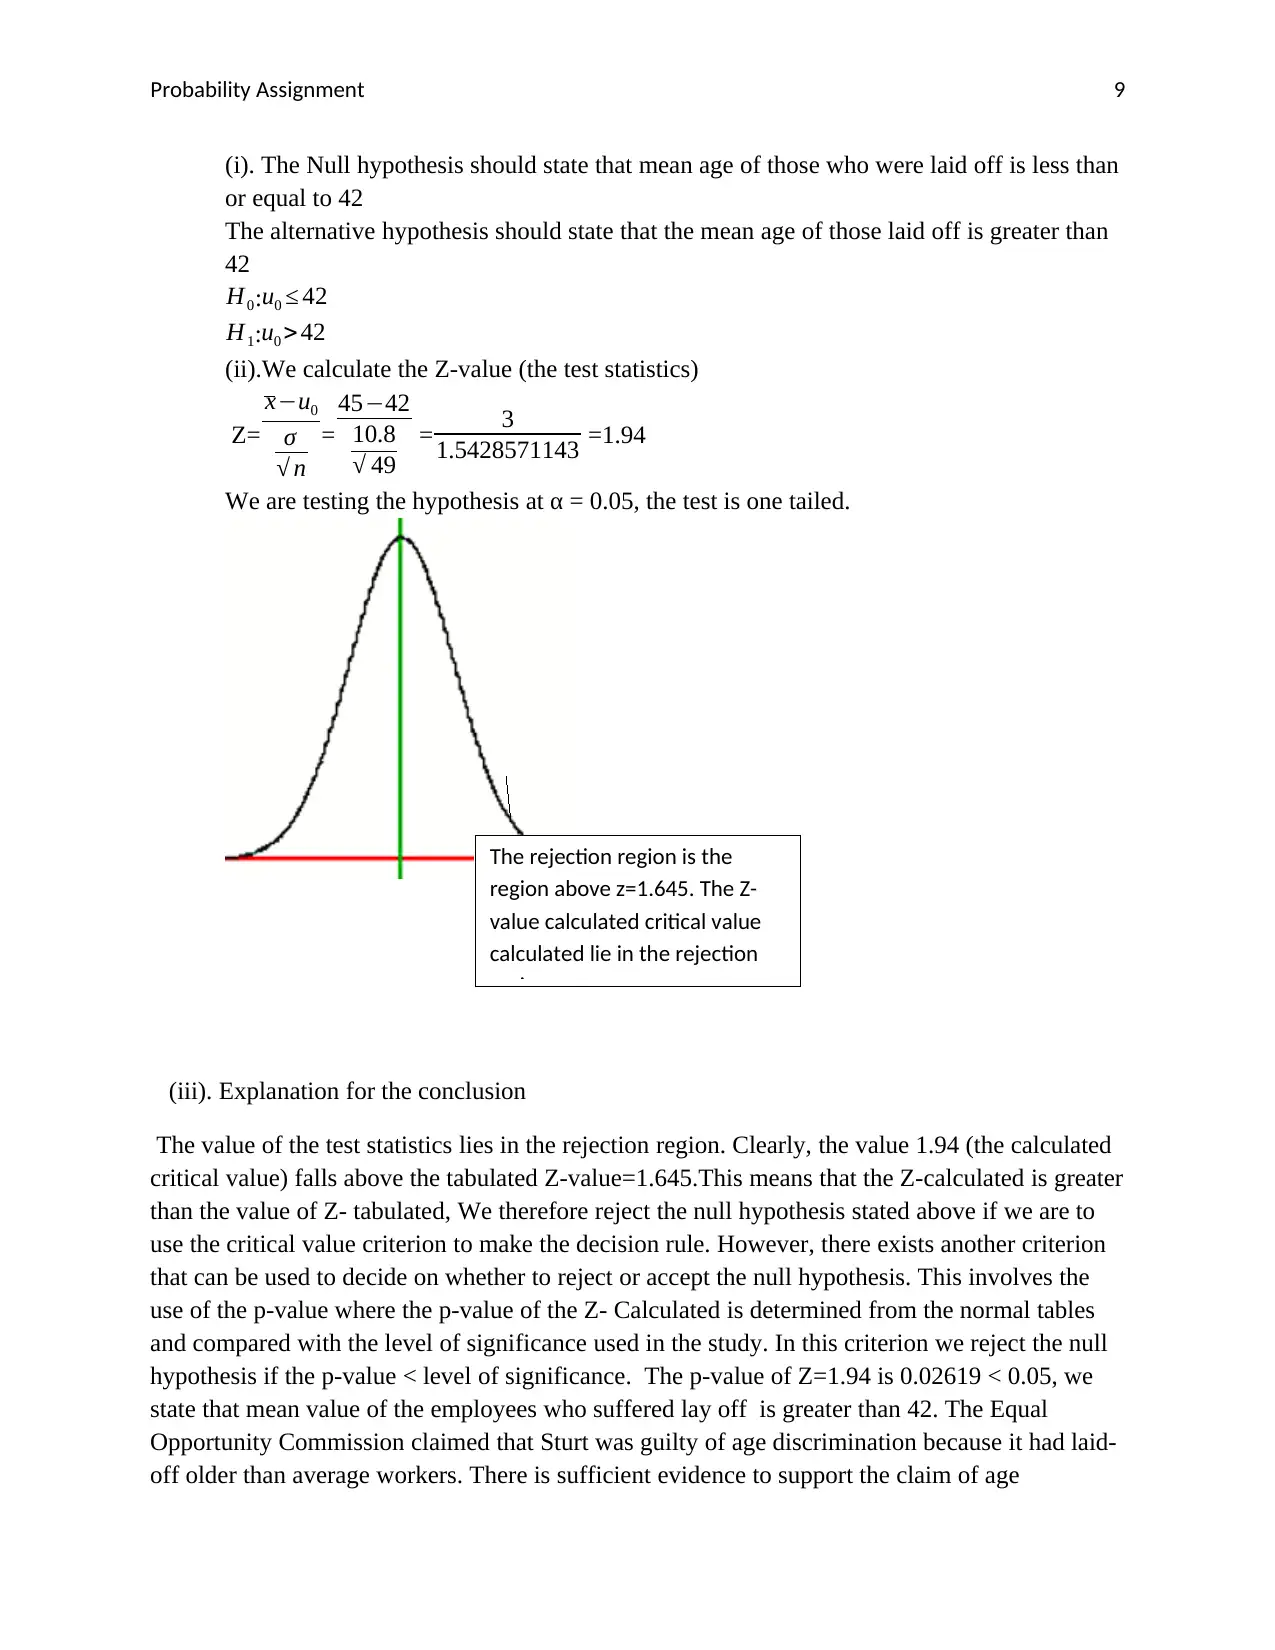
We are testing the hypothesis at α = 0.05, the test is one tailed.
(iii). Explanation for the conclusion
The value of the test statistics lies in the rejection region. Clearly, the value 1.94 (the calculated
critical value) falls above the tabulated Z-value=1.645.This means that the Z-calculated is greater
than the value of Z- tabulated, We therefore reject the null hypothesis stated above if we are to
use the critical value criterion to make the decision rule. However, there exists another criterion
that can be used to decide on whether to reject or accept the null hypothesis. This involves the
use of the p-value where the p-value of the Z- Calculated is determined from the normal tables
and compared with the level of significance used in the study. In this criterion we reject the null
hypothesis if the p-value < level of significance. The p-value of Z=1.94 is 0.02619 < 0.05, we
state that mean value of the employees who suffered lay off is greater than 42. The Equal
Opportunity Commission claimed that Sturt was guilty of age discrimination because it had laid-
off older than average workers. There is sufficient evidence to support the claim of age
The rejection region is the
region above z=1.645. The Z-
value calculated critical value
calculated lie in the rejection
region.
(i). The Null hypothesis should state that mean age of those who were laid off is less than
or equal to 42
The alternative hypothesis should state that the mean age of those laid off is greater than
42
H0:u0 ≤ 42
H1:u0 > 42
(ii).We calculate the Z-value (the test statistics)
Z=
x−u0
σ
√ n
=
45−42
10.8
√ 49
= 3
1.5428571143 =1.94
We are testing the hypothesis at α = 0.05, the test is one tailed.
(iii). Explanation for the conclusion
The value of the test statistics lies in the rejection region. Clearly, the value 1.94 (the calculated
critical value) falls above the tabulated Z-value=1.645.This means that the Z-calculated is greater
than the value of Z- tabulated, We therefore reject the null hypothesis stated above if we are to
use the critical value criterion to make the decision rule. However, there exists another criterion
that can be used to decide on whether to reject or accept the null hypothesis. This involves the
use of the p-value where the p-value of the Z- Calculated is determined from the normal tables
and compared with the level of significance used in the study. In this criterion we reject the null
hypothesis if the p-value < level of significance. The p-value of Z=1.94 is 0.02619 < 0.05, we
state that mean value of the employees who suffered lay off is greater than 42. The Equal
Opportunity Commission claimed that Sturt was guilty of age discrimination because it had laid-
off older than average workers. There is sufficient evidence to support the claim of age
The rejection region is the
region above z=1.645. The Z-
value calculated critical value
calculated lie in the rejection
region.
⊘ This is a preview!⊘
Do you want full access?
Subscribe today to unlock all pages.
Trusted by 1+ million students worldwide
Probability Assignment 10
discrimination in this case. The hypothesis test above implies that the Sturt violated the age
equality rules.
References
Dimitri, P. (2008). Introduction to Probability. London, Wiley Press.
Hartshorn, S. (2010).Hypothesis Testing: A visual Introduction to statistical Significance.
Hogg, Robert V., McKean, Joseph & and Craig, Allen T. (2005).Introduction
to Mathematical Statistics. New York, Wiley Press.
Paraphrase This Document
Need a fresh take? Get an instant paraphrase of this document with our AI Paraphraser

Probability Assignment 11
Jordan, M.(2016). Counterexamples in Probability. New York, Dover Publications Press.
Morin, D. (2016).Probability for Enthusiastic Beginners.Harvard,CreateSpace press.
Pollard, D.(2010). A User Guide to Measure theoretic probability. New York, Cambridge
University Press.
Ross, S. (2013). First Course in Probability. London, Pearson’s Education Press.
Sidney, R. (2005). A Probability Path. New York, Wiley Press.
Vaart, A. (2007). Asymptotic Statistics. New York, Cambridge University Press.
Lindley, D.(1973). Making Decisions. London: Wiley Inter Science.
1 out of 11
Related Documents


Your All-in-One AI-Powered Toolkit for Academic Success.
+13062052269
info@desklib.com
Available 24*7 on WhatsApp / Email
![[object Object]](/_next/static/media/star-bottom.7253800d.svg)
Unlock your academic potential
Copyright © 2020–2026 A2Z Services. All Rights Reserved. Developed and managed by ZUCOL.