University Econometrics Assignment: Case Study Analysis and Modeling
VerifiedAdded on 2020/04/07
|17
|3311
|188
Homework Assignment
AI Summary
This econometrics assignment presents a comprehensive analysis of two case studies. The first case study focuses on predicting the Australian spot exchange rate using New Zealand money supply as a predictor variable. The analysis includes regression, hypothesis testing for significance of variables and model, and addressing issues like autocorrelation, heteroscedasticity, and non-normality of errors. The study also involves multiple regression with various economic indicators (money supply, GDP, interest rates) and forecasting the spot exchange rate. The second case study uses a market model to analyze Apple's share price, incorporating additive and event dummy variables to assess their significance. The assignment also covers the interpretation of coefficients, model diagnostics, and the impact of economic events on financial markets.

Running head: BASIC ECONOMETRICS
Basic Econometrics
Name of the Student
Name of the University
Author note
Basic Econometrics
Name of the Student
Name of the University
Author note
Paraphrase This Document
Need a fresh take? Get an instant paraphrase of this document with our AI Paraphraser
1BASIC ECONOMETRICS
Table of Contents
Case Study One..........................................................................................................................2
Answer a.................................................................................................................................2
Answer b................................................................................................................................2
Answer c.................................................................................................................................3
Answer d................................................................................................................................3
Answer e.................................................................................................................................5
Answer f.................................................................................................................................6
Answer g................................................................................................................................7
Answer h................................................................................................................................7
Answer i.................................................................................................................................9
Answer j.................................................................................................................................9
Answer k..............................................................................................................................10
Answer i...............................................................................................................................10
Case Study Two.......................................................................................................................11
Answer a...............................................................................................................................11
Answer b..............................................................................................................................12
Answer c...............................................................................................................................12
Answer d..............................................................................................................................14
Answer e..............................................................................................................................14
Bibliography.............................................................................................................................16
2BASIC ECONOMETRICS
Case Study One
Answer a
Dependent Variable: LN_S_AUD_NZD_
Method: Least Squares
Date: 10/06/17 Time: 15:56
Sample: 3/01/1984 12/01/2015
Included observations: 128
Variable Coefficient Std. Error t-Statistic Prob.
C -0.958270 0.108660 -8.819010 0.0000
LN_NZ_MS_ 0.065974 0.009424 7.000309 0.0000
R-squared 0.280018 Mean dependent var -0.199089
Adjusted R-squared 0.274304 S.D. dependent var 0.089656
S.E. of regression 0.076376 Akaike info criterion -2.290794
Sum squared resid 0.734995 Schwarz criterion -2.246231
Log likelihood 148.6108 Hannan-Quinn criter. -2.272688
F-statistic 49.00433 Durbin-Watson stat 0.256500
Prob(F-statistic) 0.000000
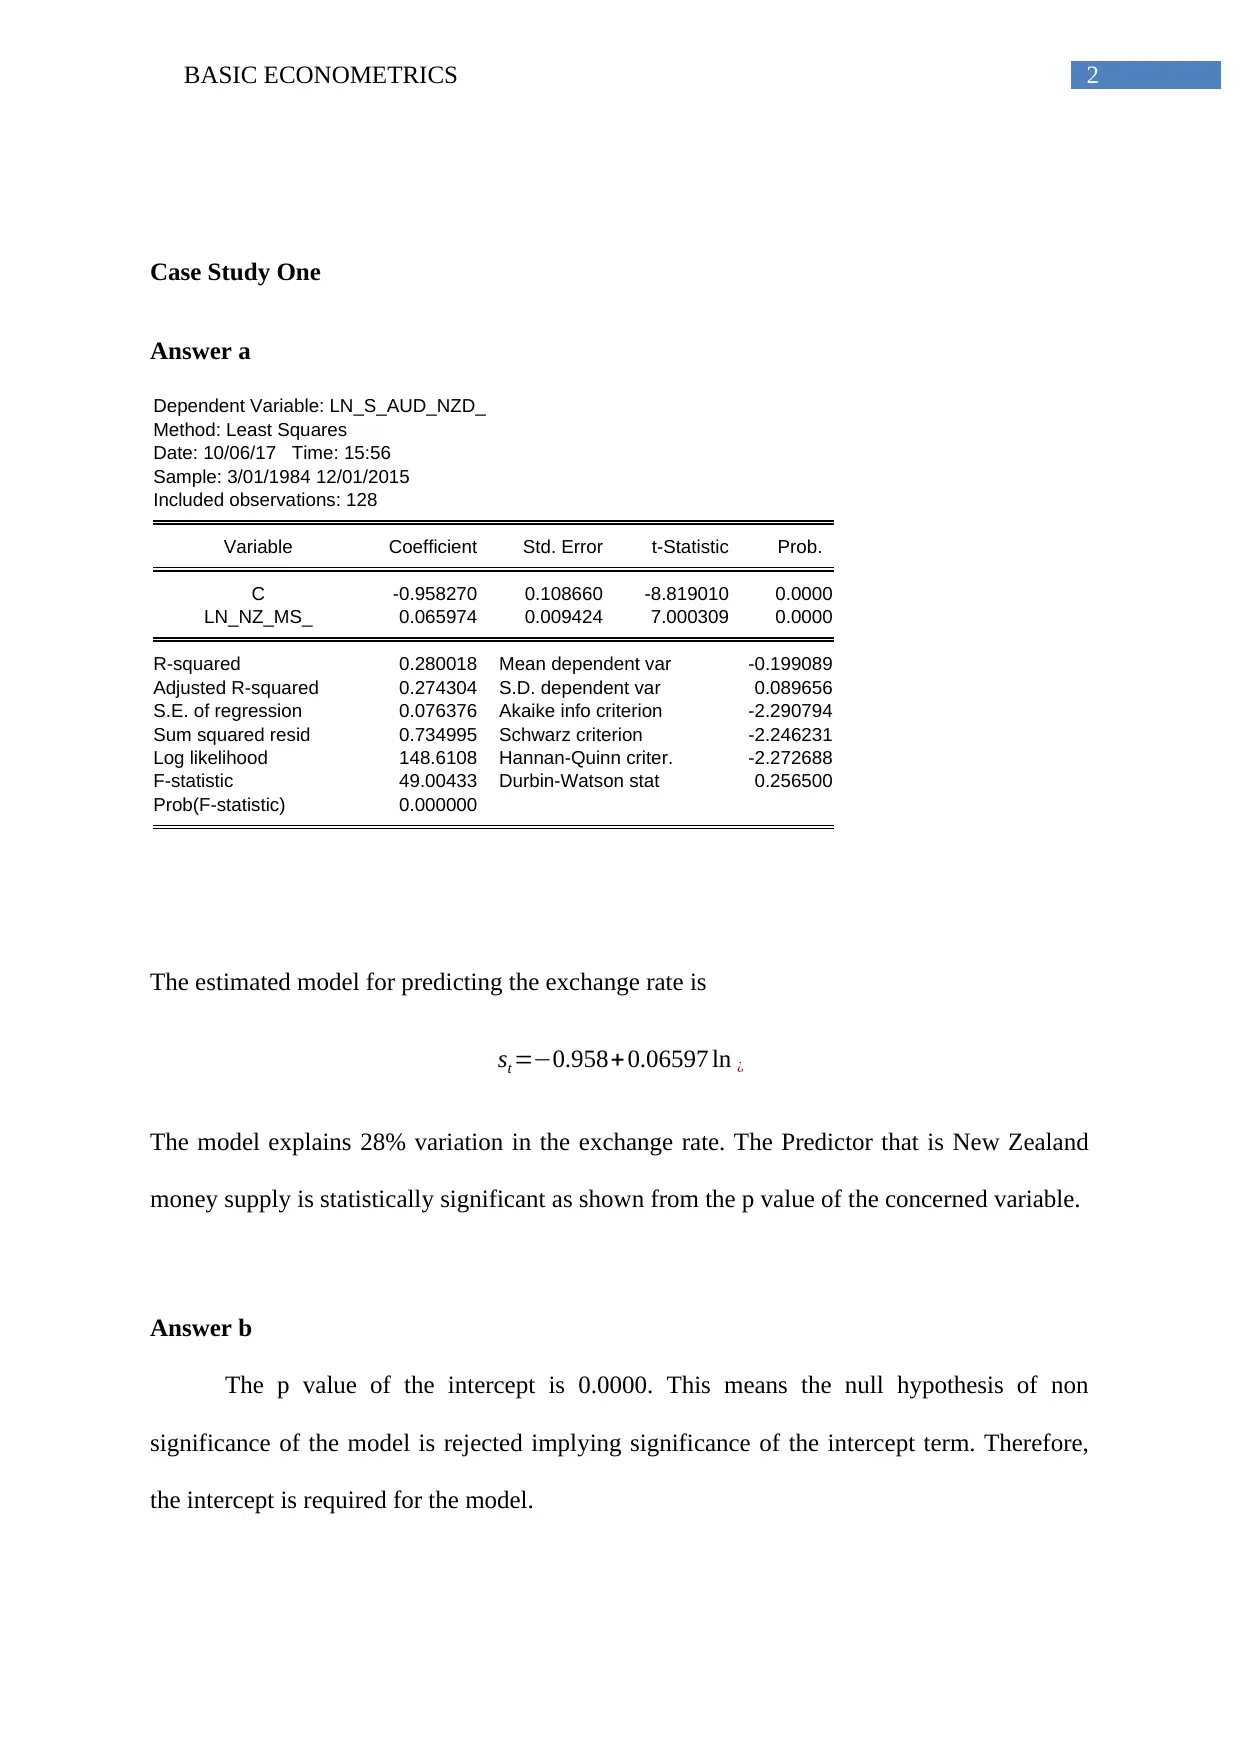
The estimated model for predicting the exchange rate is
st =−0.958+ 0.06597 ln ¿
The model explains 28% variation in the exchange rate. The Predictor that is New Zealand
money supply is statistically significant as shown from the p value of the concerned variable.
Answer b
The p value of the intercept is 0.0000. This means the null hypothesis of non
significance of the model is rejected implying significance of the intercept term. Therefore,
the intercept is required for the model.
Case Study One
Answer a
Dependent Variable: LN_S_AUD_NZD_
Method: Least Squares
Date: 10/06/17 Time: 15:56
Sample: 3/01/1984 12/01/2015
Included observations: 128
Variable Coefficient Std. Error t-Statistic Prob.
C -0.958270 0.108660 -8.819010 0.0000
LN_NZ_MS_ 0.065974 0.009424 7.000309 0.0000
R-squared 0.280018 Mean dependent var -0.199089
Adjusted R-squared 0.274304 S.D. dependent var 0.089656
S.E. of regression 0.076376 Akaike info criterion -2.290794
Sum squared resid 0.734995 Schwarz criterion -2.246231
Log likelihood 148.6108 Hannan-Quinn criter. -2.272688
F-statistic 49.00433 Durbin-Watson stat 0.256500
Prob(F-statistic) 0.000000
The estimated model for predicting the exchange rate is
st =−0.958+ 0.06597 ln ¿
The model explains 28% variation in the exchange rate. The Predictor that is New Zealand
money supply is statistically significant as shown from the p value of the concerned variable.
Answer b
The p value of the intercept is 0.0000. This means the null hypothesis of non
significance of the model is rejected implying significance of the intercept term. Therefore,
the intercept is required for the model.
⊘ This is a preview!⊘
Do you want full access?
Subscribe today to unlock all pages.
Trusted by 1+ million students worldwide
3BASIC ECONOMETRICS
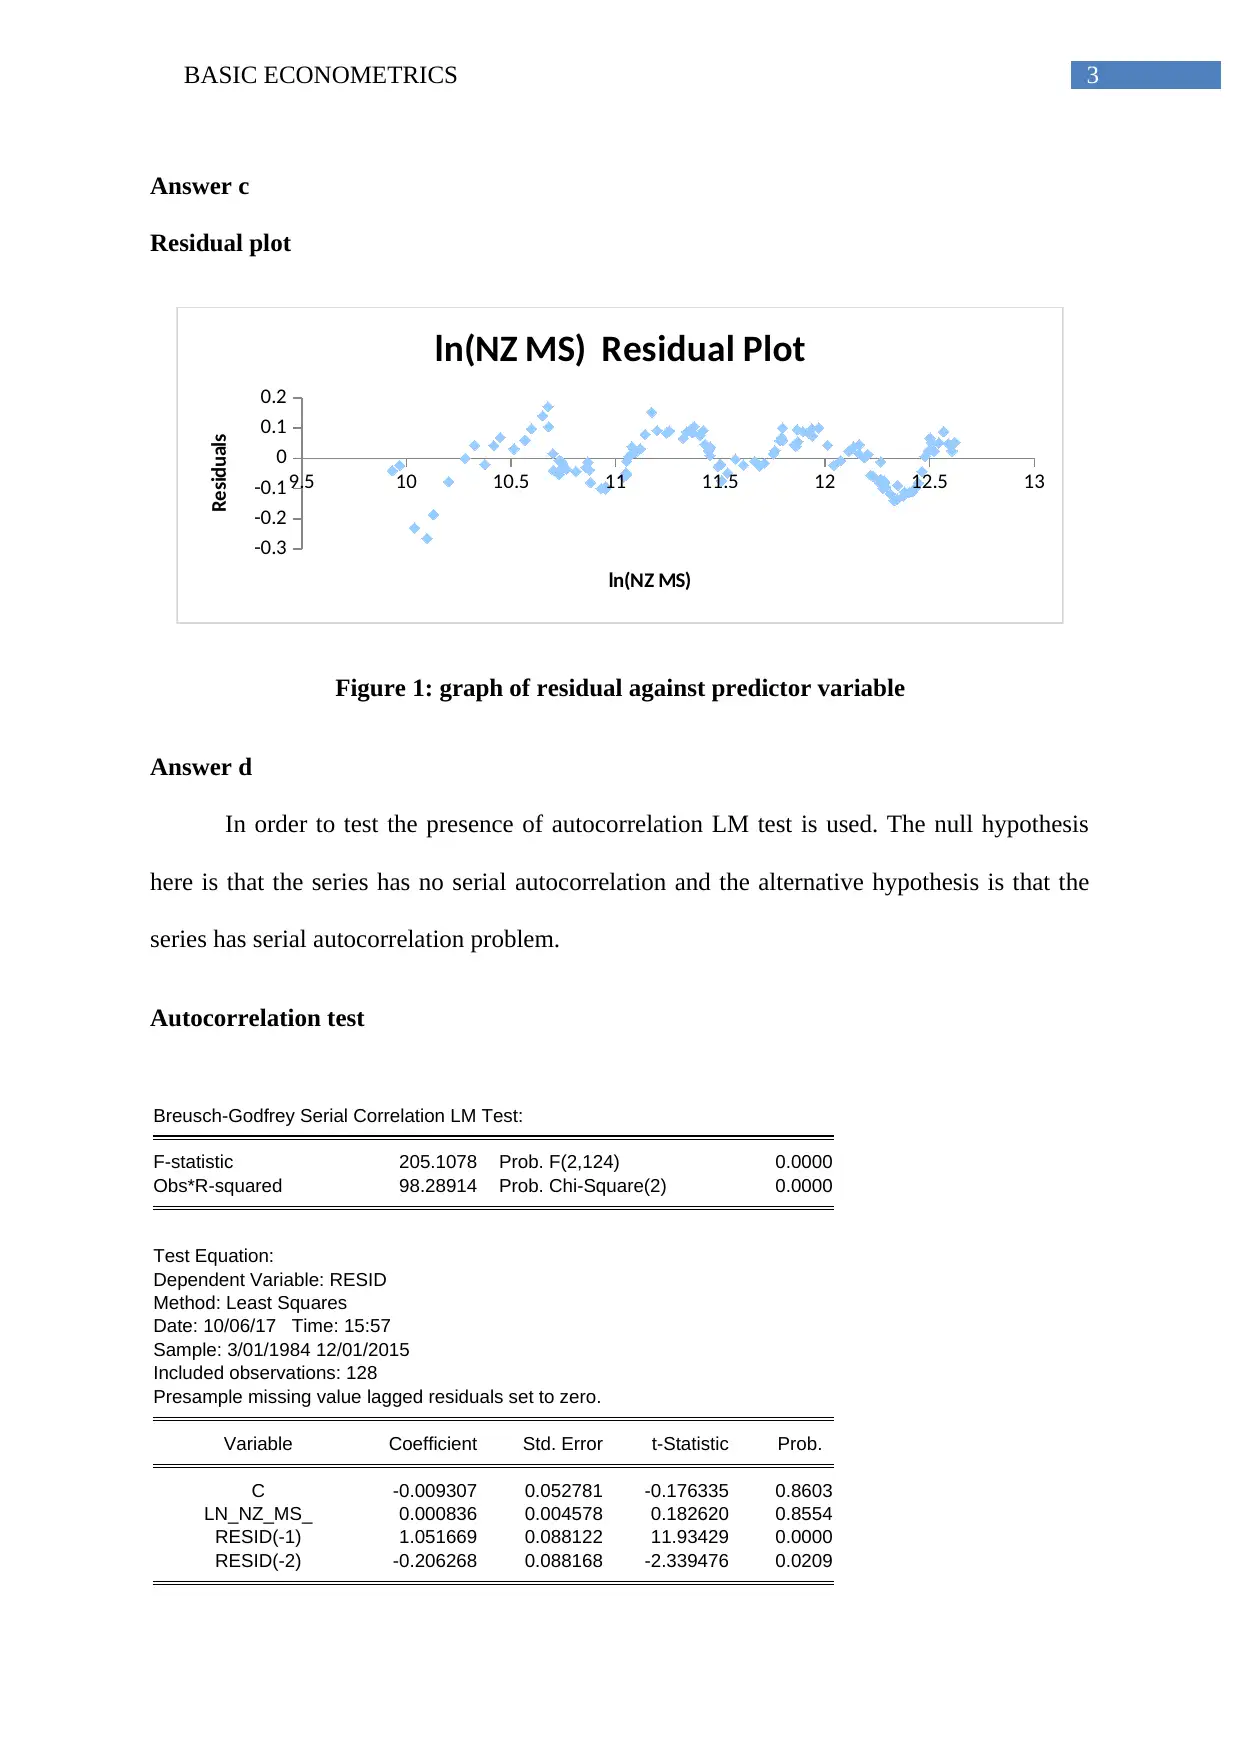
Answer c
Residual plot
9.5 10 10.5 11 11.5 12 12.5 13
-0.3
-0.2
-0.1
0
0.1
0.2
ln(NZ MS) Residual Plot
ln(NZ MS)
Residuals
Figure 1: graph of residual against predictor variable
Answer d
In order to test the presence of autocorrelation LM test is used. The null hypothesis
here is that the series has no serial autocorrelation and the alternative hypothesis is that the
series has serial autocorrelation problem.
Autocorrelation test
Breusch-Godfrey Serial Correlation LM Test:
F-statistic 205.1078 Prob. F(2,124) 0.0000
Obs*R-squared 98.28914 Prob. Chi-Square(2) 0.0000
Test Equation:
Dependent Variable: RESID
Method: Least Squares
Date: 10/06/17 Time: 15:57
Sample: 3/01/1984 12/01/2015
Included observations: 128
Presample missing value lagged residuals set to zero.
Variable Coefficient Std. Error t-Statistic Prob.
C -0.009307 0.052781 -0.176335 0.8603
LN_NZ_MS_ 0.000836 0.004578 0.182620 0.8554
RESID(-1) 1.051669 0.088122 11.93429 0.0000
RESID(-2) -0.206268 0.088168 -2.339476 0.0209
Paraphrase This Document
Need a fresh take? Get an instant paraphrase of this document with our AI Paraphraser
4BASIC ECONOMETRICS
R-squared 0.767884 Mean dependent var -3.37E-16
Adjusted R-squared 0.762268 S.D. dependent var 0.076075
S.E. of regression 0.037092 Akaike info criterion -3.720062
Sum squared resid 0.170604 Schwarz criterion -3.630936
Log likelihood 242.0840 Hannan-Quinn criter. -3.683850
F-statistic 136.7385 Durbin-Watson stat 1.959557
Prob(F-statistic) 0.000000
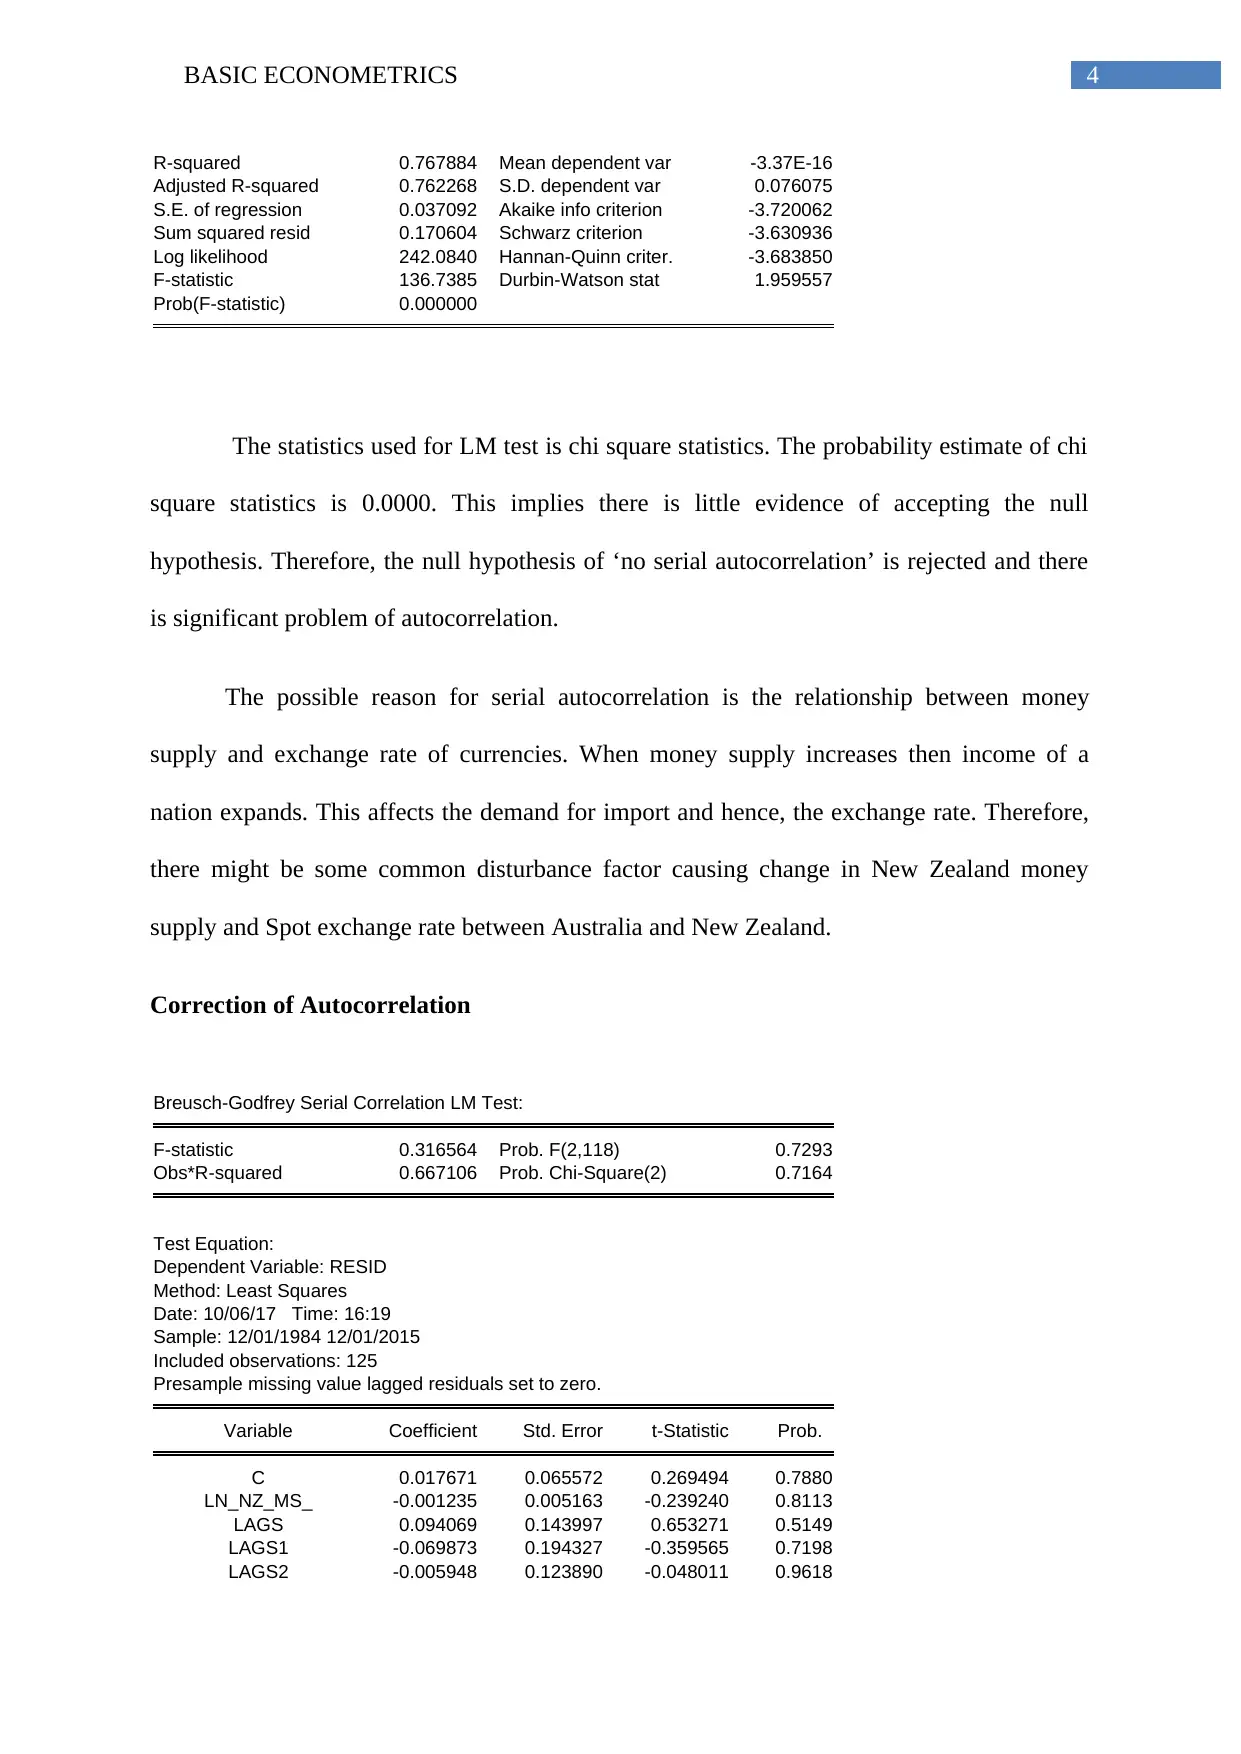
The statistics used for LM test is chi square statistics. The probability estimate of chi
square statistics is 0.0000. This implies there is little evidence of accepting the null
hypothesis. Therefore, the null hypothesis of ‘no serial autocorrelation’ is rejected and there
is significant problem of autocorrelation.
The possible reason for serial autocorrelation is the relationship between money
supply and exchange rate of currencies. When money supply increases then income of a
nation expands. This affects the demand for import and hence, the exchange rate. Therefore,
there might be some common disturbance factor causing change in New Zealand money
supply and Spot exchange rate between Australia and New Zealand.
Correction of Autocorrelation
Breusch-Godfrey Serial Correlation LM Test:
F-statistic 0.316564 Prob. F(2,118) 0.7293
Obs*R-squared 0.667106 Prob. Chi-Square(2) 0.7164
Test Equation:
Dependent Variable: RESID
Method: Least Squares
Date: 10/06/17 Time: 16:19
Sample: 12/01/1984 12/01/2015
Included observations: 125
Presample missing value lagged residuals set to zero.
Variable Coefficient Std. Error t-Statistic Prob.
C 0.017671 0.065572 0.269494 0.7880
LN_NZ_MS_ -0.001235 0.005163 -0.239240 0.8113
LAGS 0.094069 0.143997 0.653271 0.5149
LAGS1 -0.069873 0.194327 -0.359565 0.7198
LAGS2 -0.005948 0.123890 -0.048011 0.9618
R-squared 0.767884 Mean dependent var -3.37E-16
Adjusted R-squared 0.762268 S.D. dependent var 0.076075
S.E. of regression 0.037092 Akaike info criterion -3.720062
Sum squared resid 0.170604 Schwarz criterion -3.630936
Log likelihood 242.0840 Hannan-Quinn criter. -3.683850
F-statistic 136.7385 Durbin-Watson stat 1.959557
Prob(F-statistic) 0.000000
The statistics used for LM test is chi square statistics. The probability estimate of chi
square statistics is 0.0000. This implies there is little evidence of accepting the null
hypothesis. Therefore, the null hypothesis of ‘no serial autocorrelation’ is rejected and there
is significant problem of autocorrelation.
The possible reason for serial autocorrelation is the relationship between money
supply and exchange rate of currencies. When money supply increases then income of a
nation expands. This affects the demand for import and hence, the exchange rate. Therefore,
there might be some common disturbance factor causing change in New Zealand money
supply and Spot exchange rate between Australia and New Zealand.
Correction of Autocorrelation
Breusch-Godfrey Serial Correlation LM Test:
F-statistic 0.316564 Prob. F(2,118) 0.7293
Obs*R-squared 0.667106 Prob. Chi-Square(2) 0.7164
Test Equation:
Dependent Variable: RESID
Method: Least Squares
Date: 10/06/17 Time: 16:19
Sample: 12/01/1984 12/01/2015
Included observations: 125
Presample missing value lagged residuals set to zero.
Variable Coefficient Std. Error t-Statistic Prob.
C 0.017671 0.065572 0.269494 0.7880
LN_NZ_MS_ -0.001235 0.005163 -0.239240 0.8113
LAGS 0.094069 0.143997 0.653271 0.5149
LAGS1 -0.069873 0.194327 -0.359565 0.7198
LAGS2 -0.005948 0.123890 -0.048011 0.9618
5BASIC ECONOMETRICS
RESID(-1) -0.133398 0.171783 -0.776549 0.4390
RESID(-2) -0.043803 0.163434 -0.268013 0.7892
R-squared 0.005337 Mean dependent var -1.60E-17
Adjusted R-squared -0.045239 S.D. dependent var 0.031082
S.E. of regression 0.031777 Akaike info criterion -4.005764
Sum squared resid 0.119155 Schwarz criterion -3.847378
Log likelihood 257.3602 Hannan-Quinn criter. -3.941420
F-statistic 0.105521 Durbin-Watson stat 1.968802
Prob(F-statistic) 0.995657
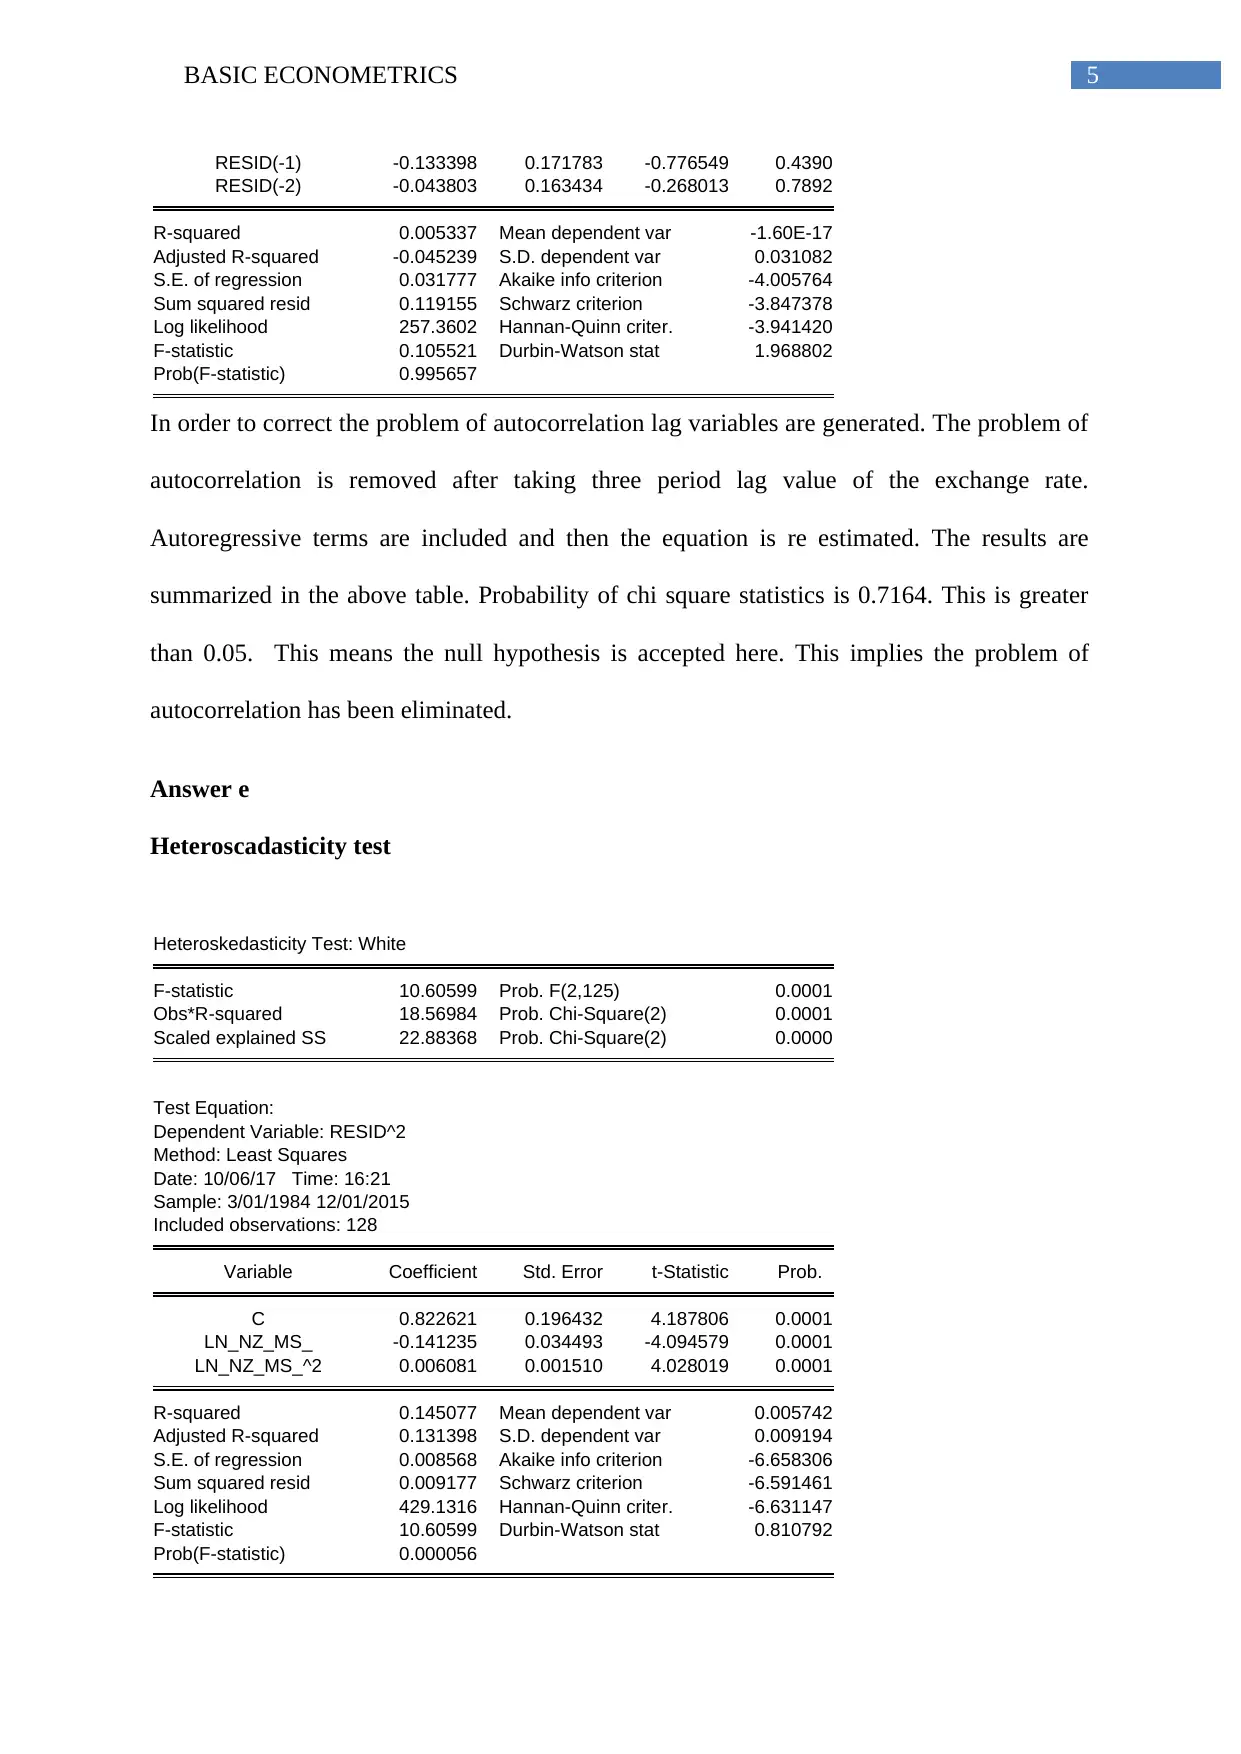
In order to correct the problem of autocorrelation lag variables are generated. The problem of
autocorrelation is removed after taking three period lag value of the exchange rate.
Autoregressive terms are included and then the equation is re estimated. The results are
summarized in the above table. Probability of chi square statistics is 0.7164. This is greater
than 0.05. This means the null hypothesis is accepted here. This implies the problem of
autocorrelation has been eliminated.
Answer e
Heteroscadasticity test
Heteroskedasticity Test: White
F-statistic 10.60599 Prob. F(2,125) 0.0001
Obs*R-squared 18.56984 Prob. Chi-Square(2) 0.0001
Scaled explained SS 22.88368 Prob. Chi-Square(2) 0.0000
Test Equation:
Dependent Variable: RESID^2
Method: Least Squares
Date: 10/06/17 Time: 16:21
Sample: 3/01/1984 12/01/2015
Included observations: 128
Variable Coefficient Std. Error t-Statistic Prob.
C 0.822621 0.196432 4.187806 0.0001
LN_NZ_MS_ -0.141235 0.034493 -4.094579 0.0001
LN_NZ_MS_^2 0.006081 0.001510 4.028019 0.0001
R-squared 0.145077 Mean dependent var 0.005742
Adjusted R-squared 0.131398 S.D. dependent var 0.009194
S.E. of regression 0.008568 Akaike info criterion -6.658306
Sum squared resid 0.009177 Schwarz criterion -6.591461
Log likelihood 429.1316 Hannan-Quinn criter. -6.631147
F-statistic 10.60599 Durbin-Watson stat 0.810792
Prob(F-statistic) 0.000056
RESID(-1) -0.133398 0.171783 -0.776549 0.4390
RESID(-2) -0.043803 0.163434 -0.268013 0.7892
R-squared 0.005337 Mean dependent var -1.60E-17
Adjusted R-squared -0.045239 S.D. dependent var 0.031082
S.E. of regression 0.031777 Akaike info criterion -4.005764
Sum squared resid 0.119155 Schwarz criterion -3.847378
Log likelihood 257.3602 Hannan-Quinn criter. -3.941420
F-statistic 0.105521 Durbin-Watson stat 1.968802
Prob(F-statistic) 0.995657
In order to correct the problem of autocorrelation lag variables are generated. The problem of
autocorrelation is removed after taking three period lag value of the exchange rate.
Autoregressive terms are included and then the equation is re estimated. The results are
summarized in the above table. Probability of chi square statistics is 0.7164. This is greater
than 0.05. This means the null hypothesis is accepted here. This implies the problem of
autocorrelation has been eliminated.
Answer e
Heteroscadasticity test
Heteroskedasticity Test: White
F-statistic 10.60599 Prob. F(2,125) 0.0001
Obs*R-squared 18.56984 Prob. Chi-Square(2) 0.0001
Scaled explained SS 22.88368 Prob. Chi-Square(2) 0.0000
Test Equation:
Dependent Variable: RESID^2
Method: Least Squares
Date: 10/06/17 Time: 16:21
Sample: 3/01/1984 12/01/2015
Included observations: 128
Variable Coefficient Std. Error t-Statistic Prob.
C 0.822621 0.196432 4.187806 0.0001
LN_NZ_MS_ -0.141235 0.034493 -4.094579 0.0001
LN_NZ_MS_^2 0.006081 0.001510 4.028019 0.0001
R-squared 0.145077 Mean dependent var 0.005742
Adjusted R-squared 0.131398 S.D. dependent var 0.009194
S.E. of regression 0.008568 Akaike info criterion -6.658306
Sum squared resid 0.009177 Schwarz criterion -6.591461
Log likelihood 429.1316 Hannan-Quinn criter. -6.631147
F-statistic 10.60599 Durbin-Watson stat 0.810792
Prob(F-statistic) 0.000056
⊘ This is a preview!⊘
Do you want full access?
Subscribe today to unlock all pages.
Trusted by 1+ million students worldwide
6BASIC ECONOMETRICS
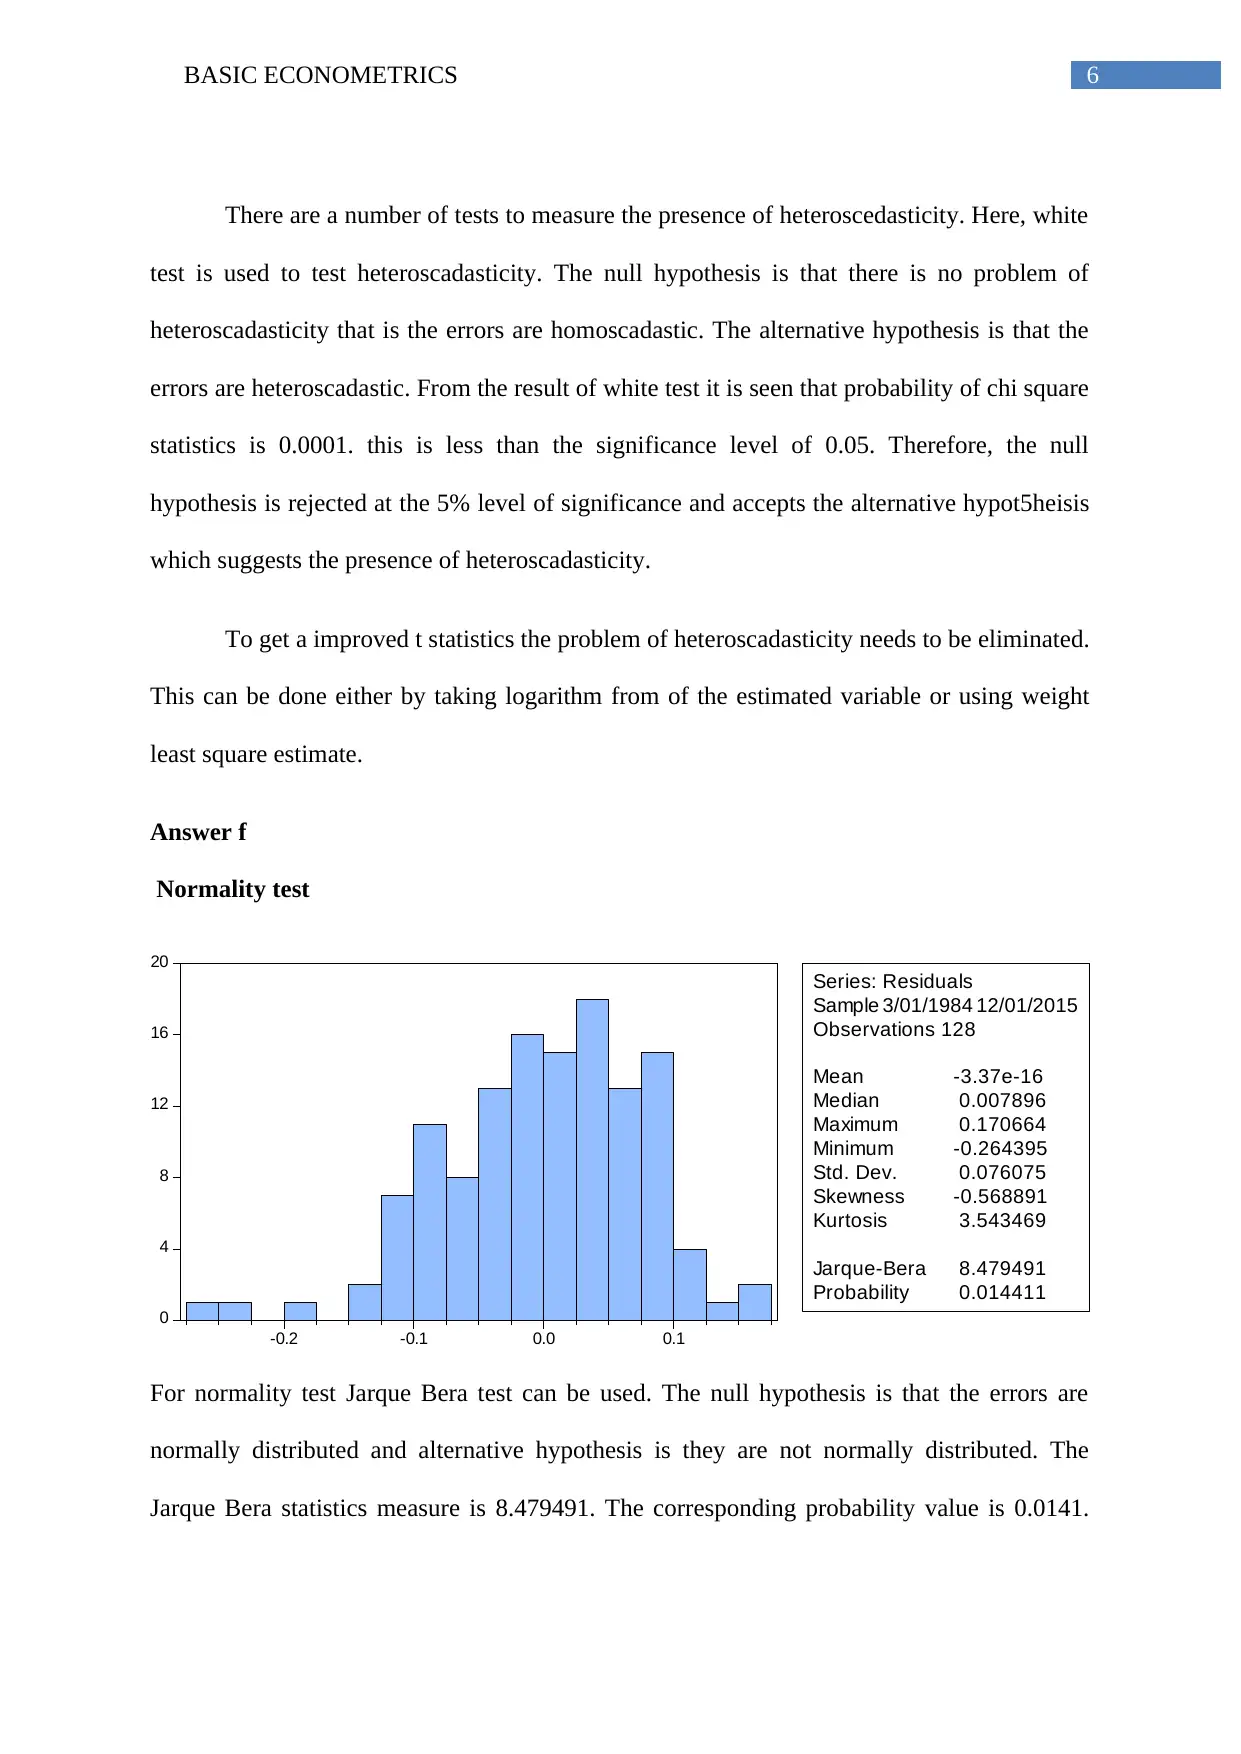
There are a number of tests to measure the presence of heteroscedasticity. Here, white
test is used to test heteroscadasticity. The null hypothesis is that there is no problem of
heteroscadasticity that is the errors are homoscadastic. The alternative hypothesis is that the
errors are heteroscadastic. From the result of white test it is seen that probability of chi square
statistics is 0.0001. this is less than the significance level of 0.05. Therefore, the null
hypothesis is rejected at the 5% level of significance and accepts the alternative hypot5heisis
which suggests the presence of heteroscadasticity.
To get a improved t statistics the problem of heteroscadasticity needs to be eliminated.
This can be done either by taking logarithm from of the estimated variable or using weight
least square estimate.
Answer f
Normality test
0
4
8
12
16
20
-0.2 -0.1 0.0 0.1
Series: Residuals
Sample 3/01/1984 12/01/2015
Observations 128
Mean -3.37e-16
Median 0.007896
Maximum 0.170664
Minimum -0.264395
Std. Dev. 0.076075
Skewness -0.568891
Kurtosis 3.543469
Jarque-Bera 8.479491
Probability 0.014411
For normality test Jarque Bera test can be used. The null hypothesis is that the errors are
normally distributed and alternative hypothesis is they are not normally distributed. The
Jarque Bera statistics measure is 8.479491. The corresponding probability value is 0.0141.
Paraphrase This Document
Need a fresh take? Get an instant paraphrase of this document with our AI Paraphraser
7BASIC ECONOMETRICS
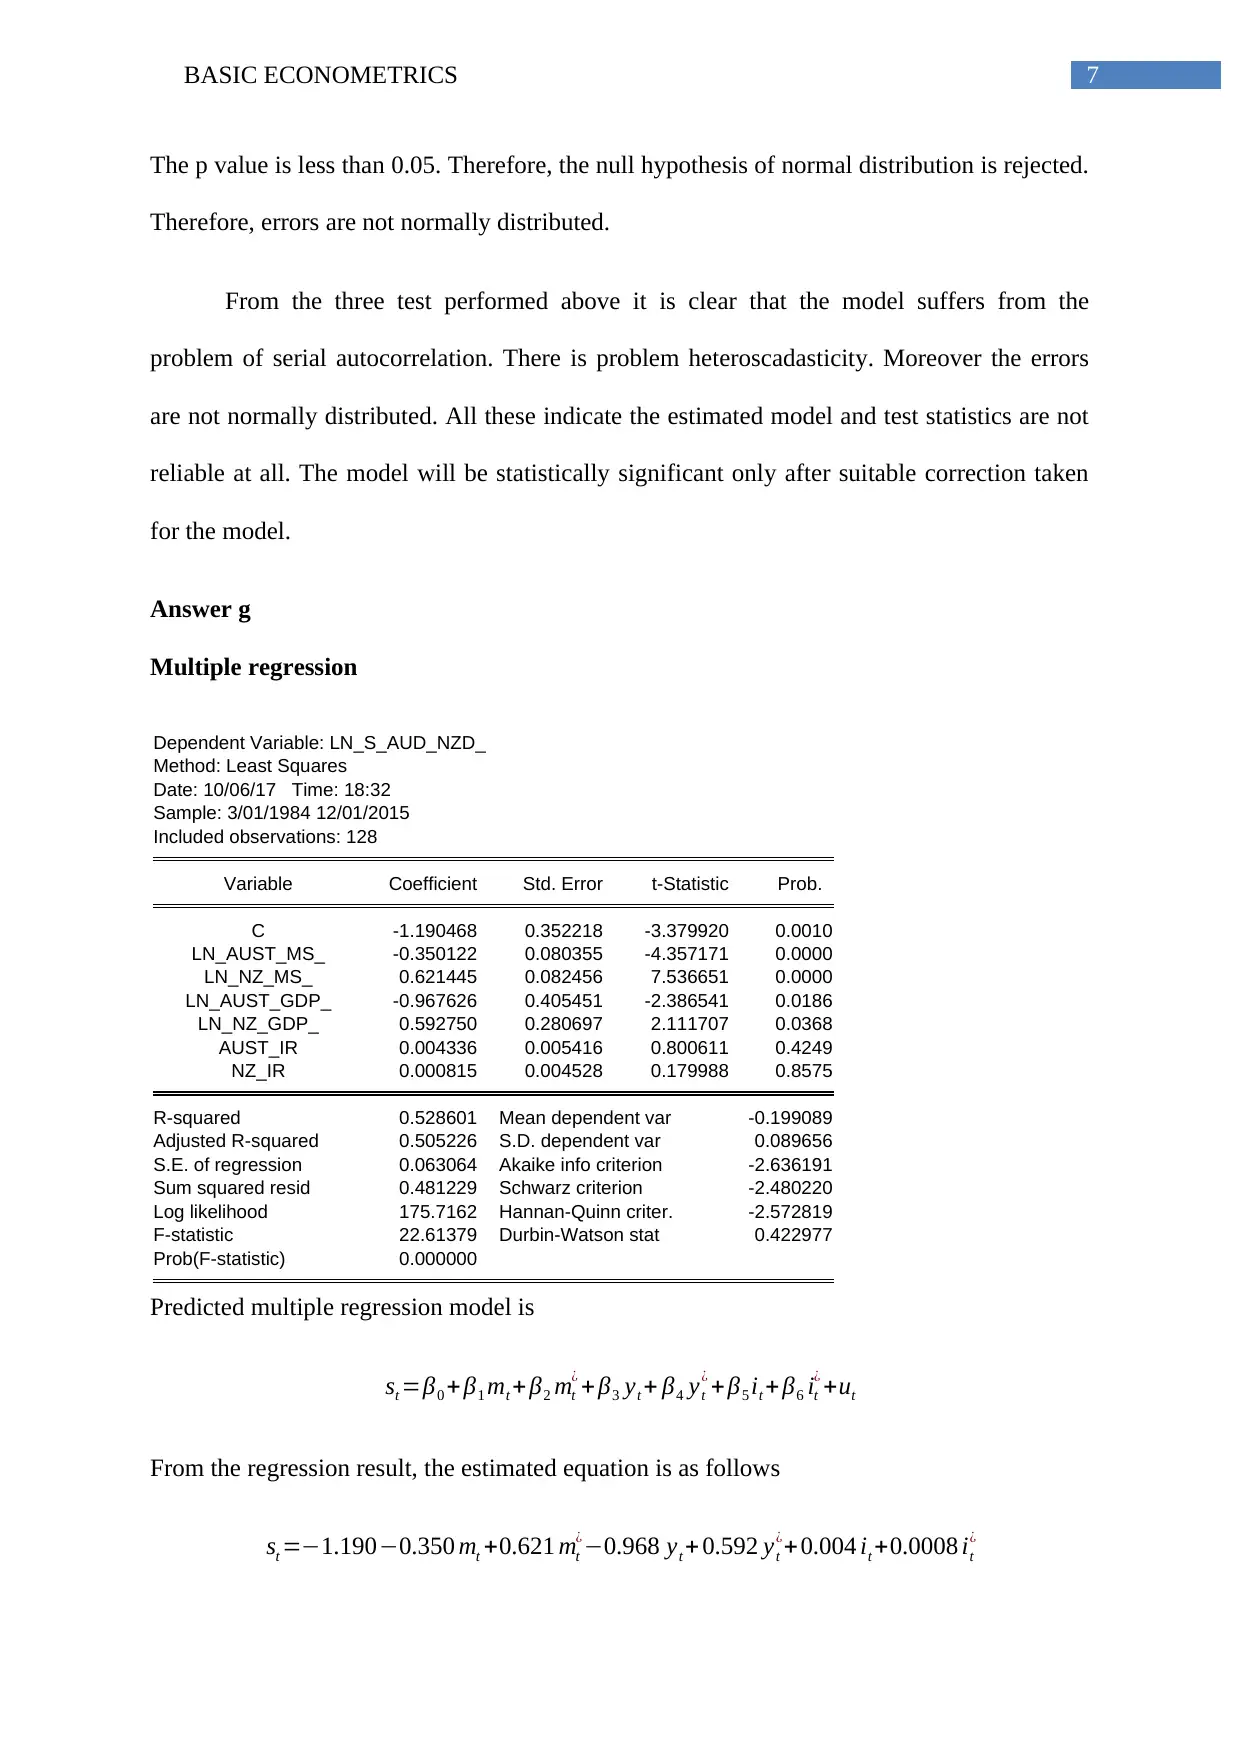
The p value is less than 0.05. Therefore, the null hypothesis of normal distribution is rejected.
Therefore, errors are not normally distributed.
From the three test performed above it is clear that the model suffers from the
problem of serial autocorrelation. There is problem heteroscadasticity. Moreover the errors
are not normally distributed. All these indicate the estimated model and test statistics are not
reliable at all. The model will be statistically significant only after suitable correction taken
for the model.
Answer g
Multiple regression
Dependent Variable: LN_S_AUD_NZD_
Method: Least Squares
Date: 10/06/17 Time: 18:32
Sample: 3/01/1984 12/01/2015
Included observations: 128
Variable Coefficient Std. Error t-Statistic Prob.
C -1.190468 0.352218 -3.379920 0.0010
LN_AUST_MS_ -0.350122 0.080355 -4.357171 0.0000
LN_NZ_MS_ 0.621445 0.082456 7.536651 0.0000
LN_AUST_GDP_ -0.967626 0.405451 -2.386541 0.0186
LN_NZ_GDP_ 0.592750 0.280697 2.111707 0.0368
AUST_IR 0.004336 0.005416 0.800611 0.4249
NZ_IR 0.000815 0.004528 0.179988 0.8575
R-squared 0.528601 Mean dependent var -0.199089
Adjusted R-squared 0.505226 S.D. dependent var 0.089656
S.E. of regression 0.063064 Akaike info criterion -2.636191
Sum squared resid 0.481229 Schwarz criterion -2.480220
Log likelihood 175.7162 Hannan-Quinn criter. -2.572819
F-statistic 22.61379 Durbin-Watson stat 0.422977
Prob(F-statistic) 0.000000
Predicted multiple regression model is
st =β0 + β1 mt + β2 mt
¿ + β3 yt + β4 yt
¿ + β5 it + β6 it
¿ +ut
From the regression result, the estimated equation is as follows
st =−1.190−0.350 mt +0.621 mt
¿−0.968 yt + 0.592 yt
¿+0.004 it +0.0008 it
¿
8BASIC ECONOMETRICS
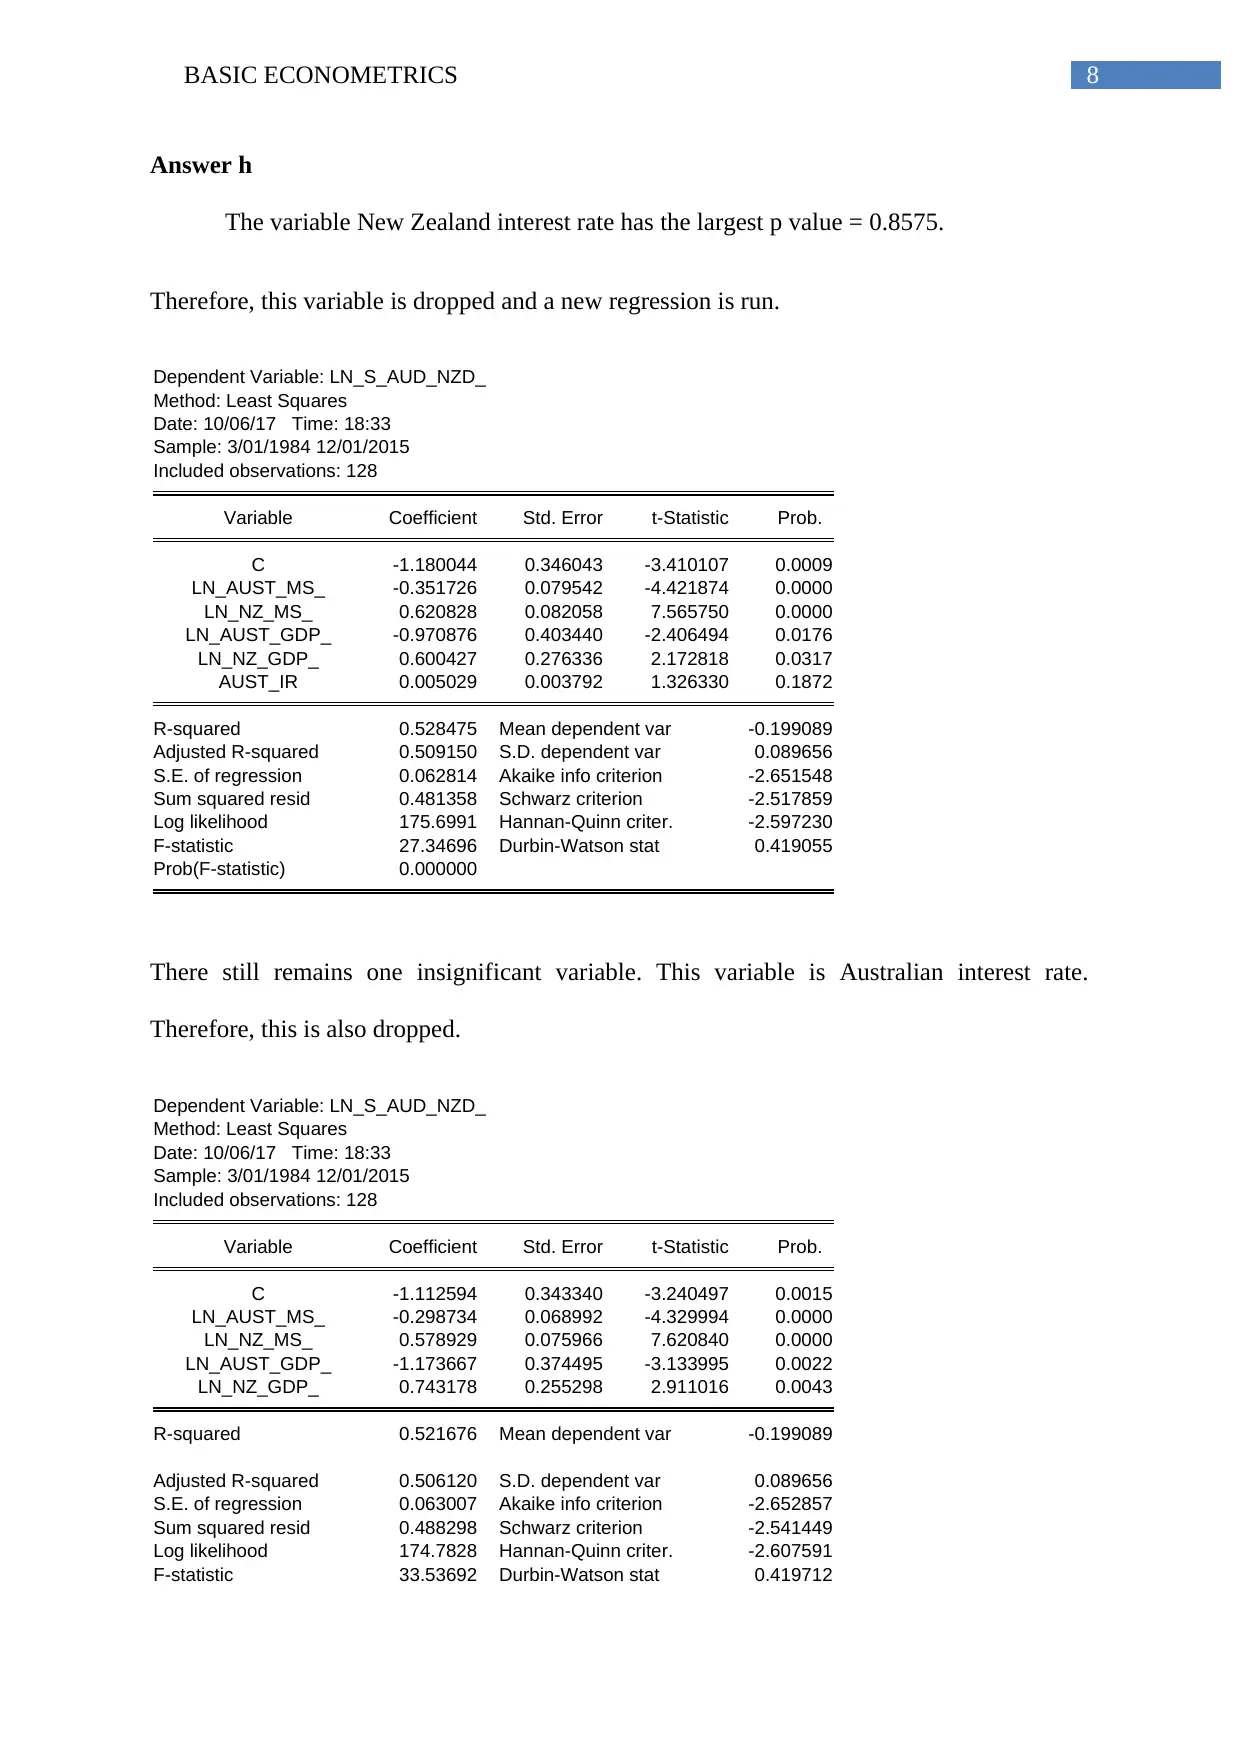
Answer h
The variable New Zealand interest rate has the largest p value = 0.8575.
Therefore, this variable is dropped and a new regression is run.
Dependent Variable: LN_S_AUD_NZD_
Method: Least Squares
Date: 10/06/17 Time: 18:33
Sample: 3/01/1984 12/01/2015
Included observations: 128
Variable Coefficient Std. Error t-Statistic Prob.
C -1.180044 0.346043 -3.410107 0.0009
LN_AUST_MS_ -0.351726 0.079542 -4.421874 0.0000
LN_NZ_MS_ 0.620828 0.082058 7.565750 0.0000
LN_AUST_GDP_ -0.970876 0.403440 -2.406494 0.0176
LN_NZ_GDP_ 0.600427 0.276336 2.172818 0.0317
AUST_IR 0.005029 0.003792 1.326330 0.1872
R-squared 0.528475 Mean dependent var -0.199089
Adjusted R-squared 0.509150 S.D. dependent var 0.089656
S.E. of regression 0.062814 Akaike info criterion -2.651548
Sum squared resid 0.481358 Schwarz criterion -2.517859
Log likelihood 175.6991 Hannan-Quinn criter. -2.597230
F-statistic 27.34696 Durbin-Watson stat 0.419055
Prob(F-statistic) 0.000000
There still remains one insignificant variable. This variable is Australian interest rate.
Therefore, this is also dropped.
Dependent Variable: LN_S_AUD_NZD_
Method: Least Squares
Date: 10/06/17 Time: 18:33
Sample: 3/01/1984 12/01/2015
Included observations: 128
Variable Coefficient Std. Error t-Statistic Prob.
C -1.112594 0.343340 -3.240497 0.0015
LN_AUST_MS_ -0.298734 0.068992 -4.329994 0.0000
LN_NZ_MS_ 0.578929 0.075966 7.620840 0.0000
LN_AUST_GDP_ -1.173667 0.374495 -3.133995 0.0022
LN_NZ_GDP_ 0.743178 0.255298 2.911016 0.0043
R-squared 0.521676 Mean dependent var -0.199089
Adjusted R-squared 0.506120 S.D. dependent var 0.089656
S.E. of regression 0.063007 Akaike info criterion -2.652857
Sum squared resid 0.488298 Schwarz criterion -2.541449
Log likelihood 174.7828 Hannan-Quinn criter. -2.607591
F-statistic 33.53692 Durbin-Watson stat 0.419712
⊘ This is a preview!⊘
Do you want full access?
Subscribe today to unlock all pages.
Trusted by 1+ million students worldwide
9BASIC ECONOMETRICS
Prob(F-statistic) 0.000000
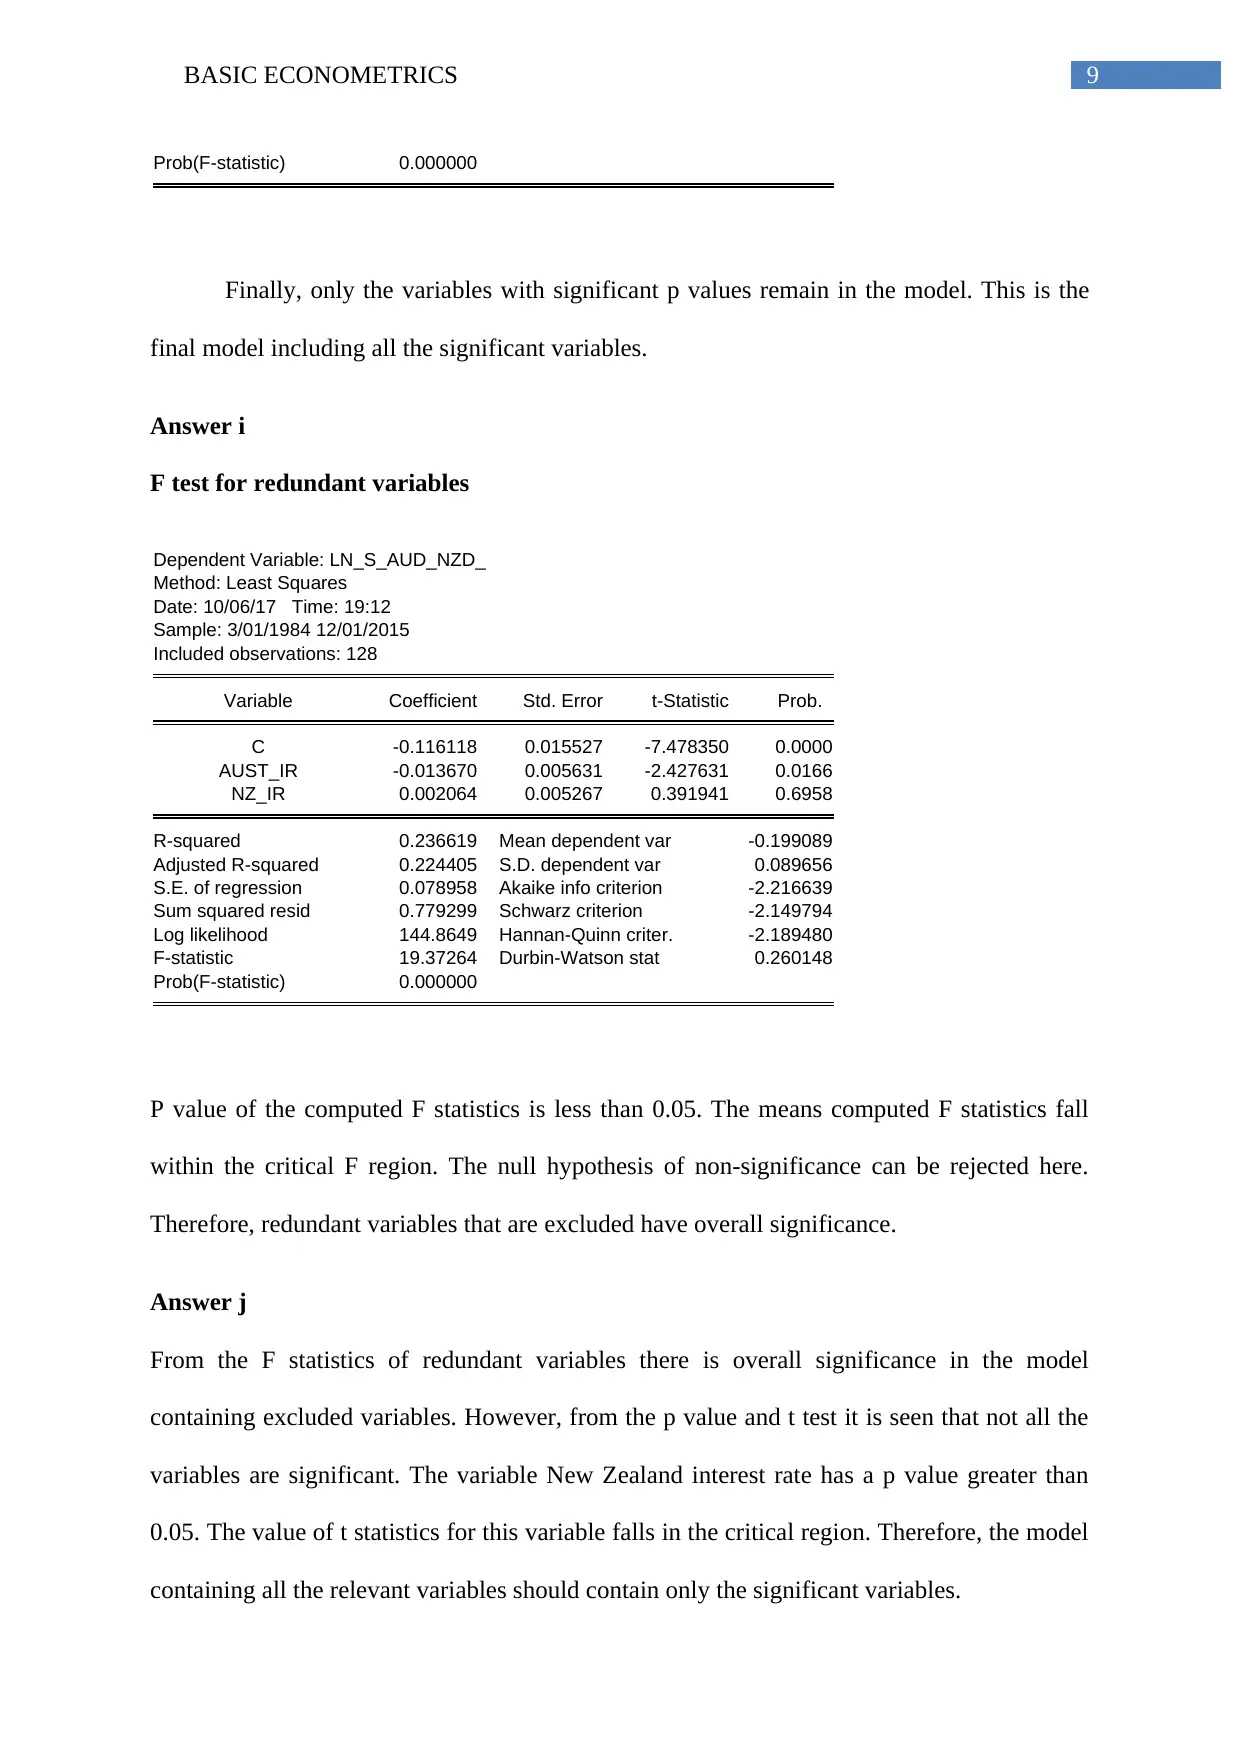
Finally, only the variables with significant p values remain in the model. This is the
final model including all the significant variables.
Answer i
F test for redundant variables
Dependent Variable: LN_S_AUD_NZD_
Method: Least Squares
Date: 10/06/17 Time: 19:12
Sample: 3/01/1984 12/01/2015
Included observations: 128
Variable Coefficient Std. Error t-Statistic Prob.
C -0.116118 0.015527 -7.478350 0.0000
AUST_IR -0.013670 0.005631 -2.427631 0.0166
NZ_IR 0.002064 0.005267 0.391941 0.6958
R-squared 0.236619 Mean dependent var -0.199089
Adjusted R-squared 0.224405 S.D. dependent var 0.089656
S.E. of regression 0.078958 Akaike info criterion -2.216639
Sum squared resid 0.779299 Schwarz criterion -2.149794
Log likelihood 144.8649 Hannan-Quinn criter. -2.189480
F-statistic 19.37264 Durbin-Watson stat 0.260148
Prob(F-statistic) 0.000000
P value of the computed F statistics is less than 0.05. The means computed F statistics fall
within the critical F region. The null hypothesis of non-significance can be rejected here.
Therefore, redundant variables that are excluded have overall significance.
Answer j
From the F statistics of redundant variables there is overall significance in the model
containing excluded variables. However, from the p value and t test it is seen that not all the
variables are significant. The variable New Zealand interest rate has a p value greater than
0.05. The value of t statistics for this variable falls in the critical region. Therefore, the model
containing all the relevant variables should contain only the significant variables.
Prob(F-statistic) 0.000000
Finally, only the variables with significant p values remain in the model. This is the
final model including all the significant variables.
Answer i
F test for redundant variables
Dependent Variable: LN_S_AUD_NZD_
Method: Least Squares
Date: 10/06/17 Time: 19:12
Sample: 3/01/1984 12/01/2015
Included observations: 128
Variable Coefficient Std. Error t-Statistic Prob.
C -0.116118 0.015527 -7.478350 0.0000
AUST_IR -0.013670 0.005631 -2.427631 0.0166
NZ_IR 0.002064 0.005267 0.391941 0.6958
R-squared 0.236619 Mean dependent var -0.199089
Adjusted R-squared 0.224405 S.D. dependent var 0.089656
S.E. of regression 0.078958 Akaike info criterion -2.216639
Sum squared resid 0.779299 Schwarz criterion -2.149794
Log likelihood 144.8649 Hannan-Quinn criter. -2.189480
F-statistic 19.37264 Durbin-Watson stat 0.260148
Prob(F-statistic) 0.000000
P value of the computed F statistics is less than 0.05. The means computed F statistics fall
within the critical F region. The null hypothesis of non-significance can be rejected here.
Therefore, redundant variables that are excluded have overall significance.
Answer j
From the F statistics of redundant variables there is overall significance in the model
containing excluded variables. However, from the p value and t test it is seen that not all the
variables are significant. The variable New Zealand interest rate has a p value greater than
0.05. The value of t statistics for this variable falls in the critical region. Therefore, the model
containing all the relevant variables should contain only the significant variables.
Paraphrase This Document
Need a fresh take? Get an instant paraphrase of this document with our AI Paraphraser
10BASIC ECONOMETRICS
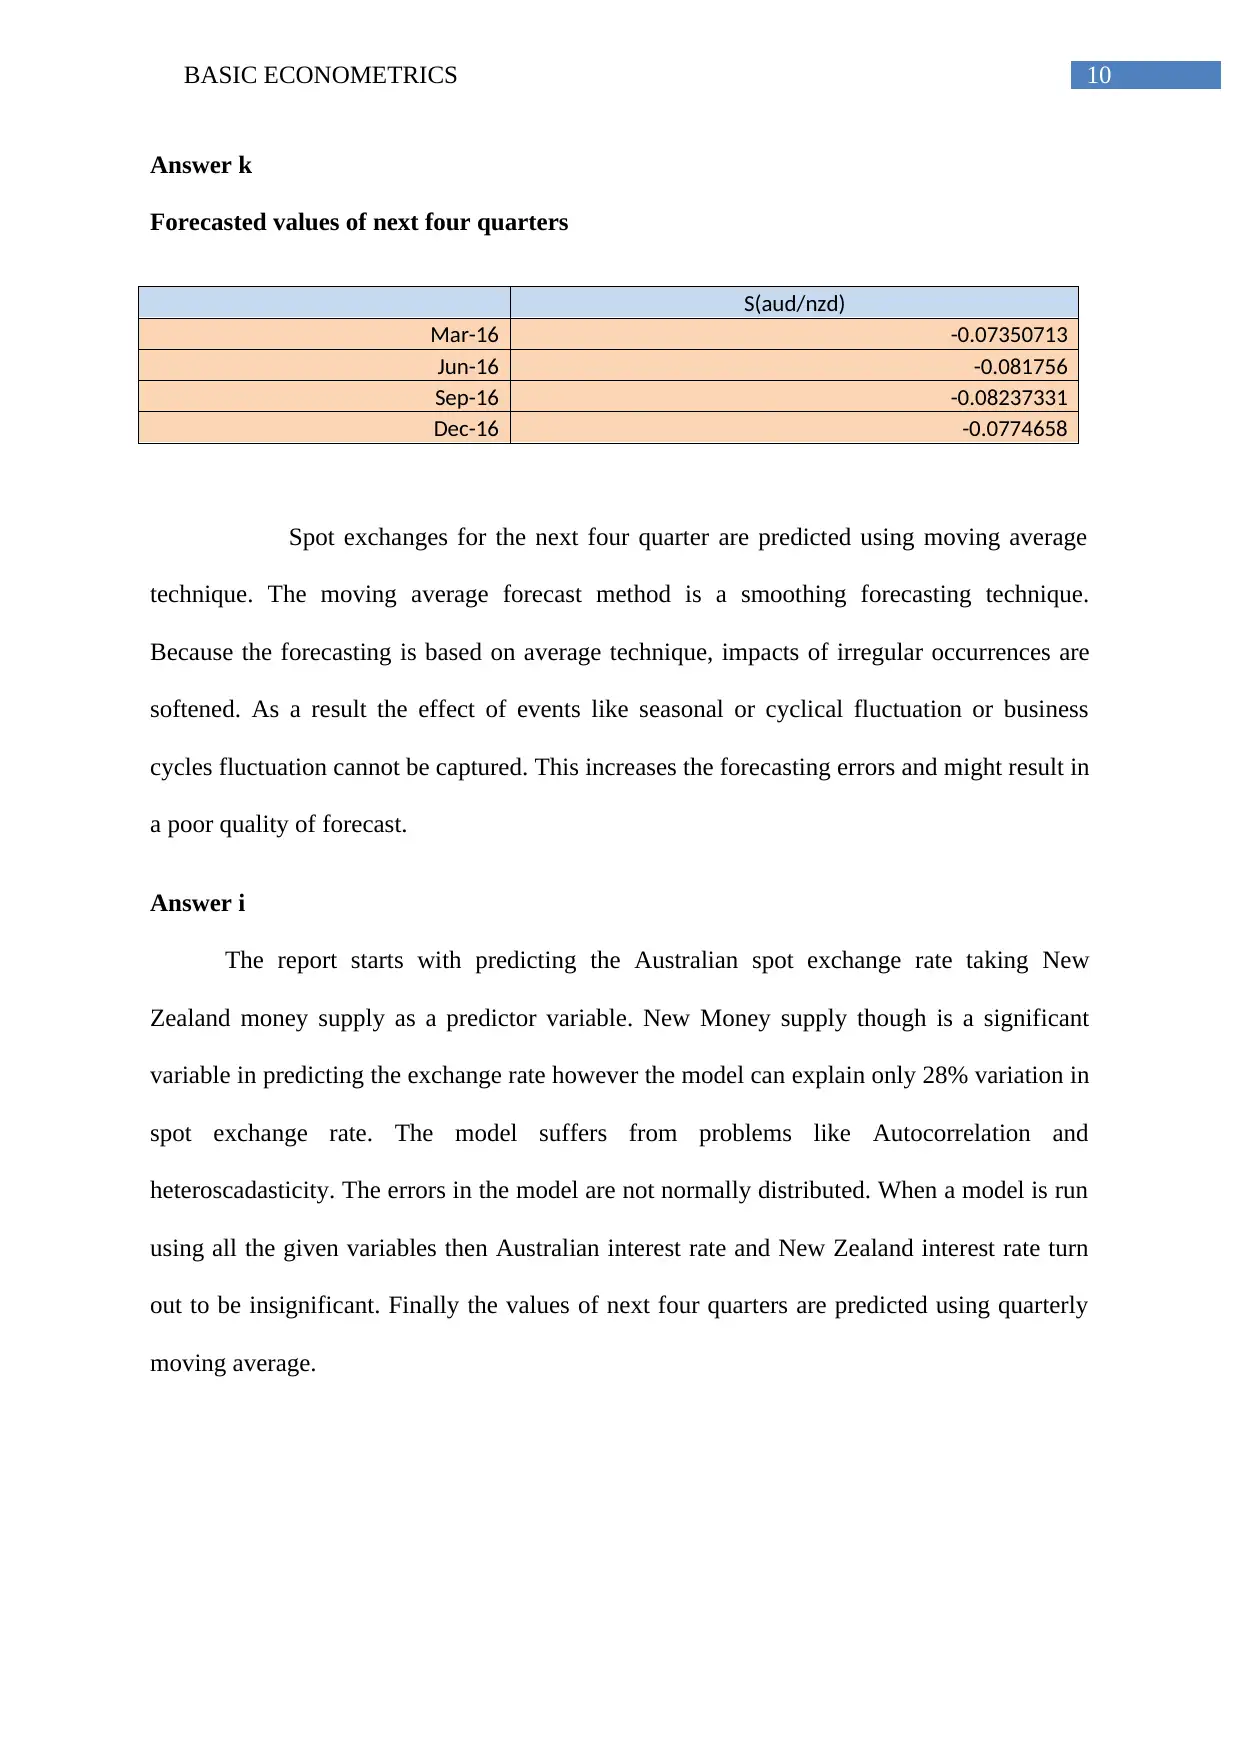
Answer k
Forecasted values of next four quarters
S(aud/nzd)
Mar-16 -0.07350713
Jun-16 -0.081756
Sep-16 -0.08237331
Dec-16 -0.0774658
Spot exchanges for the next four quarter are predicted using moving average
technique. The moving average forecast method is a smoothing forecasting technique.
Because the forecasting is based on average technique, impacts of irregular occurrences are
softened. As a result the effect of events like seasonal or cyclical fluctuation or business
cycles fluctuation cannot be captured. This increases the forecasting errors and might result in
a poor quality of forecast.
Answer i
The report starts with predicting the Australian spot exchange rate taking New
Zealand money supply as a predictor variable. New Money supply though is a significant
variable in predicting the exchange rate however the model can explain only 28% variation in
spot exchange rate. The model suffers from problems like Autocorrelation and
heteroscadasticity. The errors in the model are not normally distributed. When a model is run
using all the given variables then Australian interest rate and New Zealand interest rate turn
out to be insignificant. Finally the values of next four quarters are predicted using quarterly
moving average.
11BASIC ECONOMETRICS
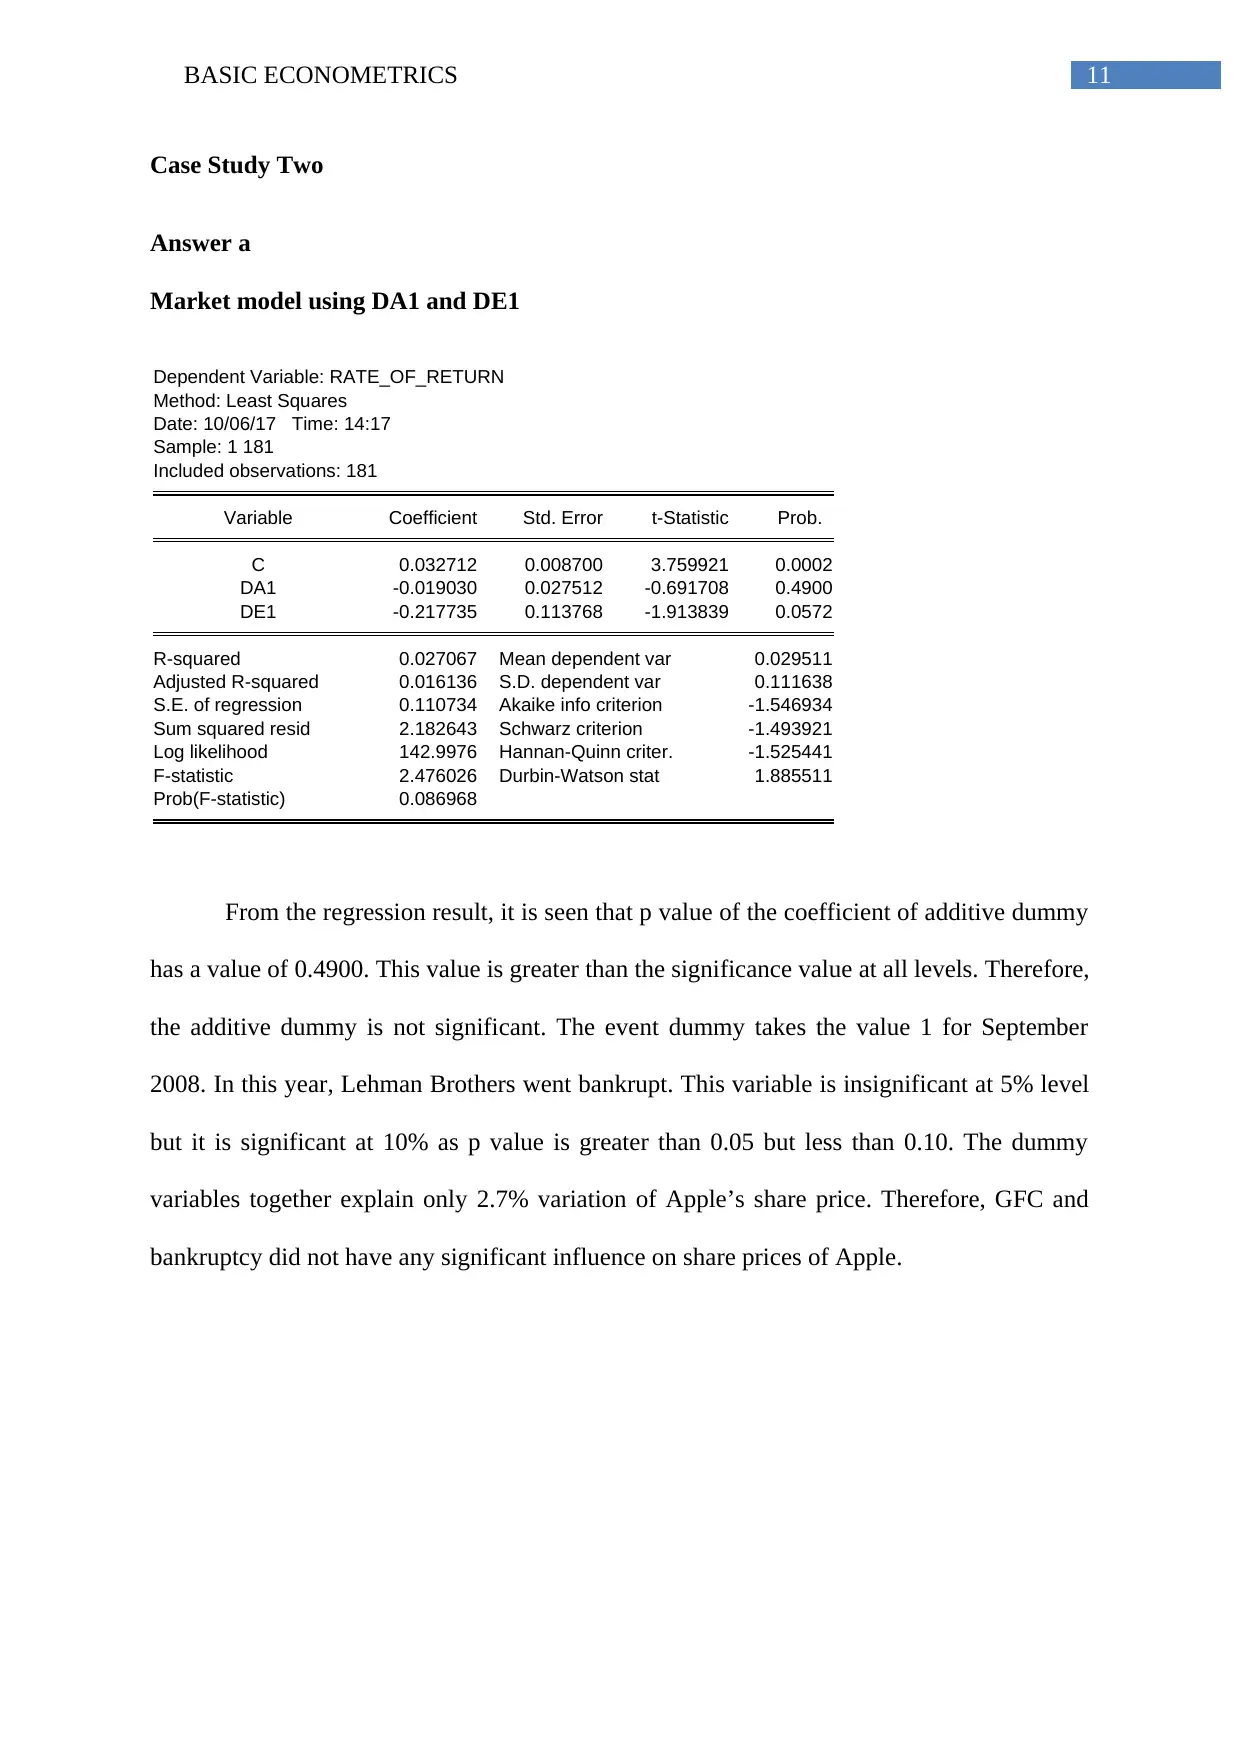
Case Study Two
Answer a
Market model using DA1 and DE1
Dependent Variable: RATE_OF_RETURN
Method: Least Squares
Date: 10/06/17 Time: 14:17
Sample: 1 181
Included observations: 181
Variable Coefficient Std. Error t-Statistic Prob.
C 0.032712 0.008700 3.759921 0.0002
DA1 -0.019030 0.027512 -0.691708 0.4900
DE1 -0.217735 0.113768 -1.913839 0.0572
R-squared 0.027067 Mean dependent var 0.029511
Adjusted R-squared 0.016136 S.D. dependent var 0.111638
S.E. of regression 0.110734 Akaike info criterion -1.546934
Sum squared resid 2.182643 Schwarz criterion -1.493921
Log likelihood 142.9976 Hannan-Quinn criter. -1.525441
F-statistic 2.476026 Durbin-Watson stat 1.885511
Prob(F-statistic) 0.086968
From the regression result, it is seen that p value of the coefficient of additive dummy
has a value of 0.4900. This value is greater than the significance value at all levels. Therefore,
the additive dummy is not significant. The event dummy takes the value 1 for September
2008. In this year, Lehman Brothers went bankrupt. This variable is insignificant at 5% level
but it is significant at 10% as p value is greater than 0.05 but less than 0.10. The dummy
variables together explain only 2.7% variation of Apple’s share price. Therefore, GFC and
bankruptcy did not have any significant influence on share prices of Apple.
⊘ This is a preview!⊘
Do you want full access?
Subscribe today to unlock all pages.
Trusted by 1+ million students worldwide
1 out of 17
Related Documents


Your All-in-One AI-Powered Toolkit for Academic Success.
+13062052269
info@desklib.com
Available 24*7 on WhatsApp / Email
![[object Object]](/_next/static/media/star-bottom.7253800d.svg)
Unlock your academic potential
Copyright © 2020–2026 A2Z Services. All Rights Reserved. Developed and managed by ZUCOL.