Probability Distribution Application: Analyzing Hockey Performance
VerifiedAdded on 2023/06/12
|7
|1257
|455
Report
AI Summary
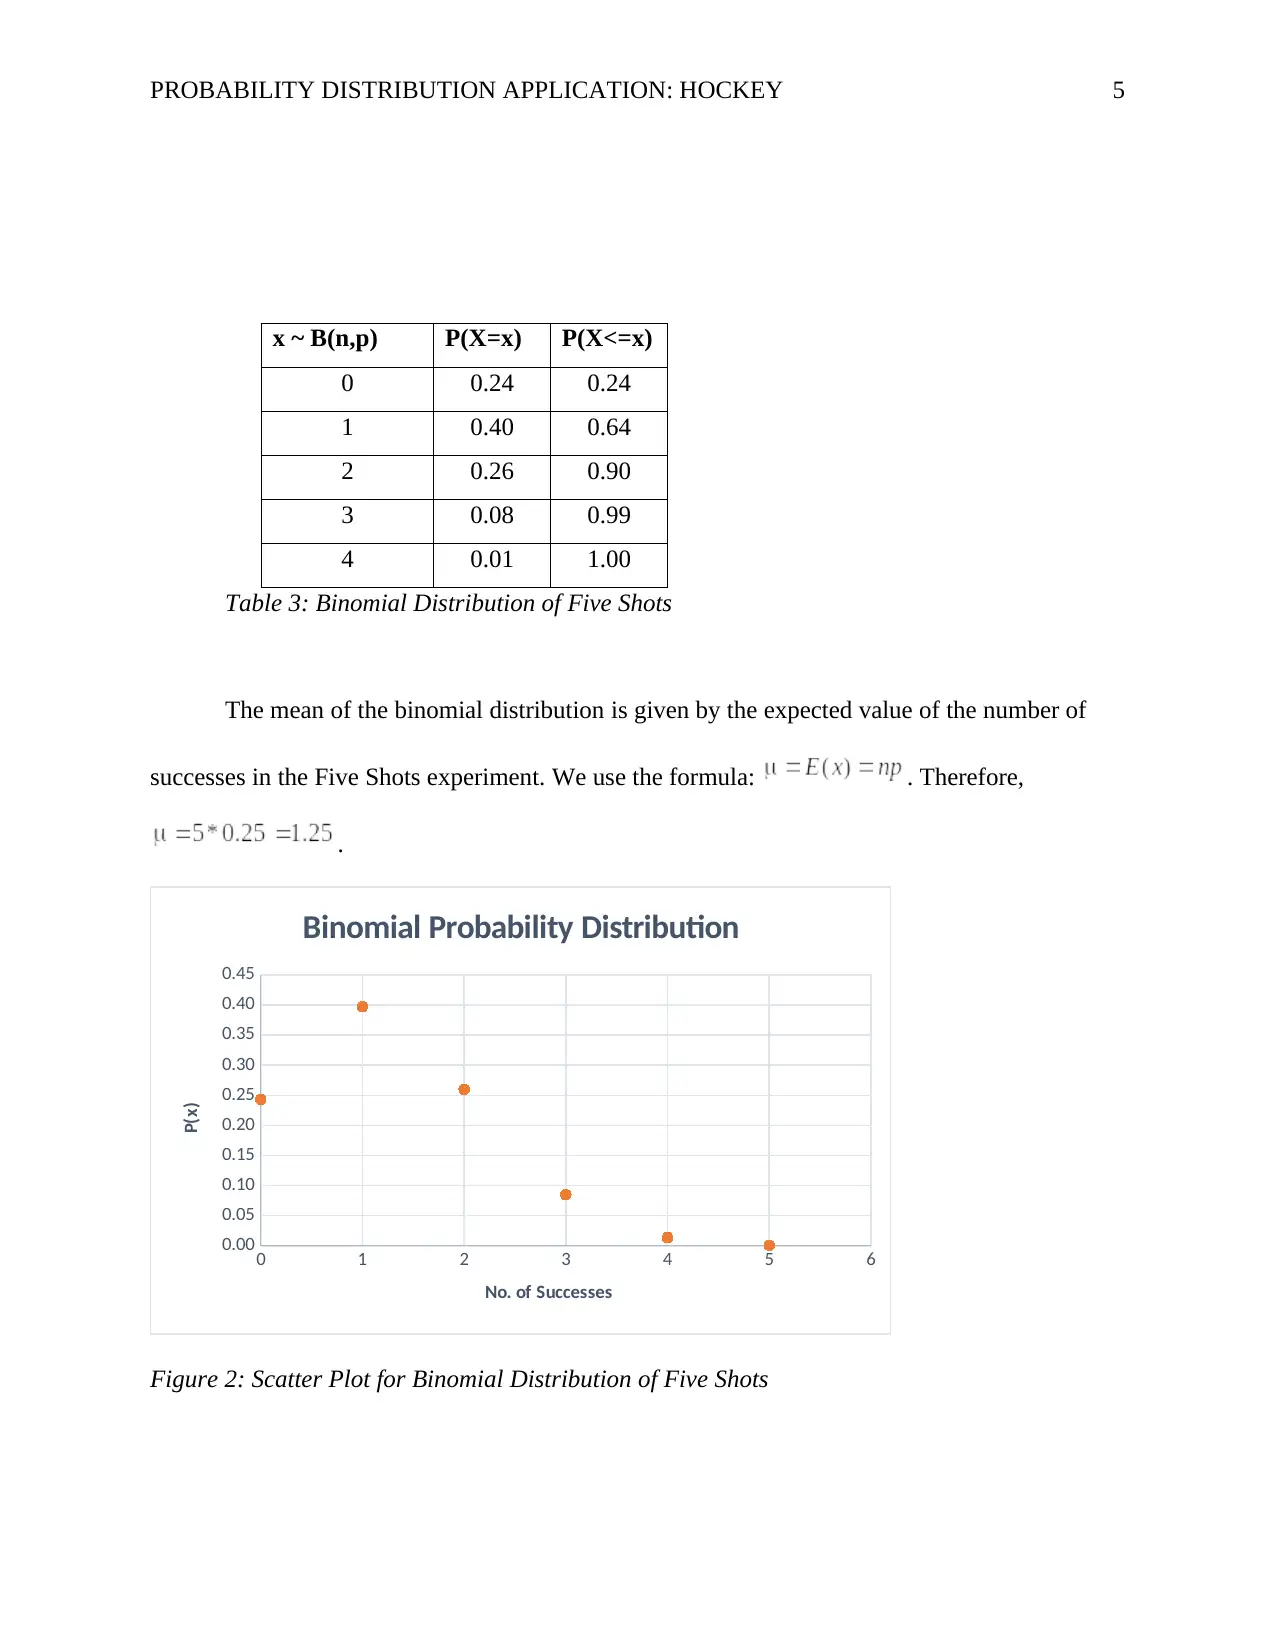
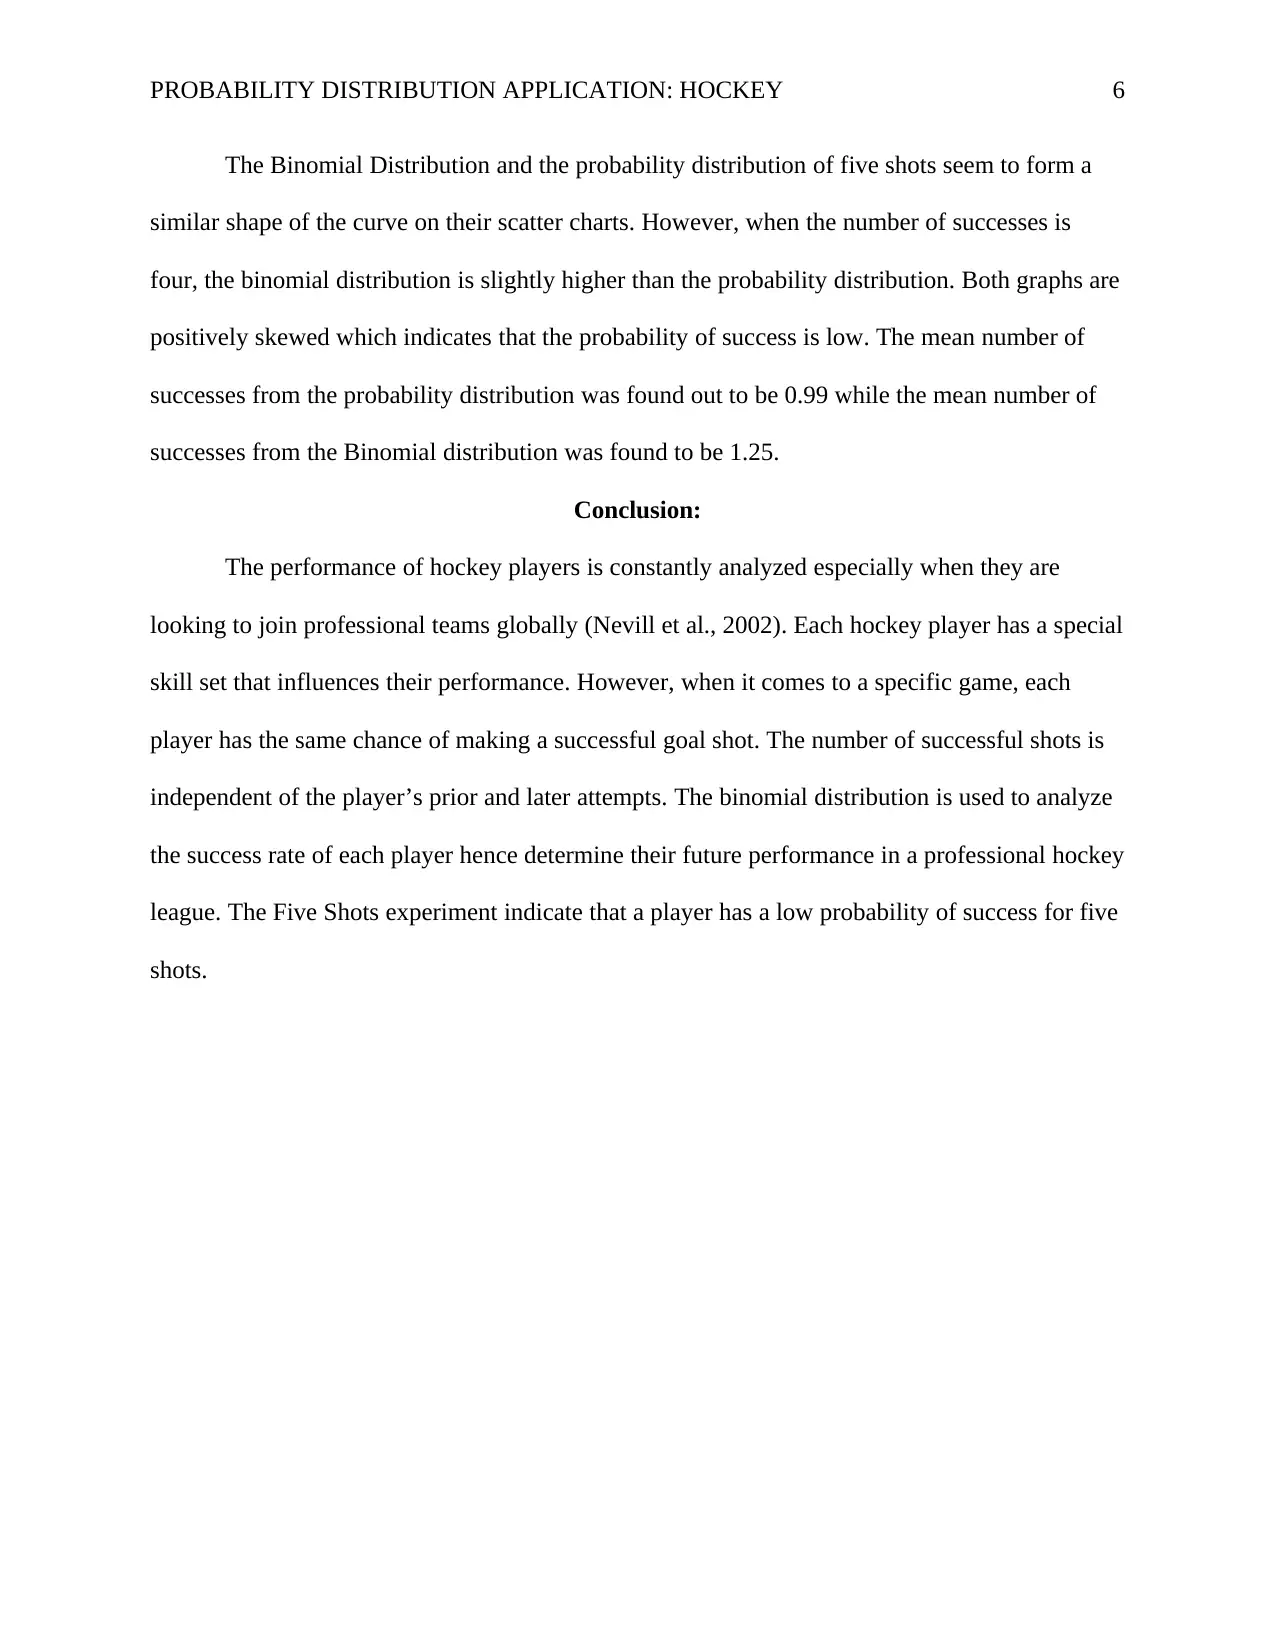
This report explores the application of probability distributions in analyzing hockey player performance, focusing on shots on goal. It examines a scenario where a player takes five shots, determining if it qualifies as a binomial experiment. The report calculates the frequency distribution, probability distribution, and success average for the player's shots. It then constructs a binomial probability distribution for five trials and compares it with the initial probability distribution, noting similarities and differences in their scatter plots and mean success rates. The analysis concludes that the binomial distribution can effectively assess a player's success rate and predict their future performance in a professional hockey league, despite the low probability of success observed in the five-shot experiment. Desklib provides similar solved assignments for students.

Running head: PROBABILITY DISTRIBUTION APPLICATION: HOCKEY 1
Probability Distribution Application: Hockey
Name of Student
Institution affiliation
Probability Distribution Application: Hockey
Name of Student
Institution affiliation
Paraphrase This Document
Need a fresh take? Get an instant paraphrase of this document with our AI Paraphraser

PROBABILITY DISTRIBUTION APPLICATION: HOCKEY 2
Introduction
Probability distributions are important in offering a basic understanding of how a natural
process seems to occur in generating events. Moreover, probability distributions allow people to
identify the likelihood of an event occurring (Anderson et al., 2014). Our problem presents a
common occurrence of hockey. We consider a hockey game where the player had exactly five
shots on goal. The success overage of the player is the number of “points scored” divided by the
number of “shots on goal.” An event refers to a process or an experiment. In this case, the event
is the shots on goal. For each trial of the event, there two possible outcomes, that is the player
scores or does not score. The analysis of shooting success is diversely used in evaluating the
performance of players in different sports such as hockey and soccer. Sports investors use such
analysis to predict the future performance of prospective players (Nevill et al., 2002).
Five Shots Binomial Experiment
For an experiment to be considered binomial, it should consist of n trials that are
statistically independent, where each trial has just two possible outcomes (Anderson et al., 2014).
In this case, we are considering a game where the player had exactly five shots. Hence, n = 5.
The likelihood of a player making a successful shot does not depend on the preceding trail rather
skills. In other words, the outcome of any trial is not affected by the outcome of earlier trials and
it does not affect the outcome of later trials (Weiers, 2010). More so, the probability of a
successful shot on goal remains the same from one trial to the next. Therefore, the conditions of
a binomial experiment are fulfilled. We consider the five shots a binomial process.
Based on the scatter plot of the five shoots, we obtain the following frequency
distribution for the number of success. Frequency distribution refers to a tabular representation of
the number of instances in which the number of successes for each trial occurs (Weiers, 2010).

PROBABILITY DISTRIBUTION APPLICATION: HOCKEY 3
The mean number of successes is given by the formula: = . In other
words, the mean number of success for Five Shots is the total shots successfully made divided by
the total shots attempted. The resulting number gives the probability of success in a given shot.
Hence, the probability that a hockey player will make a successful shoot out of five shots is 0.99.
The table below is the probability distribution of Five Shots since it links each possible outcome
(Number of successes) with its likelihood of occurrence. For instance, out of the total shots
attempted, the probability that the hockey player will make three successful shots out of five
shots is 0.03.
No. of Successes Frequency P(x)
0 23 0.34
1 25 0.37
2 18 0.26
3 2 0.03
4 0 0.00
5 0 0.00
68 1
Table 1: Frequency Distribution for Five Shots
No. of Successes Frequency
0 23
1 25
2 18
3 2
4 0
5 0
68
⊘ This is a preview!⊘
Do you want full access?
Subscribe today to unlock all pages.

Trusted by 1+ million students worldwide

PROBABILITY DISTRIBUTION APPLICATION: HOCKEY 4
Table 2: Probability Distribution of Five Shots
The scatter plot for the above probability distribution is presented in the graph below.
0 1 2 3 4 5 6
0.00
0.05
0.10
0.15
0.20
0.25
0.30
0.35
0.40
P ro b a b ility D istrib u tio n
Number of Successes
P(x)
Figure 1: Scatter Plot for Probability Distribution of Five Shots
To obtain the success average for five shots by a hockey player, we calculated the total
number of successes divided by the total number of shots. The total number of successes was
found by multiplying the number of successes by their corresponding frequencies and summing
them up. That is the total number of successes = = 67. The total number of shots is given
by the sum of the frequency of successes multipliers by for to obtain 272. Hence, the player’s
success average for five shots = .
Since the five shots process fulfilled the characteristic of binomial experiments, we went
ahead and constructs a Binomial Probability Distribution for five trials, n = 5 and probability of
success p = 0.25 as earlier obtained.
Paraphrase This Document
Need a fresh take? Get an instant paraphrase of this document with our AI Paraphraser

PROBABILITY DISTRIBUTION APPLICATION: HOCKEY 5
x ~ B(n,p) P(X=x) P(X<=x)
0 0.24 0.24
1 0.40 0.64
2 0.26 0.90
3 0.08 0.99
4 0.01 1.00
Table 3: Binomial Distribution of Five Shots
The mean of the binomial distribution is given by the expected value of the number of
successes in the Five Shots experiment. We use the formula: . Therefore,
.
0 1 2 3 4 5 6
0.00
0.05
0.10
0.15
0.20
0.25
0.30
0.35
0.40
0.45
Binomial Probability Distribution
No. of Successes
P(x)
Figure 2: Scatter Plot for Binomial Distribution of Five Shots

PROBABILITY DISTRIBUTION APPLICATION: HOCKEY 6
The Binomial Distribution and the probability distribution of five shots seem to form a
similar shape of the curve on their scatter charts. However, when the number of successes is
four, the binomial distribution is slightly higher than the probability distribution. Both graphs are
positively skewed which indicates that the probability of success is low. The mean number of
successes from the probability distribution was found out to be 0.99 while the mean number of
successes from the Binomial distribution was found to be 1.25.
Conclusion:
The performance of hockey players is constantly analyzed especially when they are
looking to join professional teams globally (Nevill et al., 2002). Each hockey player has a special
skill set that influences their performance. However, when it comes to a specific game, each
player has the same chance of making a successful goal shot. The number of successful shots is
independent of the player’s prior and later attempts. The binomial distribution is used to analyze
the success rate of each player hence determine their future performance in a professional hockey
league. The Five Shots experiment indicate that a player has a low probability of success for five
shots.
⊘ This is a preview!⊘
Do you want full access?
Subscribe today to unlock all pages.

Trusted by 1+ million students worldwide

PROBABILITY DISTRIBUTION APPLICATION: HOCKEY 7
References
Anderson, D. R., Sweeney, D. J., Williams, T. A., Camm, J. D., & Cochran, J. J.
(2014). Essentials of statistics for business and economics. Cengage Learning.
Nevill, A. M., Atkinson, G., Hughes, M. D., & Cooper, S. M. (2002). Statistical methods for
analyzing discrete and categorical data recorded in performance analysis. Journal of
Sports Sciences, 20(10), 829-844.
Weiers, R. M. (2010). Introduction to business statistics. Cengage Learning.
1 out of 7
Your All-in-One AI-Powered Toolkit for Academic Success.
+13062052269
info@desklib.com
Available 24*7 on WhatsApp / Email
Unlock your academic potential
Copyright © 2020–2026 A2Z Services. All Rights Reserved. Developed and managed by ZUCOL.
