Comprehensive Solutions to Probability Problems: Concepts and Examples
VerifiedAdded on 2019/10/18
|7
|847
|338
Homework Assignment
AI Summary
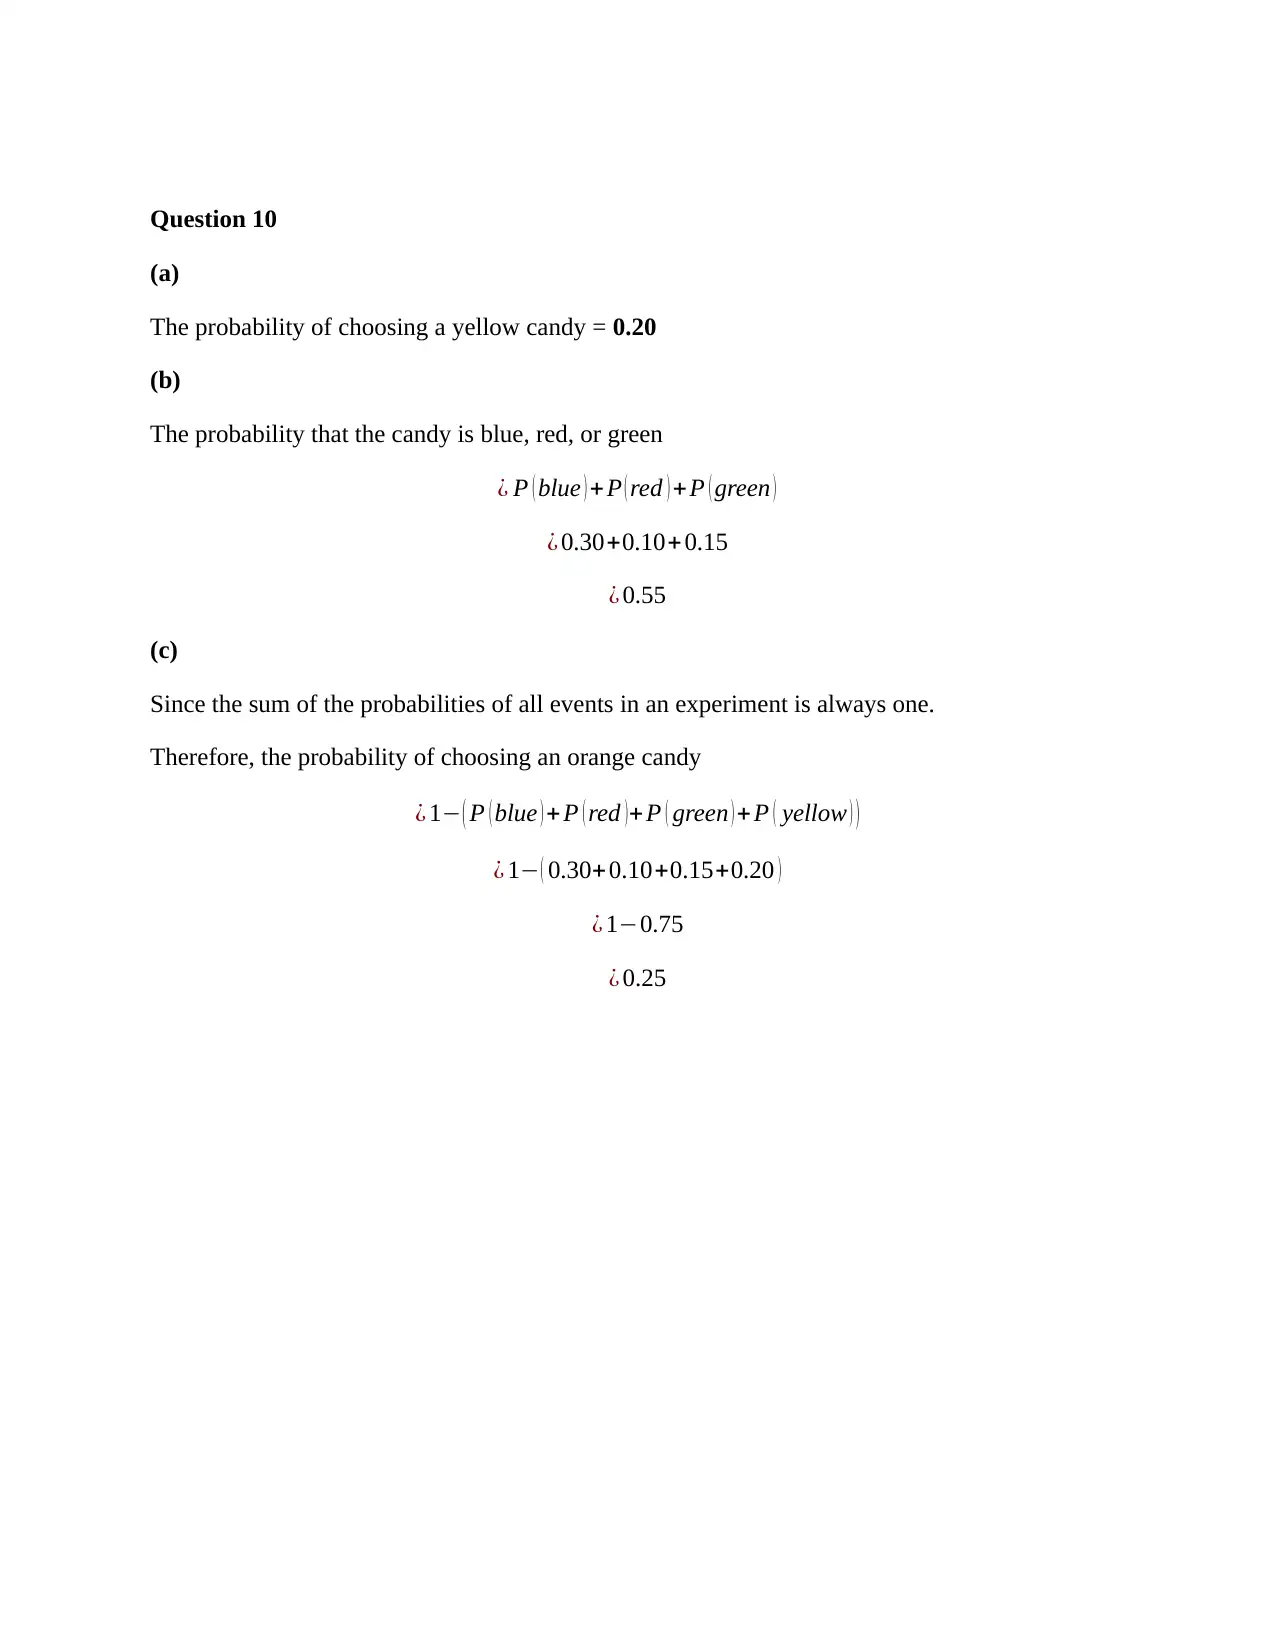
This assignment provides solutions to various probability problems, covering topics such as calculating the probability of events, understanding the difference between independent and dependent events, and differentiating between experimental and theoretical probability. Specific problems include calculating the probability of selecting someone who has traveled to Europe, determining the likelihood of a golf club member earning a certain income, and finding the probability of events related to student demographics. The solutions also address scenarios involving multiple-choice tests, candy selection, and coin tosses, illustrating the application of probability concepts in different contexts. The document emphasizes the importance of sample size in experimental probability and includes examples to clarify each concept. Desklib provides this and many other solved assignments for students.


1 out of 7

Your All-in-One AI-Powered Toolkit for Academic Success.
+13062052269
info@desklib.com
Available 24*7 on WhatsApp / Email
![[object Object]](/_next/static/media/star-bottom.7253800d.svg)
Copyright © 2020–2026 A2Z Services. All Rights Reserved. Developed and managed by ZUCOL.