Analyzing UAV Operations Safety: A Bayesian Network Risk Evaluation
VerifiedAdded on 2022/03/02
|15
|4780
|21
Project
AI Summary
This project presents a comprehensive analysis of unmanned aerial vehicle (UAV) operations, focusing on a quantitative risk assessment methodology using Bayesian Networks. The study addresses the increasing prominence of drones across various sectors, including delivery services, and emphasizes the importance of safety evaluations. The project outlines a Bayesian Network approach for modeling crash risks, utilizing real-world flight data, and includes a detailed illustrative use case involving drone delivery. The methodology encompasses risk analysis, hazard identification, and the determination of risk severity levels. Furthermore, the project explores causal and diagnostic inferences, scenario analysis, and sensitivity analysis to enhance the understanding of potential risks and mitigation strategies. The findings highlight the applicability and practicality of the proposed safety system technique, providing valuable insights for ensuring the safe and reliable operation of UAVs.
Contents
INTRODUCTION.................................................................................................................................3
PROBLEM STATEMENT....................................................................................................................3
APPROACH AND CONTRIBUTIONS...............................................................................................4
BASELINE STANDARDS AND APPROACHES...........................................................................4
OUR METHODOLOGY...................................................................................................................4
RISK ANALYSIS APPROACH FOR UAV OPERATIONS................................................................4
DESCRIPTION OF ILLUSTRATIVE USE CASE...........................................................................5
THE BAYESIAN NETWORKS TOPOLOGY.....................................................................................8
DATA COLLECTION......................................................................................................................9
USING BN NETWORK FOR REASONING THE RISK...............................................................11
CAUSAL INFERENCE..................................................................................................................11
DIAGNOSTIC INFERENCE..........................................................................................................11
SCENARIO ANALYSIS.................................................................................................................12
SCENARIOS.......................................................................................................................................12
SENSITIVITY ANALYSIS................................................................................................................13
CONCLUSIONS.................................................................................................................................14
Reference.............................................................................................................................................15
Paraphrase This Document
Need a fresh take? Get an instant paraphrase of this document with our AI Paraphraser
INTRODUCTION
Since the last several years, drones have risen to prominence as a widely used tool. Sensing,
smart cities, monitoring, disaster risk management and rehabilitation, monitoring, aerial
surveying, and border protection have all benefited from the development of these flying
robots. The use of unmanned aerial vehicles (UAVs) is on the rise, and this trend is expected
to continue. The Federal Aviation Administration in United States forecasts that number of
UAVs users probably will rise from 1.3 million to 3.45 million from 2017 and 2020,
confirming this trend. Life-saving drugs must be delivered quickly and accurately during the
"hour of need" of an accident. Additional qualities are needed to make emergency births
when medical personnel are not present in the vicinity. A secure supply chain is critical to the
use of drones in metropolitan areas to deliver medication to remote locations.
Final-mile delivery refers to the method of delivering medicinal items from local hubs, such
as pharmacies, within a short distance. Reduces pollution and travel time as well as allowing
for the delivery of customized medications after they are created in the pharmacy of a
medical clinic or a hospital. Delivery packaging must contain additional security measures to
safeguard the contents if the supply chain's security is threatened. However, in the end, urban
drone delivery might be very crucial for the transportation of medication, thereby protecting
susceptible patients from hospital-borne diseases. However, even though the first producers
of drone essential aid have effectively flown such items over long distances, nothing is
known about how drone flying impacts of these critical supplies. Although a few hurdles are
faced by the drones during the shipment. The crisis and failures faced by the pharmacy’s
drones are briefly mentioned and qualitatively analysed.
PROBLEM STATEMENT
The first step in regulating the safe use of UAVs is to conduct a safety evaluation. Various
methods have been developed for estimating the risk of an undesirable occurrence in a
system, including qualitative techniques, for UAVs. Using the Safety Management System
(SMS), the FAA, for example, has built a pre-flight assessment process that identifies risks
and measures to guarantee that no hazards arise while the UAV operates. The present
technique may not be reproducible, reliable, or visible because of its qualitative character. In
contrast, a thorough evaluation of safety necessitates quantitative analysis. According to,
statistical quantitative risk evaluations should be conducted (Zhu, 2020). As a result, for
completeness' sake, we decided to perform extensive investigations on the quantitative levels
of UAV safety evaluation. In this study, we conduct a quantitative analysis to identify
potential dangers and risks associated with teleoperated drones. The primary causes of drone
crashes are also examined to discover possible mitigation strategies that might be used to
prevent crashes and accidents. According to various system conditions and the probability of
drone crashes, we identify probability metrics for these occurrences.
APPROACH AND CONTRIBUTIONS
To remedy this issue, we offer the following: Bayesian Networks underpin this quantitative
strategy.
BASELINE STANDARDS AND APPROACHES
Probability estimates in quantitative analysis are based on model-based methodologies,
allowing for a more formal examination of systems. For quantitative risk evaluation, the
Bayesian Networks (BN) framework is often utilised. In addition, it discovers and evaluates
the probability of risk in different circumstances by capturing the relationships between
defects and illnesses. That's how we'll utilise Bayesian Networks to analyse the safety of
drones quantitatively.
OUR METHODOLOGY
Our strategy is to undertake a large-scale Internet-based investigation of the safety
implications of civilian drone use. Crash risk for UAVs is modelled using the Bayesian
approach, and the anticipated crash probability for UAV systems are examined using actual
flight data culled from the literature (Sharma, 2021). Finally, a description is provided, and
the outcomes of the simulation are explained. In conclusion, the following are the paper's
primary contributions:
It is necessary to first demonstrate the applicability and practicality of the suggested safety
system technique using a real-world use case for drone delivery.
• Secondly, we use Bayesian Networks to do a quantitative safety study.
RISK ANALYSIS APPROACH FOR UAV OPERATIONS
The risk assessment technique is a first step towards regulating the safe use of unmanned
aerial vehicles (UAVs) in national and international standards. There are a variety of ways to
evaluate the safety of unmanned aerial vehicles (UAVs) (Wang, 2021). Overall safety
framework was built and used to actual world circumstances in our example. Only a brief
⊘ This is a preview!⊘
Do you want full access?
Subscribe today to unlock all pages.
Trusted by 1+ million students worldwide
explanation of the technique was given by articles, but no explicit instructions on how to
verify it. Because the study does not depict a real-world setting, the trial prototype is lacking.
FUNCTIONAL SAFETY APPROACH
DESCRIPTION OF ILLUSTRATIVE USE CASE
It is used as an example of the safety system methodological approach to demonstrate the
usefulness of the suggested approach ever since drone delivery is now a hot subject for
several firms. Indeed, postal services in Germany and Amazon are employing drones to
deliver items to clients, as well as several other companies. For the sake of illustration, let's
imagine that a drone is on route from one metropolitan centre to another, and it's flying at a
height of less than 100 metres. The drone carries medications from the Wilmont pharmacy to
the respective customers. Drones may fly above people, cars, bridges, and other structures
(Doole, 2020). If it is feasible, the drone's flight route might be planned over non-populated
areas, it may also fly among people to reach its destination in the most efficient manner. If
you're looking at a danger and its accompanying risk, it's necessary to think about the
deployment circumstances. Flying over densely inhabited areas carries dangers that are much
greater than those encountered while flying over sparsely forested or deserted areas. A 4G
connection is also assumed to be used for drone-cloud communication; the cloud will then
transmit data from a ground station or user. Be aware that these examples are hypothetical
and may be applied to a variety of different scenarios involving Internet-controlled drones.
Additional issues arise when a drone is linked to a user over the Internet, which may result in
network delays and message loss threats. In our investigation, we'll go through these concerns
in detail. In the following sections, we present the drone delivery use case's functional safety
analysis in detail.
1) PHASE 1:
a: RISK ANALYSIS
The first step is to conduct a risk analysis, which begins with the defining of system
limitations. The UVA's system restrictions are shown in the table below. As shown, there are
five distinct types of drone restrictions:
Limits of I the body, (ii) the time, (iii) the environment, (iv) behaviour, and (v) social
networks. Examples and limitations are provided in Table 1, which covers the five categories
Paraphrase This Document
Need a fresh take? Get an instant paraphrase of this document with our AI Paraphraser
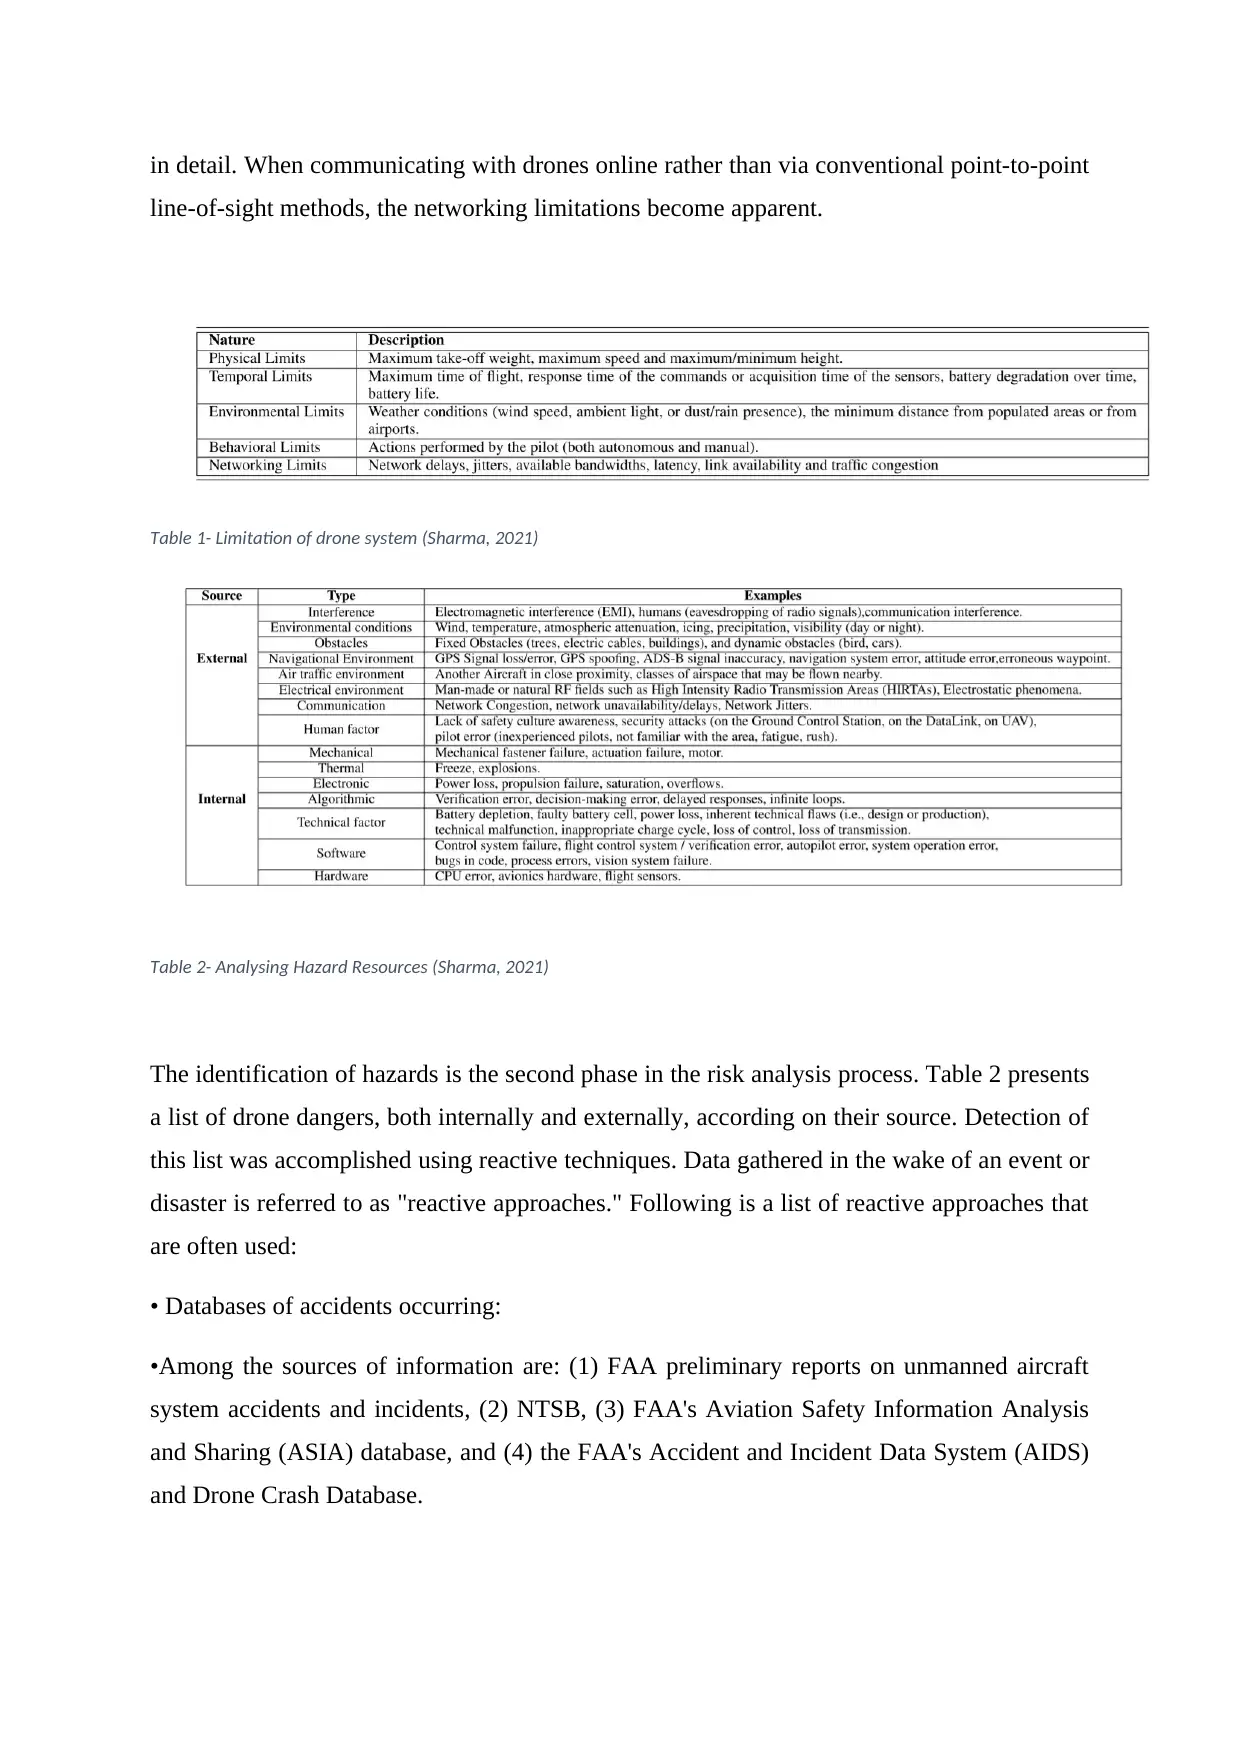
in detail. When communicating with drones online rather than via conventional point-to-point
line-of-sight methods, the networking limitations become apparent.
Table 1- Limitation of drone system (Sharma, 2021)
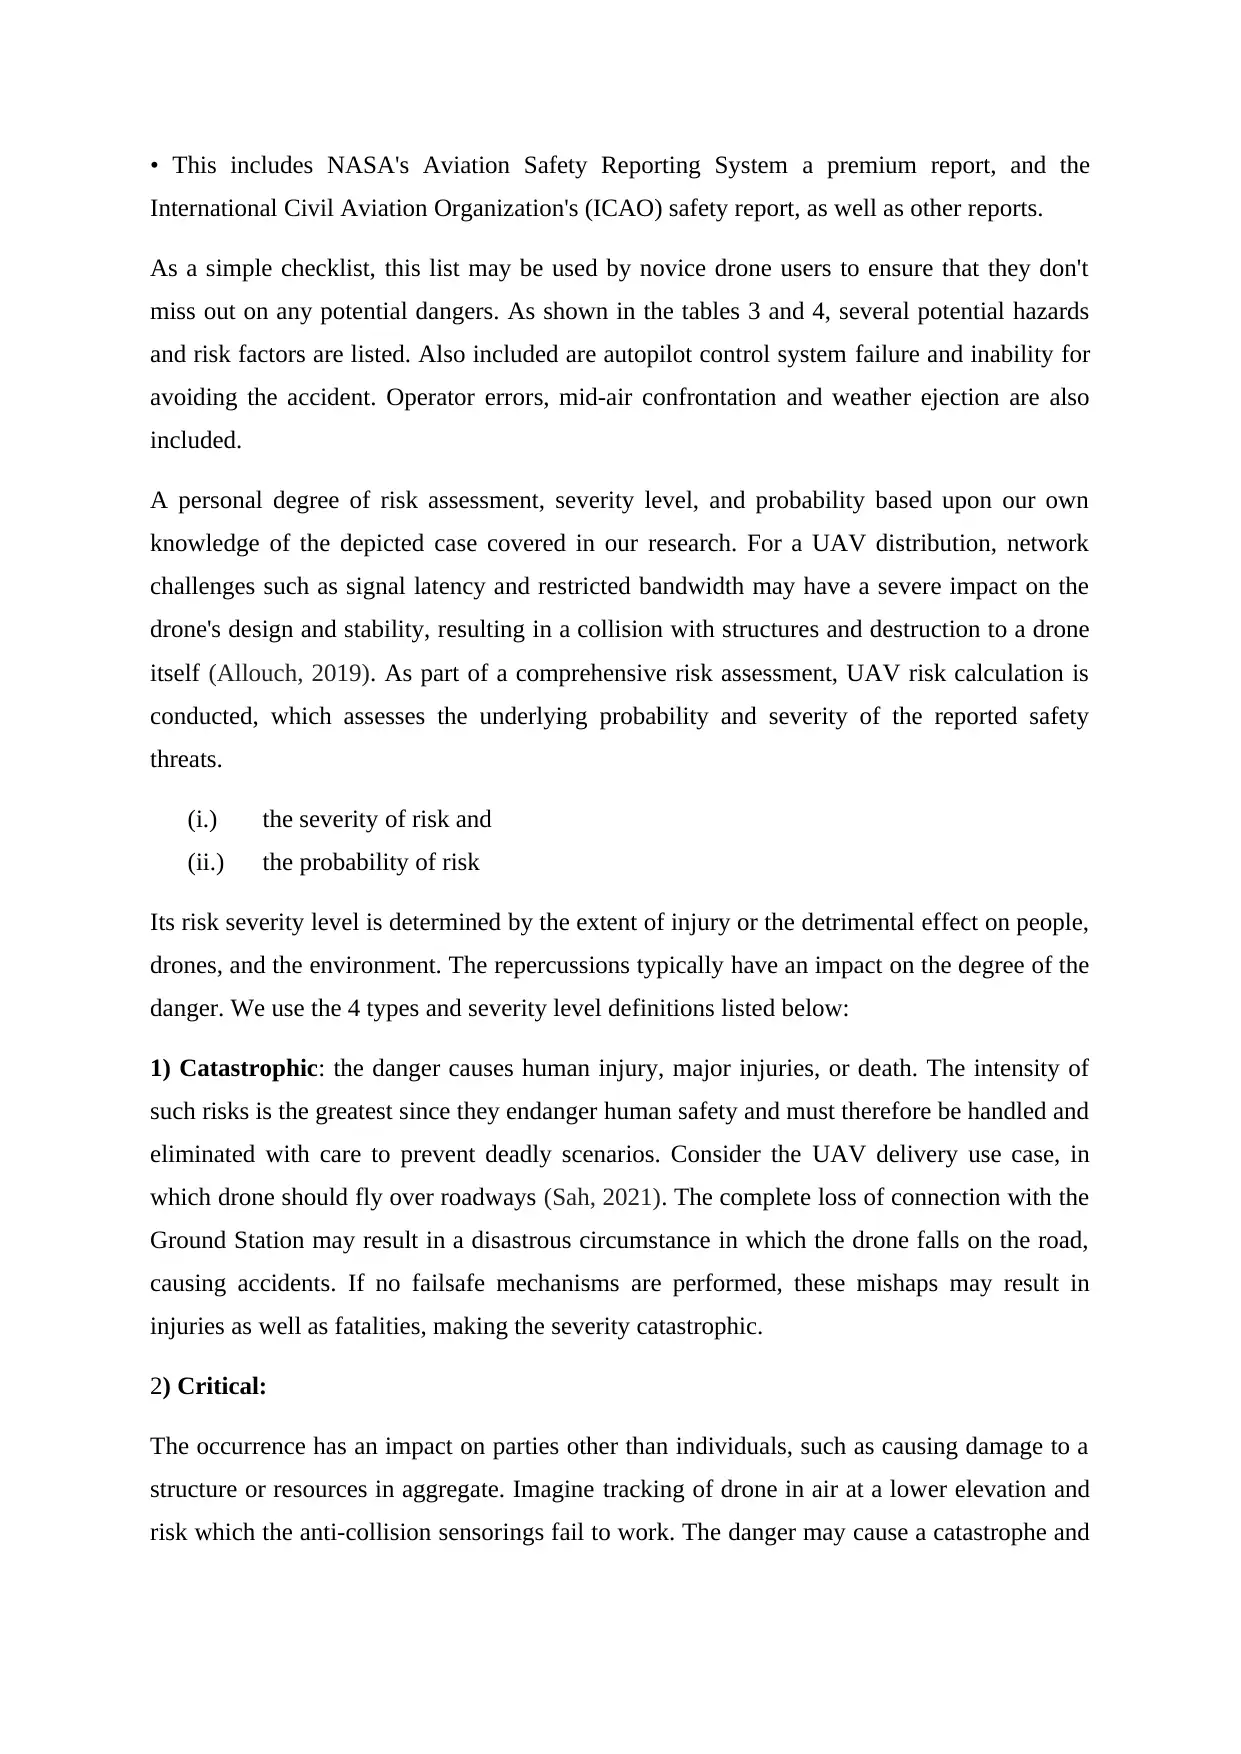
Table 2- Analysing Hazard Resources (Sharma, 2021)
The identification of hazards is the second phase in the risk analysis process. Table 2 presents
a list of drone dangers, both internally and externally, according on their source. Detection of
this list was accomplished using reactive techniques. Data gathered in the wake of an event or
disaster is referred to as "reactive approaches." Following is a list of reactive approaches that
are often used:
• Databases of accidents occurring:
•Among the sources of information are: (1) FAA preliminary reports on unmanned aircraft
system accidents and incidents, (2) NTSB, (3) FAA's Aviation Safety Information Analysis
and Sharing (ASIA) database, and (4) the FAA's Accident and Incident Data System (AIDS)
and Drone Crash Database.
line-of-sight methods, the networking limitations become apparent.
Table 1- Limitation of drone system (Sharma, 2021)
Table 2- Analysing Hazard Resources (Sharma, 2021)
The identification of hazards is the second phase in the risk analysis process. Table 2 presents
a list of drone dangers, both internally and externally, according on their source. Detection of
this list was accomplished using reactive techniques. Data gathered in the wake of an event or
disaster is referred to as "reactive approaches." Following is a list of reactive approaches that
are often used:
• Databases of accidents occurring:
•Among the sources of information are: (1) FAA preliminary reports on unmanned aircraft
system accidents and incidents, (2) NTSB, (3) FAA's Aviation Safety Information Analysis
and Sharing (ASIA) database, and (4) the FAA's Accident and Incident Data System (AIDS)
and Drone Crash Database.
• This includes NASA's Aviation Safety Reporting System a premium report, and the
International Civil Aviation Organization's (ICAO) safety report, as well as other reports.
As a simple checklist, this list may be used by novice drone users to ensure that they don't
miss out on any potential dangers. As shown in the tables 3 and 4, several potential hazards
and risk factors are listed. Also included are autopilot control system failure and inability for
avoiding the accident. Operator errors, mid-air confrontation and weather ejection are also
included.
A personal degree of risk assessment, severity level, and probability based upon our own
knowledge of the depicted case covered in our research. For a UAV distribution, network
challenges such as signal latency and restricted bandwidth may have a severe impact on the
drone's design and stability, resulting in a collision with structures and destruction to a drone
itself (Allouch, 2019). As part of a comprehensive risk assessment, UAV risk calculation is
conducted, which assesses the underlying probability and severity of the reported safety
threats.
(i.) the severity of risk and
(ii.) the probability of risk
Its risk severity level is determined by the extent of injury or the detrimental effect on people,
drones, and the environment. The repercussions typically have an impact on the degree of the
danger. We use the 4 types and severity level definitions listed below:
1) Catastrophic: the danger causes human injury, major injuries, or death. The intensity of
such risks is the greatest since they endanger human safety and must therefore be handled and
eliminated with care to prevent deadly scenarios. Consider the UAV delivery use case, in
which drone should fly over roadways (Sah, 2021). The complete loss of connection with the
Ground Station may result in a disastrous circumstance in which the drone falls on the road,
causing accidents. If no failsafe mechanisms are performed, these mishaps may result in
injuries as well as fatalities, making the severity catastrophic.
2) Critical:
The occurrence has an impact on parties other than individuals, such as causing damage to a
structure or resources in aggregate. Imagine tracking of drone in air at a lower elevation and
risk which the anti-collision sensorings fail to work. The danger may cause a catastrophe and
⊘ This is a preview!⊘
Do you want full access?
Subscribe today to unlock all pages.
Trusted by 1+ million students worldwide
a crash against with a structure, as well as damage to resources if it falls or breaks part of the
building's windowpanes and is therefore classified as having a critical intensity.
3)Minor:
The occurrence harms the drone functioning itself. For example, while drone is landing in an
open area, it’s conceivable for it to lose power owing to the disturbance to IMU as well as
height detectors or GPS signals, that might result in a crash into the ground. This danger will
only result in the drones or most of its parts collapsing, causing no harm to third parties or
persons. The severity is then labelled as marginal.
4) Negligible:
The occurrence has no influence on the drone's operational capabilities but has a minimal
impact on the drone system's performance. For example, in certain locations with dense
population, the quantity of GPS satellites may decrease, affecting the precision of the drone's
location in space. This danger does not frequently result in crashes, but rather causes brief
high localization errors that are tolerable. This danger has been categorised as insignificant
(Eißfeldt, 2020). It should be highlighted that the severity of risk is especially vulnerable to
prejudice and false assumptions since severity is often subjected as qualitative examination of
an occurrence and is up for interpretation. The intensity may vary depending on the situation.
An initial Bayes model was built using the safety analysis results, and data were collected and
reviewed from civil UAV crashes to determine the predicted chance of a crash connected
with a UAV system. It was also shown how causal and diagnostic inferences may be used in
practise. For demonstrative purposes, a scene was devised. Finally, the sensitivity analysis's
findings are examined.
THE BAYESIAN NETWORKS TOPOLOGY
The BN model usually has three nodes: goal, observable, and intermediate. Nodes that reflect
parameters whereby a probability is produced are called target nodes. Variables that may be
quantifiable/ immediately observable are represented by observable nodes. These nodes give
the data needed to calculate the posterior distribution of related occurrences. Since many
parental nodes with their values result in enormous CPT constructions which are hard to
comprehend, network nodes are primarily constructed to assist control the size of (CPT). As a
result, based on causal structures, integrating the parental nodes into fewer intermediary
nodes is a viable option. We create a causal BN model connecting the target, observable, and
Paraphrase This Document
Need a fresh take? Get an instant paraphrase of this document with our AI Paraphraser
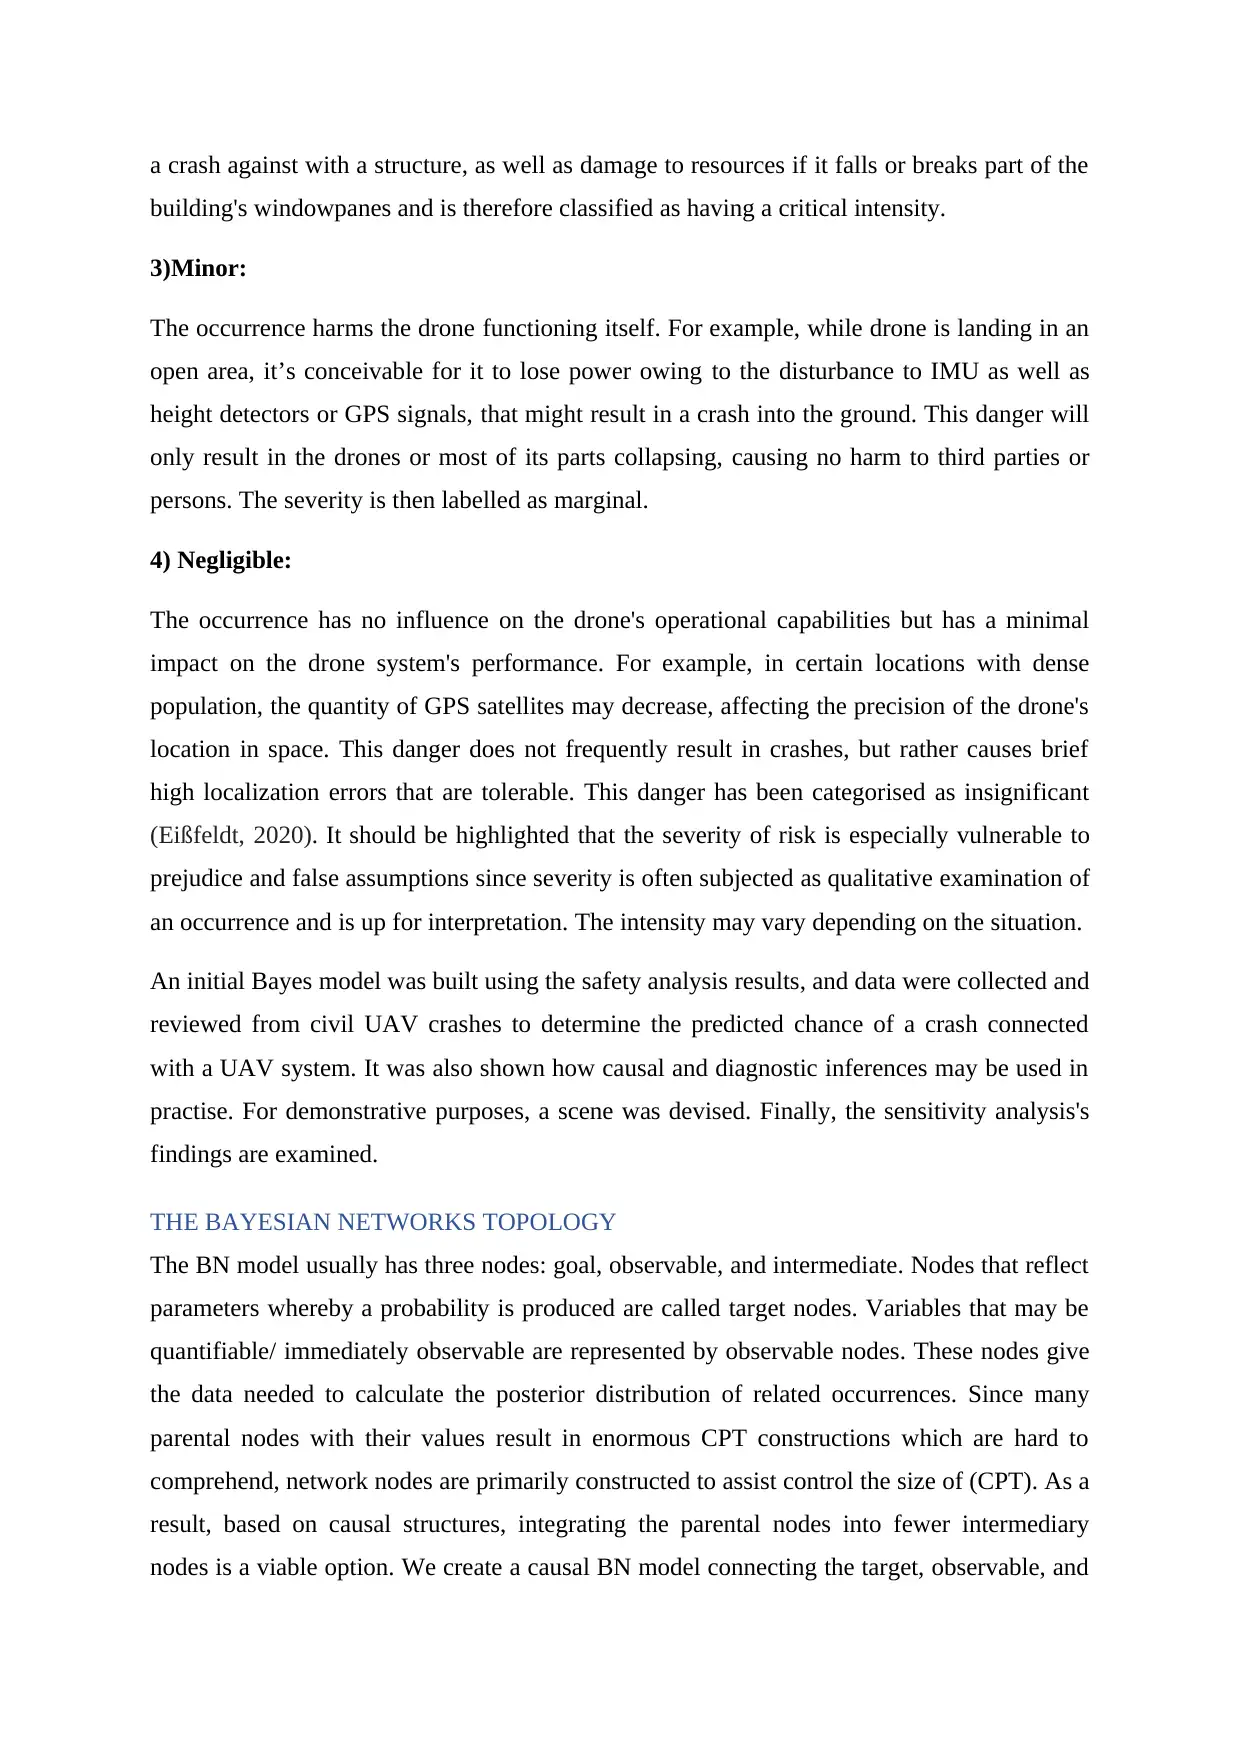
data packets using these instructions to analyse probability of a UAV crash during flight
under various scenarios. Figure 4 depicts the network architecture that encapsulates the
causative variables that lead to a UAV crash resulting from failure. Observable nodes give
information needed for determining posterior distribution of linked events when viewed from
beginning to end. Each node contains a set of discrete states and a set of state variables (NO
state means that cause or fault is missing) and a set of state variables. The state driver error,
for example, would have the value YES if there is an operator error and NO something else.
Expertise, trials, or learning from past data may all be used to gather data for the UAV risk
model. As a result, the next stage is to collect data.
Figure 1- UAN risk of crash (Yoo, 2018)
DATA COLLECTION
It's difficult to calculate accurate odds for drone accidents since there aren't enough actual
data points available. Considering our extensive research of the literature, we came up with a
set of hypothetical possibilities to illustrate the method's practical use. Analyst will probably
be able to generate more accurate and realistic probability in future as data becomes
accessible (Yoo, 2018). This work used a combination of secondary research, a basic web
search, and many online accident and event databases to compile the data needed to fuel the
UAV risk model shown here.
Researchers drew on data from the US Department of Defense as a basis for their analysis.
Autopilot scheme consists of failure was shown to be the cause of 26 percent of military
UAV mishaps while electrical power loss was found to be responsible for 37 percent. More
than a third of all UAV crashes are caused by electrical power loss, with autopilot control
module failure accounting for 19 percent of all crashes, according to article posted by
Washington Post, it reveals that annual number of collisions has doubled over past 10 years,
from 19 accidents in 2013 to 28 in 2014. From 2012-2021, summaries of all UAV
occurrences were analysed to draw conclusions. The Naval Safety Center in Norfolk,
Virginia, provided this information.
There were 65% of causal causes connected to pilot mistake, 16% to system/component
malfunction and 19percent to unique circumstances. System/component malfunction (42
percent), pilot mistake (21 percent), and weather-related variables (11 percent) account for
these incidents (5 percent). From September 2001 through July 2016, Belzer analysed data
from the UAS risk identification and risk database. Flight crew error factors accounted for
38% of all errors, component breakdown or malfunctioning accounted for 31%, and mid-air
accidents accounted for 19%. Aviation Safety Information Assessment and Network Slicing,
NASA's Aviation Safety Reporting System, and the Civil Aviation Authority were used to
gather data throughout a 10-year period, from 2006 to 2015.
New research shows that system/component failure or malfunction, pilot mistake, and GPS
loss are the most common causes of unmanned aerial vehicle accidents, accounting for 63%
of all crashes. When it comes to UAV crashes, there are a few elements that seem to be more
prevalent than others. Nodes in AgenaRisk, a Bayesian Network and Simulation Software for
Risk Evaluation as well the Predictive Modelling, were used to estimate posterior distribution
of underlying causes of crash risk in BN. The CPT structure of these intermediate nodes is
huge because they have many parent nodes. Figure 5 depicts Bayesian network's structure as
well as starting states. Frequent, likely, occasional, and distant are all output by the two
constant nodes in the network graph.
⊘ This is a preview!⊘
Do you want full access?
Subscribe today to unlock all pages.
Trusted by 1+ million students worldwide
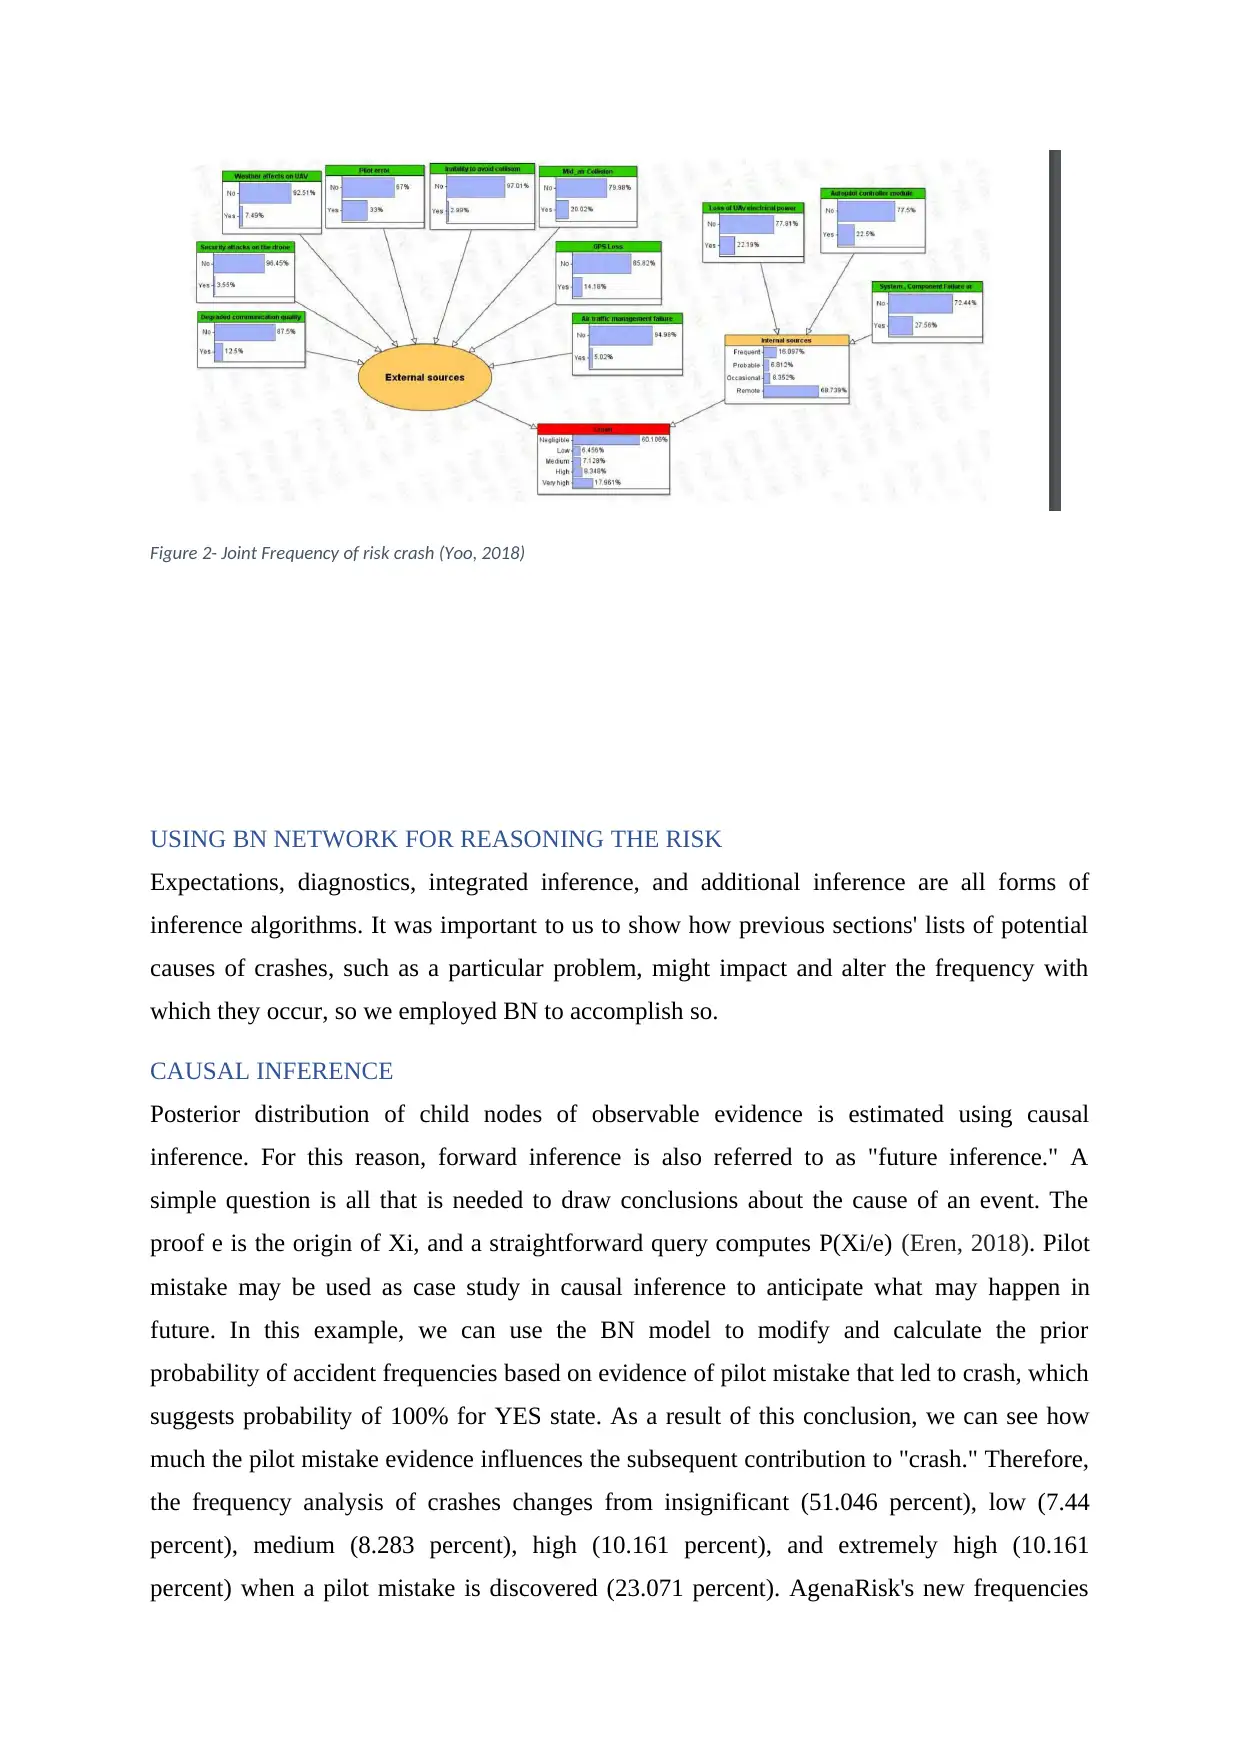
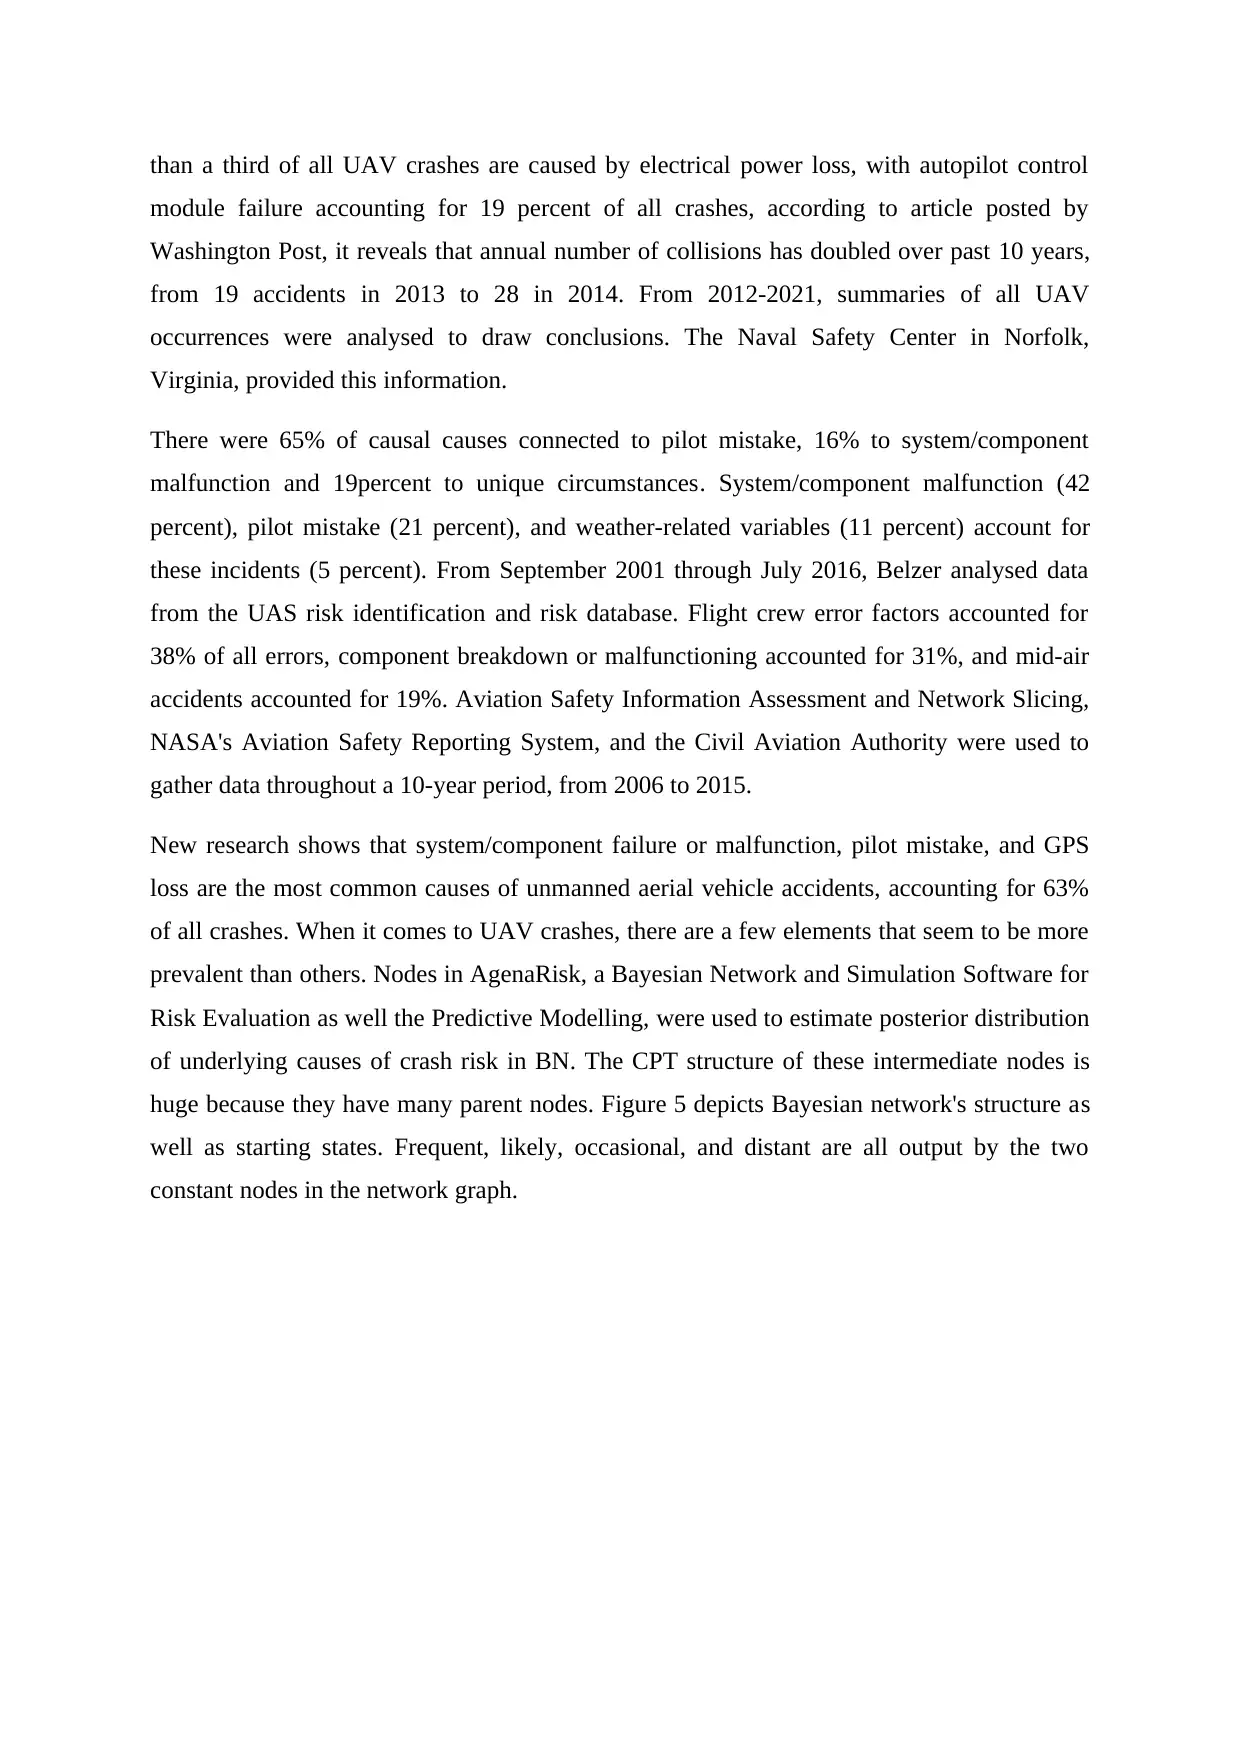
Figure 2- Joint Frequency of risk crash (Yoo, 2018)
USING BN NETWORK FOR REASONING THE RISK
Expectations, diagnostics, integrated inference, and additional inference are all forms of
inference algorithms. It was important to us to show how previous sections' lists of potential
causes of crashes, such as a particular problem, might impact and alter the frequency with
which they occur, so we employed BN to accomplish so.
CAUSAL INFERENCE
Posterior distribution of child nodes of observable evidence is estimated using causal
inference. For this reason, forward inference is also referred to as "future inference." A
simple question is all that is needed to draw conclusions about the cause of an event. The
proof e is the origin of Xi, and a straightforward query computes P(Xi/e) (Eren, 2018). Pilot
mistake may be used as case study in causal inference to anticipate what may happen in
future. In this example, we can use the BN model to modify and calculate the prior
probability of accident frequencies based on evidence of pilot mistake that led to crash, which
suggests probability of 100% for YES state. As a result of this conclusion, we can see how
much the pilot mistake evidence influences the subsequent contribution to "crash." Therefore,
the frequency analysis of crashes changes from insignificant (51.046 percent), low (7.44
percent), medium (8.283 percent), high (10.161 percent), and extremely high (10.161
percent) when a pilot mistake is discovered (23.071 percent). AgenaRisk's new frequencies
Paraphrase This Document
Need a fresh take? Get an instant paraphrase of this document with our AI Paraphraser
may be determined with ease by setting the mechanical failure to 0% for FALSE and 100%
for TRUE in the software's condition of operator error
DIAGNOSTIC INFERENCE
Using the observed data, the diagnostic inference calculates the likelihood of a certain parent
node in the future. Using backwards conclusion, the inference is made from data to its
parents, rather than the other way around. Diagnostic conclusions may be drawn from a
simple query in the same way that causal inferences can. P(Xi/e) may be calculated with a
simple query where the proof is a descendant of Xi (Fowler, 2021). Finding the size of a
cause-effect relationship between symptoms and diagnostic conclusions is acceptable.
Diagnostic inference differs from causality in that it evaluates likelihood of a cause node with
given information of an effect node. The diagnostic conclusion may be drawn from the
collision as evidence. XCE = 1|XFC = 1 might be a basic diagnostic inference example.
SCENARIO ANALYSIS
The BN model shown in Fig. 4 is used in this section to determine the characteristics with the
greatest influence on accident rates and to predict the frequency and percentage of UAV
crash events.
SCENARIOS
In this example, the danger of an unmanned aerial vehicle (UAV) crashing is evaluated based
on external factors. The impact of external hazards on risk estimate is represented by four
external variables (Frazier, 2021). Figure 6 illustrates this situation. Distribution of drone
crash risk is presented as insignificant and very high which clearly reveals a tremendous rise
of the risks. If an external mistake occurs, the risk of a collision rises from 17.961 percent to
33.88 percentage points, which is a very poor degree of safety. According to the assumptions
made at the start of each observation, this frequency may be calculated. A directive to engage
the harm minimisation approaches outlined in Tables 3 and 4 will be sent by an agent in
charge of true safety surveillance when the chance of a crash is very high.
Figure 3- Case where external sources are considered (Yoo, 2018)
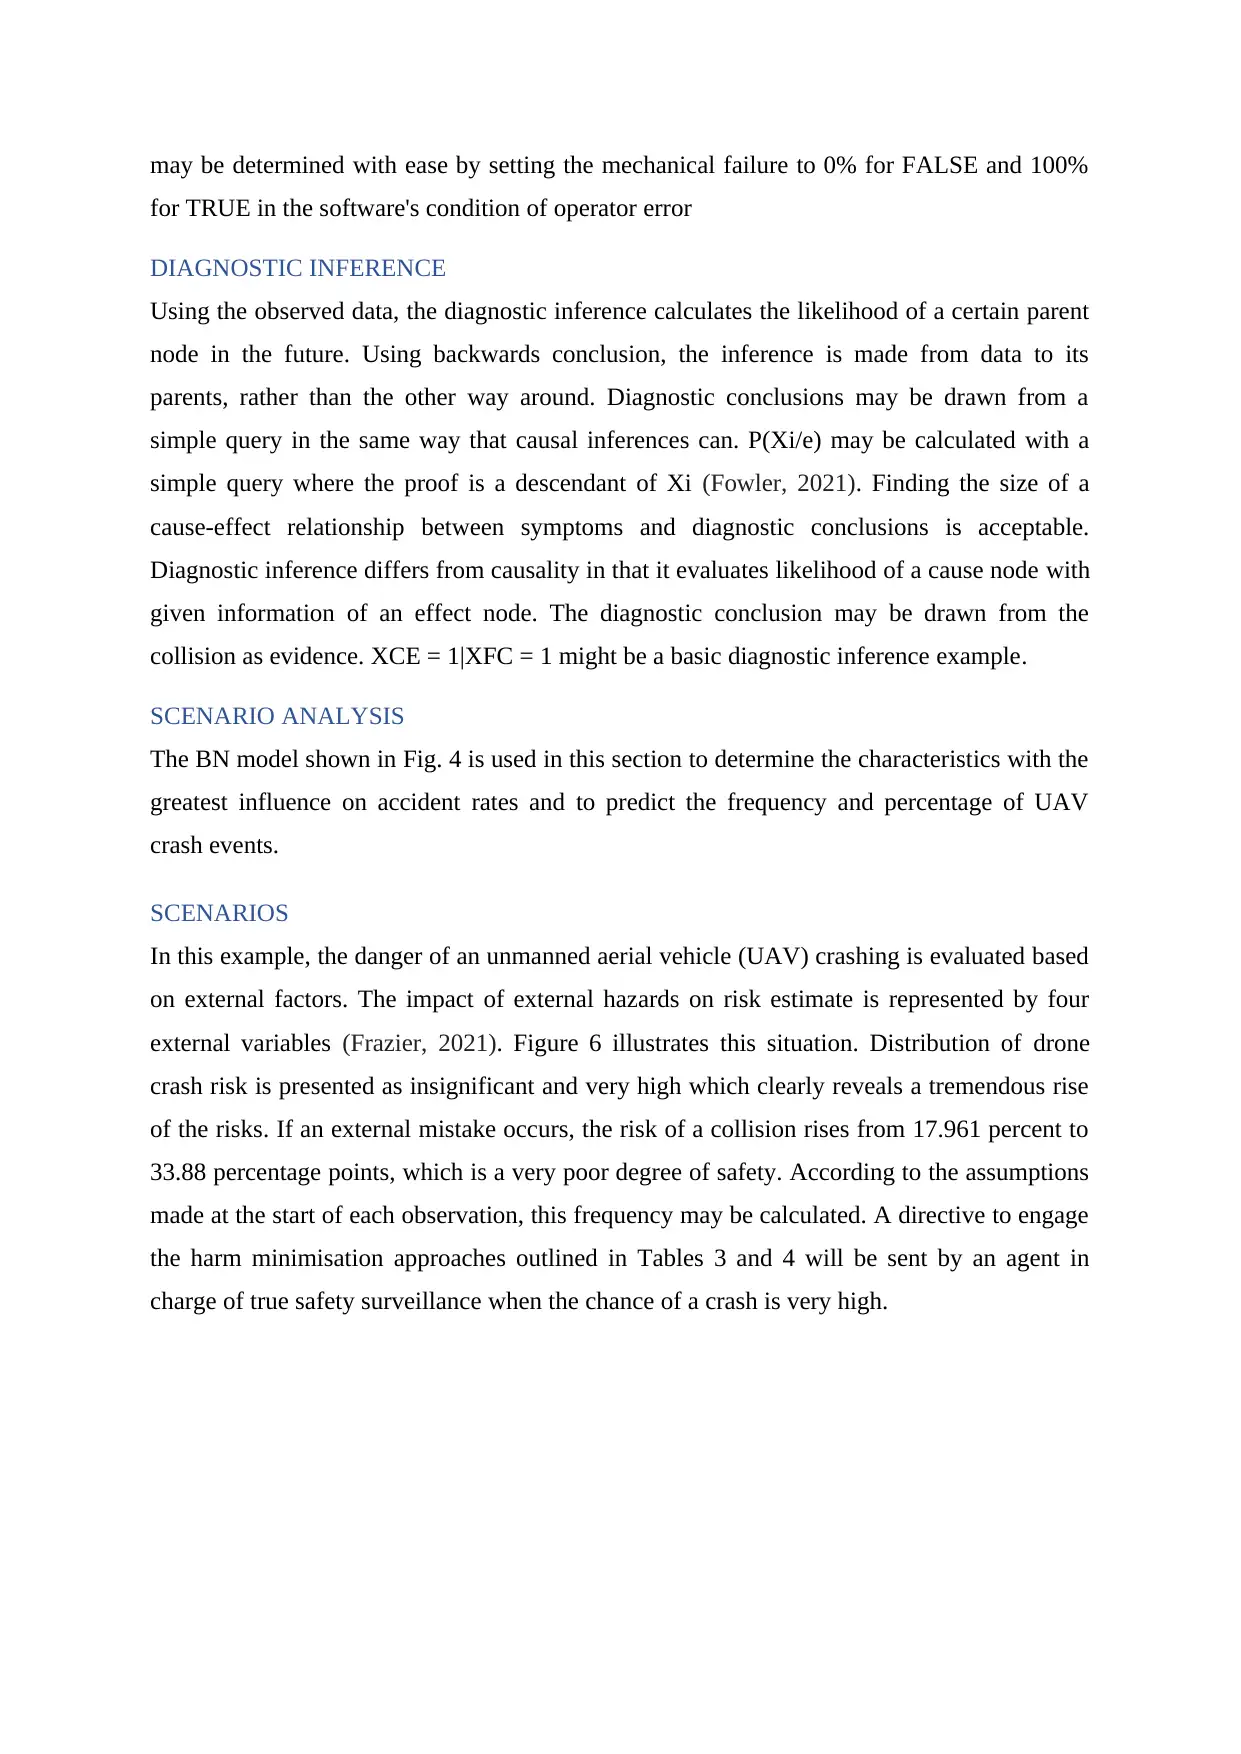
SCENARIO TWO: HYPOTHESES OF INTERNAL SOURCES
Internal dangers are addressed in this scenario. Fig. 3 depicts the outcomes of this
hypothetical situation. If the BN model's results are to be believed, then the probability of a
UAV accident in this scenario ranges from a trivial 9 percent to a low 9 percent to a medium
12 percent to a high 48 percent, indicating an increase in risk. These situations "extremely
high" status suggests that particular risk management choices must be utilised to limit or
lessen the probability of a collision under these circumstances. With just a little shift in the
frequency distribution, it shows that the danger of the collapse would skyrocket.
⊘ This is a preview!⊘
Do you want full access?
Subscribe today to unlock all pages.
Trusted by 1+ million students worldwide
1 out of 15


Your All-in-One AI-Powered Toolkit for Academic Success.
+13062052269
info@desklib.com
Available 24*7 on WhatsApp / Email
![[object Object]](/_next/static/media/star-bottom.7253800d.svg)
Unlock your academic potential
Copyright © 2020–2026 A2Z Services. All Rights Reserved. Developed and managed by ZUCOL.