Procedia Engineering | Assessment1
To demonstrate your understanding of finite element analysis and compare results of a simulation with a laboratory measurement
8 Pages1443 Words40 Views
Added on 2022-10-02
Procedia Engineering | Assessment1
To demonstrate your understanding of finite element analysis and compare results of a simulation with a laboratory measurement
Added on 2022-10-02
ShareRelated Documents
ASSIGNMENT
CENTRE FOR ENGINEERING AND INDUSTRIAL DESIGN
APPLIED COMPUTATIONAL MODELLING
ASSIGNMENT 2
COMPARING REAL WORLD MEASUREMENTS WITH FINITE ELEMENT RESULTS
INTRODUCTION
Finite element modelling is reliable, accurate and handy way to assess performance of simple as well as
complex parts. Computer models can be made with the help of near-shape CADs of the parts to be
assessed, their functional requirements can be modelled as boundary conditions and appropriate loads.
There will be a few assumptions made in these models, despite which if the assumptions are reasonable,
the behaviour simulated by finite element methods can help performance, make improvements, and get
the design to be improved as per the constraints. Digital models need material inputs to replicate their
behaviour which can be captured through simple testing such as tensile testing, compression testing and
shear testing.
In the current study, simple tensile testing was performed on standard tensile specimen made using 3
different materials. The obtained results were analysed to obtain effective stress-strain results. A finite
element model was made in Solidworks to replicate the tensile behaviour. Simplification assumptions
were made in the model to simulate the results. A comparison of experimental and numerical results were
made to understand fidelity of numerical methods.
METHOD
1. Laboratory tests
a. Description of test-piece used for testing
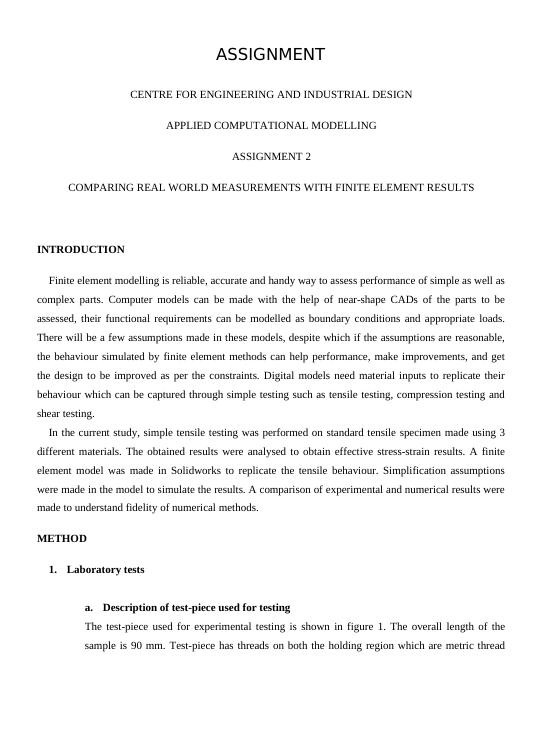
The test-piece used for experimental testing is shown in figure 1. The overall length of the
sample is 90 mm. Test-piece has threads on both the holding region which are metric thread
CENTRE FOR ENGINEERING AND INDUSTRIAL DESIGN
APPLIED COMPUTATIONAL MODELLING
ASSIGNMENT 2
COMPARING REAL WORLD MEASUREMENTS WITH FINITE ELEMENT RESULTS
INTRODUCTION
Finite element modelling is reliable, accurate and handy way to assess performance of simple as well as
complex parts. Computer models can be made with the help of near-shape CADs of the parts to be
assessed, their functional requirements can be modelled as boundary conditions and appropriate loads.
There will be a few assumptions made in these models, despite which if the assumptions are reasonable,
the behaviour simulated by finite element methods can help performance, make improvements, and get
the design to be improved as per the constraints. Digital models need material inputs to replicate their
behaviour which can be captured through simple testing such as tensile testing, compression testing and
shear testing.
In the current study, simple tensile testing was performed on standard tensile specimen made using 3
different materials. The obtained results were analysed to obtain effective stress-strain results. A finite
element model was made in Solidworks to replicate the tensile behaviour. Simplification assumptions
were made in the model to simulate the results. A comparison of experimental and numerical results were
made to understand fidelity of numerical methods.
METHOD
1. Laboratory tests
a. Description of test-piece used for testing
The test-piece used for experimental testing is shown in figure 1. The overall length of the
sample is 90 mm. Test-piece has threads on both the holding region which are metric thread
2
M12 x 1.75. The center region or gauge region has a diameter of 3.3 mm. The length of
threaded regions are 31.7 mm for top and 19 mm for bottom.
Figure 1. Dimensions of tensile coupon used for testing
b. Test-piece mounting and loading details
To mount a tensile sample into the machine, the short threaded end of the tensile specimen (19
mm) is inserted into the threaded hole in the top of the load cell. We screw the sample inside
the hole of load cell until the top edge of short threaded section is in-line with top of the load
cell. After that we lower the load bar so that longer threaded section of tensile bar goes through
the center of the load bar. We lower the load bar until the bottom edge of longer threaded
section meets with bottom of load bar. After holding the sample, we screw the sample nut onto
the threaded section until sample is tightly held into the place.
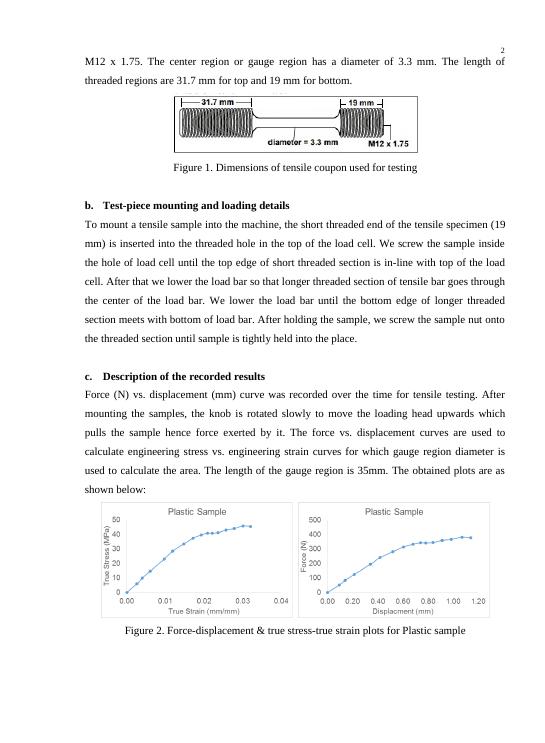
c. Description of the recorded results
Force (N) vs. displacement (mm) curve was recorded over the time for tensile testing. After
mounting the samples, the knob is rotated slowly to move the loading head upwards which
pulls the sample hence force exerted by it. The force vs. displacement curves are used to
calculate engineering stress vs. engineering strain curves for which gauge region diameter is
used to calculate the area. The length of the gauge region is 35mm. The obtained plots are as
shown below:
Figure 2. Force-displacement & true stress-true strain plots for Plastic sample
M12 x 1.75. The center region or gauge region has a diameter of 3.3 mm. The length of
threaded regions are 31.7 mm for top and 19 mm for bottom.
Figure 1. Dimensions of tensile coupon used for testing
b. Test-piece mounting and loading details
To mount a tensile sample into the machine, the short threaded end of the tensile specimen (19
mm) is inserted into the threaded hole in the top of the load cell. We screw the sample inside
the hole of load cell until the top edge of short threaded section is in-line with top of the load
cell. After that we lower the load bar so that longer threaded section of tensile bar goes through
the center of the load bar. We lower the load bar until the bottom edge of longer threaded
section meets with bottom of load bar. After holding the sample, we screw the sample nut onto
the threaded section until sample is tightly held into the place.
c. Description of the recorded results
Force (N) vs. displacement (mm) curve was recorded over the time for tensile testing. After
mounting the samples, the knob is rotated slowly to move the loading head upwards which
pulls the sample hence force exerted by it. The force vs. displacement curves are used to
calculate engineering stress vs. engineering strain curves for which gauge region diameter is
used to calculate the area. The length of the gauge region is 35mm. The obtained plots are as
shown below:
Figure 2. Force-displacement & true stress-true strain plots for Plastic sample
3
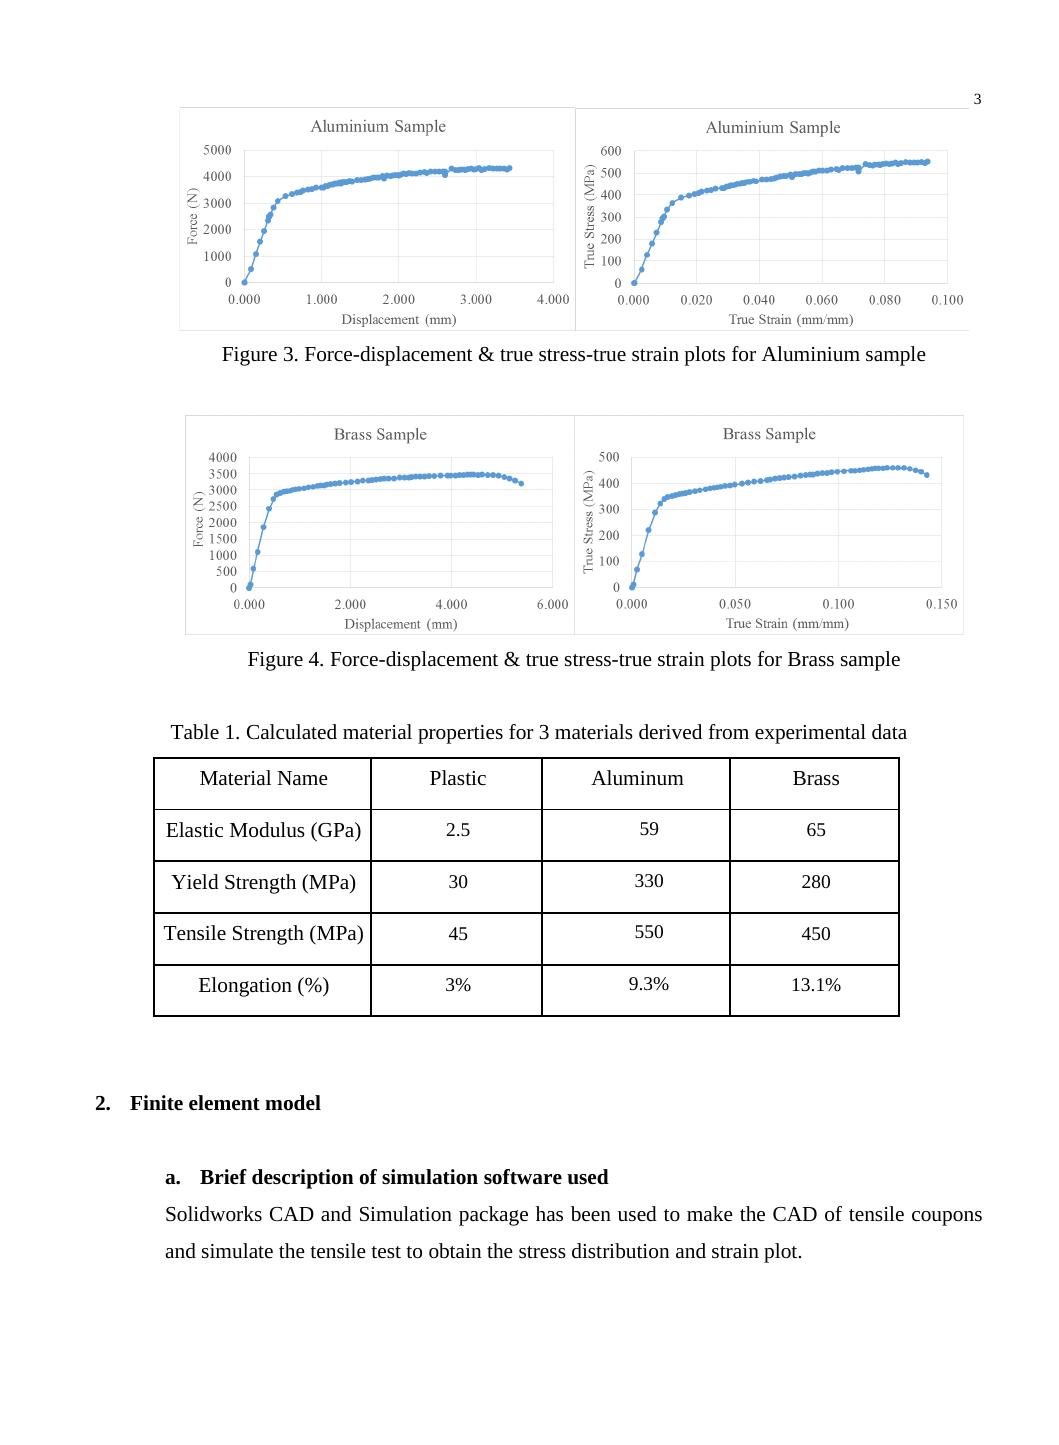
Figure 3. Force-displacement & true stress-true strain plots for Aluminium sample
Figure 4. Force-displacement & true stress-true strain plots for Brass sample
Table 1. Calculated material properties for 3 materials derived from experimental data
Material Name Plastic Aluminum Brass
Elastic Modulus (GPa) 2.5 59 65
Yield Strength (MPa) 30 330 280
Tensile Strength (MPa) 45 550 450
Elongation (%) 3% 9.3% 13.1%
2. Finite element model
a. Brief description of simulation software used
Solidworks CAD and Simulation package has been used to make the CAD of tensile coupons
and simulate the tensile test to obtain the stress distribution and strain plot.
b. Model description
A static study is used in Solidworks to mimic the experimental test. The short end of the
sample which is fixed inside the machine is assigned as fixed boundary condition in analysis.
End of preview
Want to access all the pages? Upload your documents or become a member.
Related Documents
Determination Of Consolidation Properties Of Soil Assignmentlg...
|7
|894
|38