University of Wollongong: OPS909 Process Map and Control Chart Report
VerifiedAdded on  2022/11/30
|21
|2627
|435
Report
AI Summary
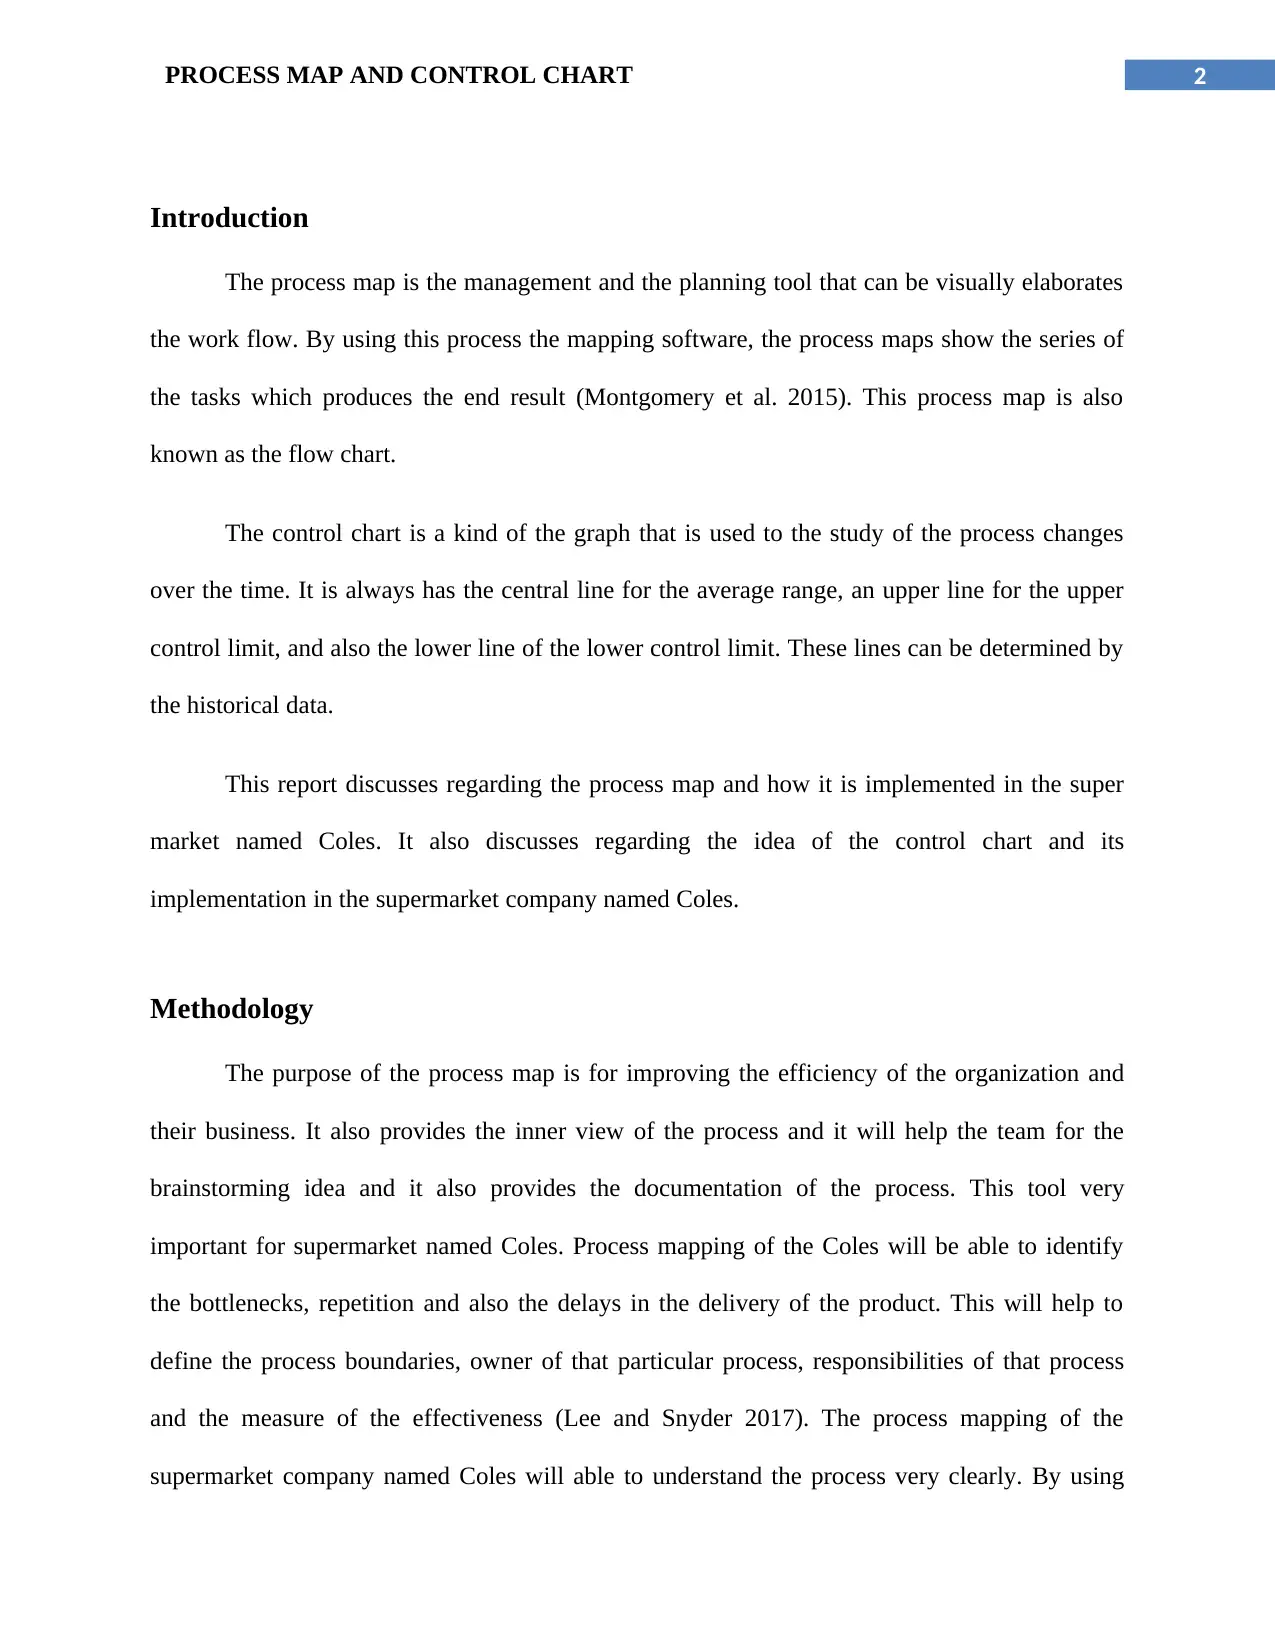
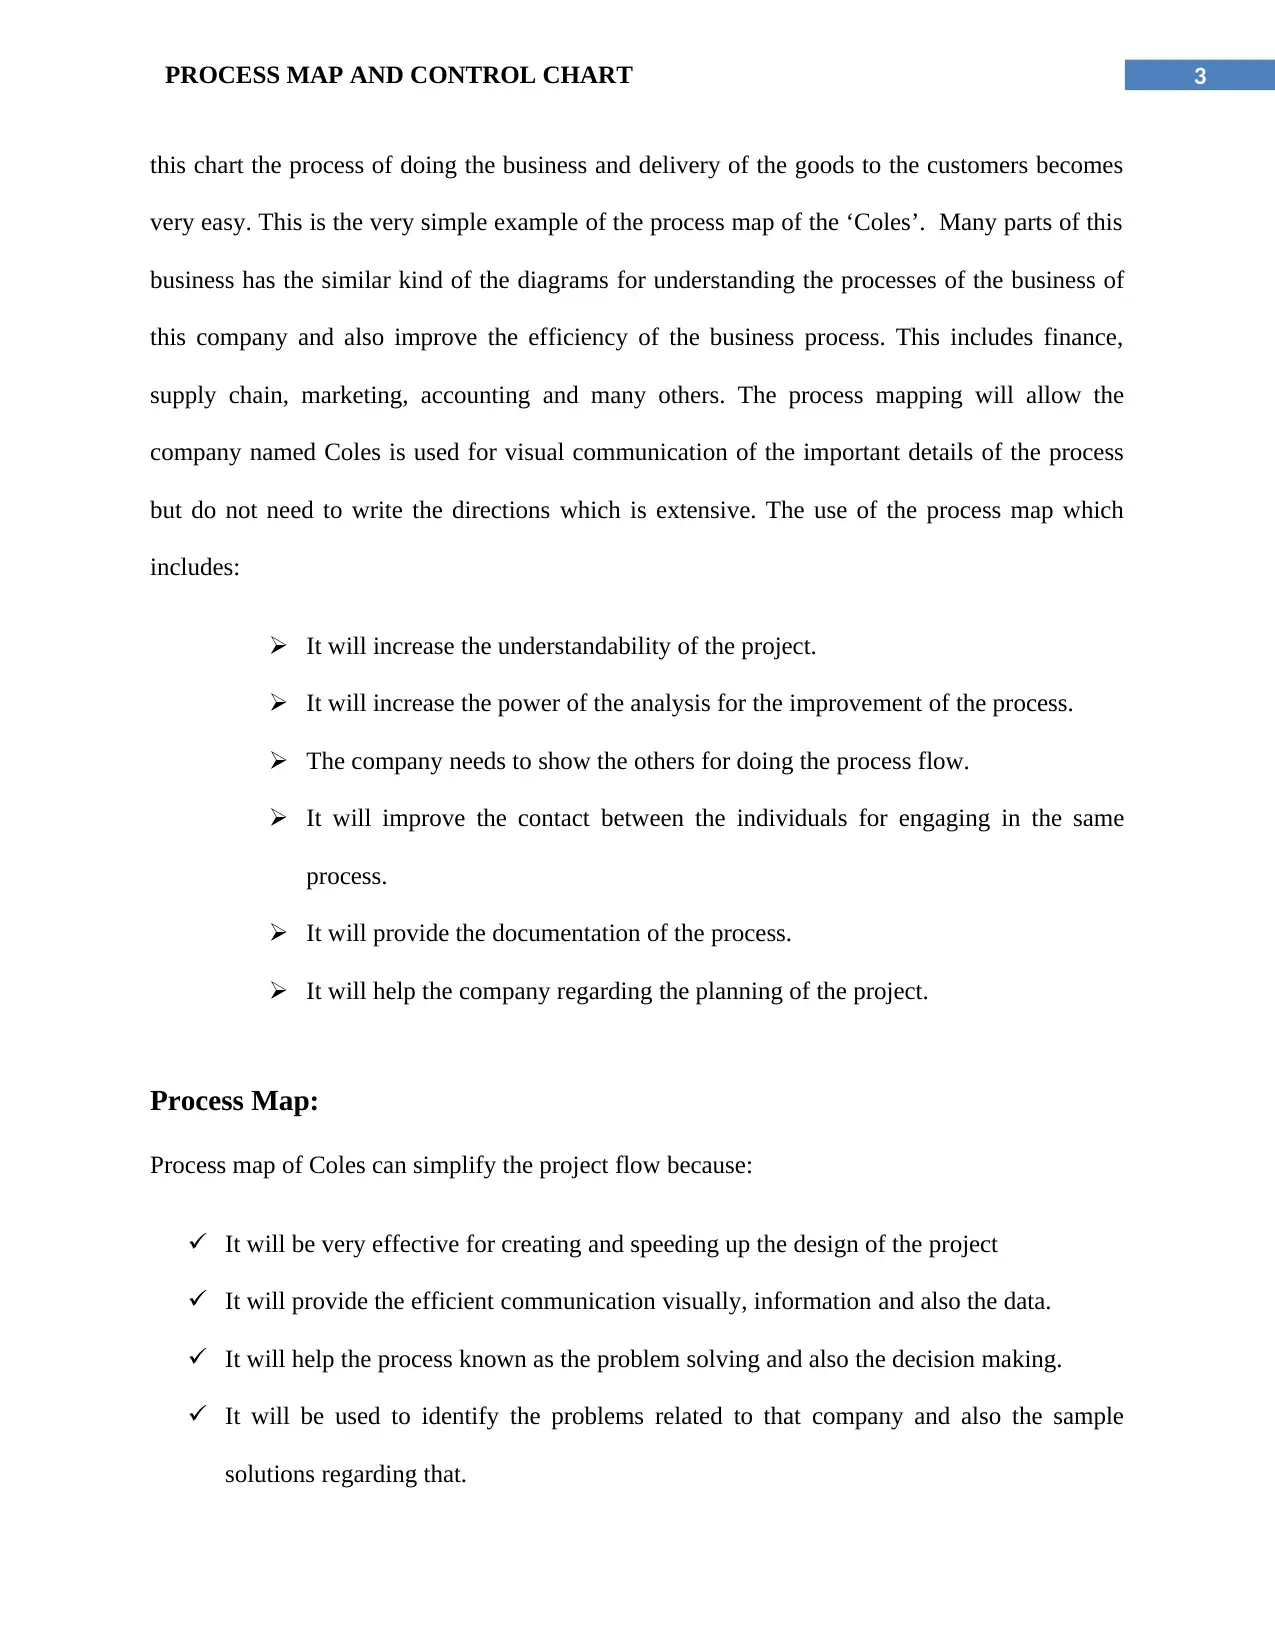
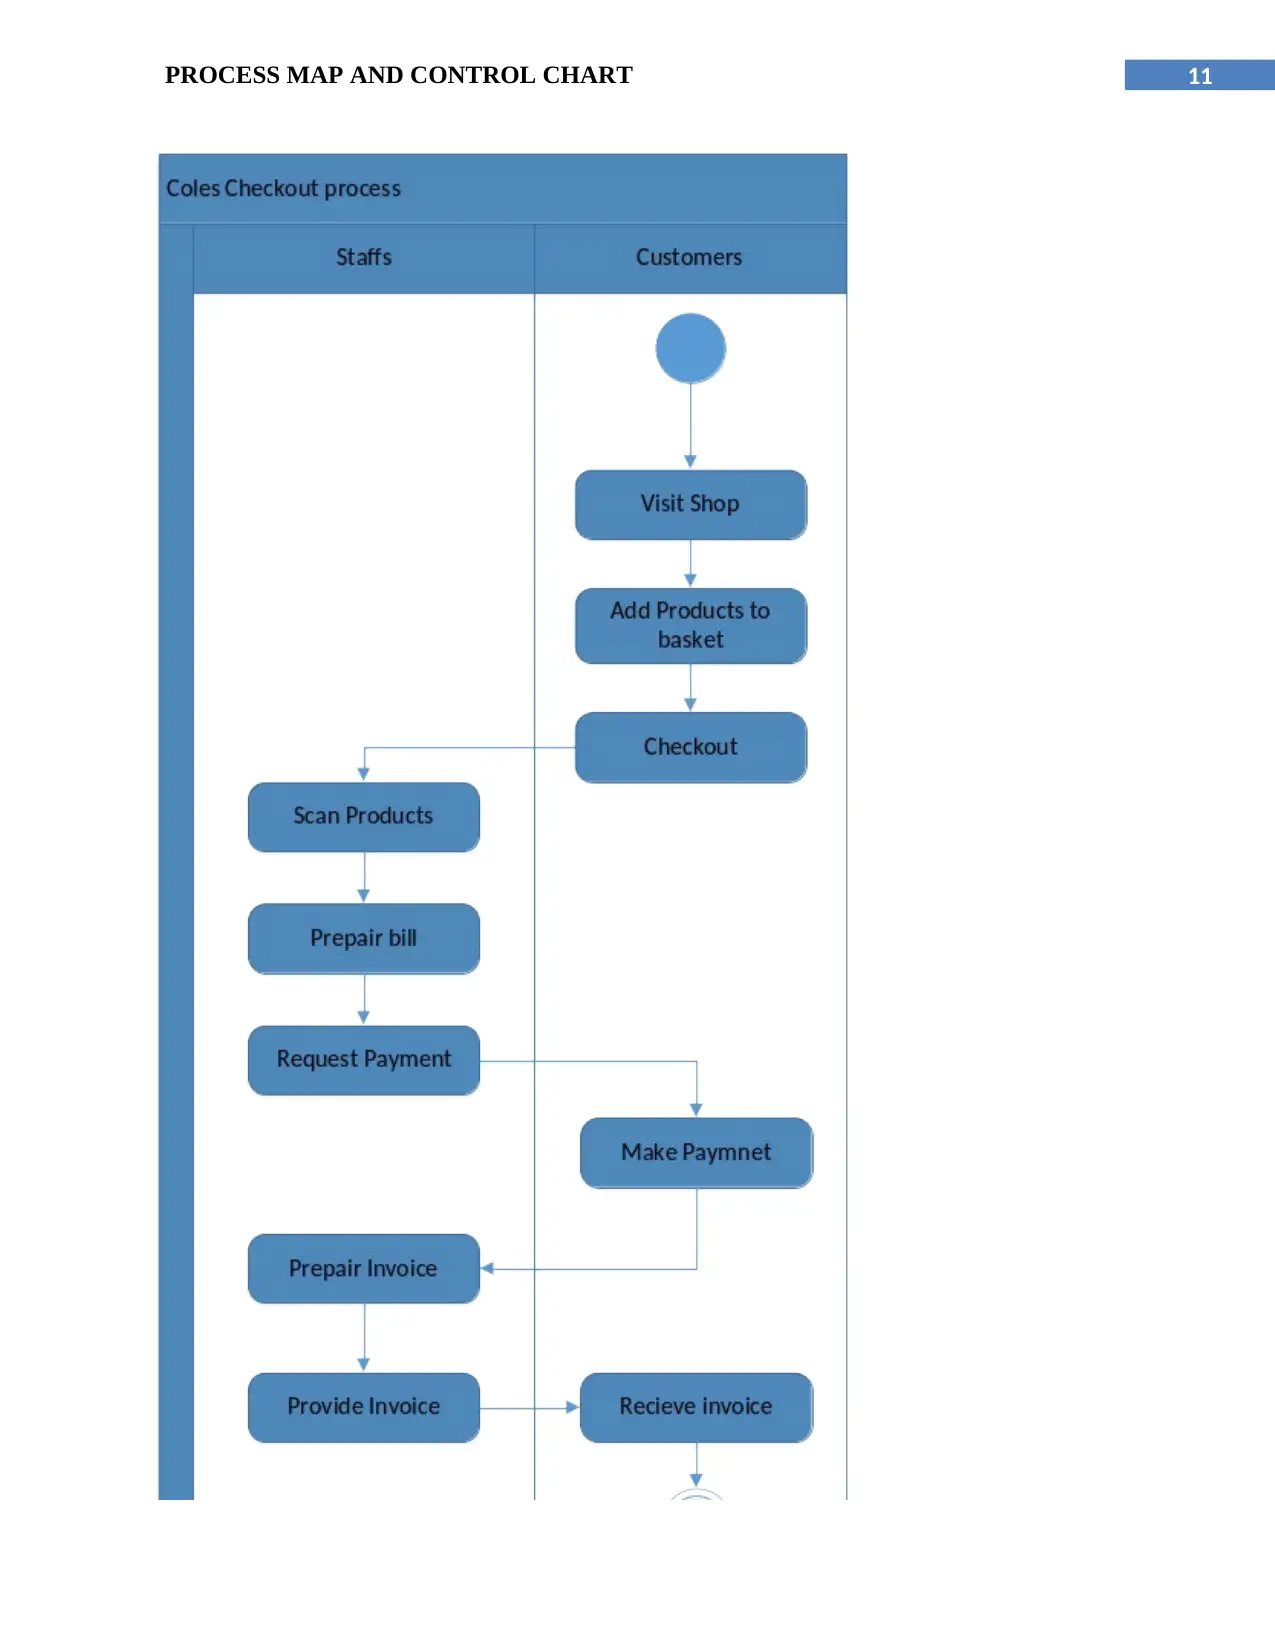
This report examines process mapping and control charts as tools for improving the efficiency of a supermarket, specifically using the example of Coles. The methodology section highlights the importance of process maps for identifying bottlenecks, repetition, and delays, which can help define process boundaries, responsibilities, and effectiveness measures. The report details the benefits of process mapping, including increased project understandability, improved analysis, and enhanced communication. It provides a process map of the Coles checkout process and proposes a re-mapped system using RFID technology for automated checkout. The report then discusses control charts, particularly X-bar and R-bar charts, and their application in monitoring and improving checkout processes, comparing staff-checkout and self-checkout procedures. The analysis reveals that self-checkout is more efficient than staff checkout. The report concludes by emphasizing the value of process maps and control charts for enhancing supermarket business processes and overall quality.

Running head: PROCESS MAP AND CONTROL CHART
PROCESS MAP AND CONTROL CHART
Name of the Student
Name of the University
Author note
PROCESS MAP AND CONTROL CHART
Name of the Student
Name of the University
Author note
Secure Best Marks with AI Grader
Need help grading? Try our AI Grader for instant feedback on your assignments.

1PROCESS MAP AND CONTROL CHART
Table of Contents
Introduction............................................................................................................................2
Methodology...........................................................................................................................2
Process Map:...........................................................................................................................3
Process Re-map.......................................................................................................................5
Control charts:.........................................................................................................................6
Conclusion...............................................................................................................................7
References:.............................................................................................................................9
Appendix:..............................................................................................................................10

2PROCESS MAP AND CONTROL CHART
Introduction
The process map is the management and the planning tool that can be visually elaborates
the work flow. By using this process the mapping software, the process maps show the series of
the tasks which produces the end result (Montgomery et al. 2015). This process map is also
known as the flow chart.
The control chart is a kind of the graph that is used to the study of the process changes
over the time. It is always has the central line for the average range, an upper line for the upper
control limit, and also the lower line of the lower control limit. These lines can be determined by
the historical data.
This report discusses regarding the process map and how it is implemented in the super
market named Coles. It also discusses regarding the idea of the control chart and its
implementation in the supermarket company named Coles.
Methodology
The purpose of the process map is for improving the efficiency of the organization and
their business. It also provides the inner view of the process and it will help the team for the
brainstorming idea and it also provides the documentation of the process. This tool very
important for supermarket named Coles. Process mapping of the Coles will be able to identify
the bottlenecks, repetition and also the delays in the delivery of the product. This will help to
define the process boundaries, owner of that particular process, responsibilities of that process
and the measure of the effectiveness (Lee and Snyder 2017). The process mapping of the
supermarket company named Coles will able to understand the process very clearly. By using

3PROCESS MAP AND CONTROL CHART
this chart the process of doing the business and delivery of the goods to the customers becomes
very easy. This is the very simple example of the process map of the ‘Coles’. Many parts of this
business has the similar kind of the diagrams for understanding the processes of the business of
this company and also improve the efficiency of the business process. This includes finance,
supply chain, marketing, accounting and many others. The process mapping will allow the
company named Coles is used for visual communication of the important details of the process
but do not need to write the directions which is extensive. The use of the process map which
includes:
 It will increase the understandability of the project.
 It will increase the power of the analysis for the improvement of the process.
 The company needs to show the others for doing the process flow.
 It will improve the contact between the individuals for engaging in the same
process.
 It will provide the documentation of the process.
 It will help the company regarding the planning of the project.
Process Map:
Process map of Coles can simplify the project flow because:
 It will be very effective for creating and speeding up the design of the project
 It will provide the efficient communication visually, information and also the data.
 It will help the process known as the problem solving and also the decision making.
 It will be used to identify the problems related to that company and also the sample
solutions regarding that.
Secure Best Marks with AI Grader
Need help grading? Try our AI Grader for instant feedback on your assignments.

4PROCESS MAP AND CONTROL CHART
 It can give the solution very quickly and also very economically.
 It shows the process which is breaking down into the steps and it can be very easily done
by using the symbols.
 It shows the connection and sequences in depth.
 It shows the entire process of the marketing strategy of the Coles which will show the
entire process from the start to the end.
Process maps helps the employees to understand the relevant features of the process and it
will allow the employee for producing the useful data for using the problem solving
approach. It will also help the supermarket company for asking questions very strategic
manner for any kind of the business strategy.
There are different kinds of the process maps which are available in the super market
company named Coles. This includes:
ï‚· Activity Process Map: It represents the activities related to the value added and the
non-value added.
ï‚· Detailed Process map: It will provided more descriptive view at the every step of
the process.
ï‚· Document map: This documents are the inputs and the outputs related to the
process.
ï‚· High-level process map: High level communication of certain process that involves
the communication between the Supplier, Input, Process, Output and many others.
ï‚· Rendered process map: It will represent the present state and also the processes of
the future state for viewing the areas for the improvement of the improvement.

5PROCESS MAP AND CONTROL CHART
The current process in Coles Company makes the customers’ checkout with the staffs
involved and this takes up a lot of time for the customers. The customers are required to provide
the items that they have collected at the checkout point in the shop. The staffs would be scanning
the items and creating the total bill for the customers in the organization (Rohani and Zahraee
2015). The staff would then calculate the bill for the customers and provide the bill to the
customer after printing. After this the customer makes the payment to the staffs and the staffs
generate the invoice for the customers. The customers are then provided with the invoice which
completes their shopping process. However, this process is not at all satisfactory for the
customers and they are not able to complete the procedures completely.
Process Re-map
The checkout process for the Coles Company has been remapped in this diagram
provided above. It can be proposed that a system is developed with would be helpful in
automating the checkout process for the customers. The system would be implemented with the
help of RFIDs. In addition to this, the products would be marked with some tags. The customers
would be provided with bags containing the tags. The Tags would be scanned in the account of
the bag as soon as they enter a product into a bag. Hence, the total bill for the customers would
be calculated automatically for the customers and they would be able to make the payment
accordingly. The customers would be displayed the total bill during the checkout process and
they would be provided with a invoice after they have had made the payment.

6PROCESS MAP AND CONTROL CHART
Control charts:
Control chart is another important tool for the super market management process. The
super market company named Coles also uses the control chart for growing their business. The
control of the company named Coles can be used for the following situations;
 When the current processes of the control is used for finding and the correcting
the problems when this type of the situation occurs.
 The control chart is used when there is the prediction of the range of the
expectation from different processes (Saleh et al. 2015).
 It is applicable while determining that the process is stable or not.
 It is used to analyze the process patterns variations from the different causes.
 During the determination of the quality improvement of the Coles, it should have
the aim for preventing the specific problems for making the preliminary changes
of the process.
In the supermarket store the checkout processes are of two types, namely self-checkout of
products and staff checkout of products. The staff-checkout processes are generally time
consuming as the customer delivers the products to the available staff and then the checkouts are
done. This is also evident from the data of staff and self-checkouts as given in the excel files.
There is only one sample of number of products checked out by staffs and self-operation of
customer and hence only X-bar chart has been created as control chart here. The upper and lower
control limits of X-bar chart is given by the following formula
UCL = X-dbar + 3*sigma
LCL = X-dbar – 3*sigma
Paraphrase This Document
Need a fresh take? Get an instant paraphrase of this document with our AI Paraphraser

7PROCESS MAP AND CONTROL CHART
Where, X-dbar = average of X-bar or in this case the number of products (Strolin et al. 2018).
Sigma = sample standard deviation of X-bar.
For R-bar chart construction the two formulas are used.
UCL = D4*R-bar
LCL = D3*R-bar
Here, as the sample size is 5 hence from the R-bar chart table the constants D3 and D4 are 0 and
2.115 respectively.
From the two X-bar charts it is clear that in each case the data values of number of product
exceed the R chart control limits, though, the average products transactions are within the X-bar
chart limits. Specifically, in each case one range point is outside the upper control limit of the R-
chart and it is clear that in case of staff checkout the number of products checked is larger than
the self-checkout and also the point is far more away from the upper control limit than the self-
checkout chart point (Burr 2018). Thus it can be stated that the self-checkout process is an
improved process than the staff-checkout process as the load of transactions are reduced as well
as transaction durations are also less than the staff checkout (Saleh et al. 2015). Also, in case of
self-checkout transaction the points are evenly distributed about the center Rbar and X-bar line.
Conclusion
In this report it was discussed regarding the process map and also the control chart of the
supermarket. The popular supermarket company named Coles can improve their business by
using the control chart and the process map. The process map and the control map is the very

8PROCESS MAP AND CONTROL CHART
important tool for the supermarket business process. The importance of the process map and the
control chart is discussed in the methodology portion of this report. This report concludes that by
using these two tools the supermarket company named Coles can improve their business in the
exponential manner. This is the only way for improving the quality of the business process.

9PROCESS MAP AND CONTROL CHART
References:
Montgomery, C., Beuth, J., Sheridan, L. and Klingbeil, N., 2015, August. Process mapping of
Inconel 625 in laser powder bed additive manufacturing. In Solid freeform fabrication
symposium (pp. 1195-1204).
Lee, Q. and Snyder, B., 2017. The strategos guide to value stream & process mapping. Enna
Products Corporation.
Rohani, J.M. and Zahraee, S.M., 2015. Production line analysis via value stream mapping: a lean
manufacturing process of color industry. Procedia Manufacturing, 2, pp.6-10.
Saleh, N.A., Mahmoud, M.A., Keefe, M.J. and Woodall, W.H., 2015. The difficulty in designing
Shewhart X and X control charts with estimated parameters. Journal of Quality
Technology, 47(2), pp.127-138.
Burr, I.W., 2018. Statistical quality control methods. Routledge.
Strolin, S., Ungania, S., Bruzzaniti, V., Rao, M., Montano, M., Digiesi, G., Sanguineti, G. and
Strigari, L., 2018. 202. Quantitative evaluation and optimization of daily on-line shift in prostate
cancer treatment using control charts. Physica Medica, 56, p.185.
Secure Best Marks with AI Grader
Need help grading? Try our AI Grader for instant feedback on your assignments.

10PROCESS MAP AND CONTROL CHART
Appendix:
Process map:
Appendix:
Process map:

11PROCESS MAP AND CONTROL CHART

12PROCESS MAP AND CONTROL CHART
Process remap:
Process remap:
Paraphrase This Document
Need a fresh take? Get an instant paraphrase of this document with our AI Paraphraser

13PROCESS MAP AND CONTROL CHART
Self-checkout Control chart data table:
No. of
products
Xbar X-Dbar UCL(X-Dbar +
3*sigma)
LCL(X-Dbar -
3*sigma)
8 8 10.98 36.94654834 -14.98654834
5 5 10.98 36.94654834 -14.98654834
2 2 10.98 36.94654834 -14.98654834
15 15 10.98 36.94654834 -14.98654834
17 17 10.98 36.94654834 -14.98654834
11 11 10.98 36.94654834 -14.98654834
2 2 10.98 36.94654834 -14.98654834
16 16 10.98 36.94654834 -14.98654834
5 5 10.98 36.94654834 -14.98654834
20 20 10.98 36.94654834 -14.98654834
5 5 10.98 36.94654834 -14.98654834
1 1 10.98 36.94654834 -14.98654834
4 4 10.98 36.94654834 -14.98654834
11 11 10.98 36.94654834 -14.98654834
14 14 10.98 36.94654834 -14.98654834
15 15 10.98 36.94654834 -14.98654834
2 2 10.98 36.94654834 -14.98654834
9 9 10.98 36.94654834 -14.98654834
22 22 10.98 36.94654834 -14.98654834
10 10 10.98 36.94654834 -14.98654834

14PROCESS MAP AND CONTROL CHART
6 6 10.98 36.94654834 -14.98654834
9 9 10.98 36.94654834 -14.98654834
14 14 10.98 36.94654834 -14.98654834
15 15 10.98 36.94654834 -14.98654834
3 3 10.98 36.94654834 -14.98654834
7 7 10.98 36.94654834 -14.98654834
30 30 10.98 36.94654834 -14.98654834
21 21 10.98 36.94654834 -14.98654834
3 3 10.98 36.94654834 -14.98654834
1 1 10.98 36.94654834 -14.98654834
5 5 10.98 36.94654834 -14.98654834
11 11 10.98 36.94654834 -14.98654834
13 13 10.98 36.94654834 -14.98654834
51 51 10.98 36.94654834 -14.98654834
14 14 10.98 36.94654834 -14.98654834
15 15 10.98 36.94654834 -14.98654834
10 10 10.98 36.94654834 -14.98654834
9 9 10.98 36.94654834 -14.98654834
1 1 10.98 36.94654834 -14.98654834
11 11 10.98 36.94654834 -14.98654834
6 6 10.98 36.94654834 -14.98654834
10 10 10.98 36.94654834 -14.98654834
6 6 10.98 36.94654834 -14.98654834
9 9 10.98 36.94654834 -14.98654834
14 14 10.98 36.94654834 -14.98654834
15 15 10.98 36.94654834 -14.98654834
3 3 10.98 36.94654834 -14.98654834
7 7 10.98 36.94654834 -14.98654834
30 30 10.98 36.94654834 -14.98654834
21 21 10.98 36.94654834 -14.98654834
3 3 10.98 36.94654834 -14.98654834
1 1 10.98 36.94654834 -14.98654834
5 5 10.98 36.94654834 -14.98654834
11 11 10.98 36.94654834 -14.98654834
13 13 10.98 36.94654834 -14.98654834
51 51 10.98 36.94654834 -14.98654834
14 14 10.98 36.94654834 -14.98654834
15 15 10.98 36.94654834 -14.98654834
10 10 10.98 36.94654834 -14.98654834
9 9 10.98 36.94654834 -14.98654834
1 1 10.98 36.94654834 -14.98654834
11 11 10.98 36.94654834 -14.98654834
6 6 10.98 36.94654834 -14.98654834
10 10 10.98 36.94654834 -14.98654834

15PROCESS MAP AND CONTROL CHART
20 20 10.98 36.94654834 -14.98654834
9 9 10.98 36.94654834 -14.98654834
6 6 10.98 36.94654834 -14.98654834
8 8 10.98 36.94654834 -14.98654834
20 20 10.98 36.94654834 -14.98654834
8 8 10.98 36.94654834 -14.98654834
16 16 10.98 36.94654834 -14.98654834
3 3 10.98 36.94654834 -14.98654834
Staff-checkout control chart data table:
No. of
products
Xbar X-Dbar UCL(X-Dbar +
3*sigma)
LCL(X-Dbar -
3*sigma)
8 8 10.98 36.94654834 -14.98654834
5 5 10.98 36.94654834 -14.98654834
2 2 10.98 36.94654834 -14.98654834
15 15 10.98 36.94654834 -14.98654834
17 17 10.98 36.94654834 -14.98654834
11 11 10.98 36.94654834 -14.98654834
2 2 10.98 36.94654834 -14.98654834
16 16 10.98 36.94654834 -14.98654834
5 5 10.98 36.94654834 -14.98654834
20 20 10.98 36.94654834 -14.98654834
20 20 10.98 36.94654834 -14.98654834
9 9 10.98 36.94654834 -14.98654834
6 6 10.98 36.94654834 -14.98654834
8 8 10.98 36.94654834 -14.98654834
20 20 10.98 36.94654834 -14.98654834
8 8 10.98 36.94654834 -14.98654834
16 16 10.98 36.94654834 -14.98654834
3 3 10.98 36.94654834 -14.98654834
Staff-checkout control chart data table:
No. of
products
Xbar X-Dbar UCL(X-Dbar +
3*sigma)
LCL(X-Dbar -
3*sigma)
8 8 10.98 36.94654834 -14.98654834
5 5 10.98 36.94654834 -14.98654834
2 2 10.98 36.94654834 -14.98654834
15 15 10.98 36.94654834 -14.98654834
17 17 10.98 36.94654834 -14.98654834
11 11 10.98 36.94654834 -14.98654834
2 2 10.98 36.94654834 -14.98654834
16 16 10.98 36.94654834 -14.98654834
5 5 10.98 36.94654834 -14.98654834
20 20 10.98 36.94654834 -14.98654834
Secure Best Marks with AI Grader
Need help grading? Try our AI Grader for instant feedback on your assignments.

16PROCESS MAP AND CONTROL CHART
5 5 10.98 36.94654834 -14.98654834
1 1 10.98 36.94654834 -14.98654834
4 4 10.98 36.94654834 -14.98654834
11 11 10.98 36.94654834 -14.98654834
14 14 10.98 36.94654834 -14.98654834
15 15 10.98 36.94654834 -14.98654834
2 2 10.98 36.94654834 -14.98654834
9 9 10.98 36.94654834 -14.98654834
22 22 10.98 36.94654834 -14.98654834
10 10 10.98 36.94654834 -14.98654834
6 6 10.98 36.94654834 -14.98654834
9 9 10.98 36.94654834 -14.98654834
14 14 10.98 36.94654834 -14.98654834
15 15 10.98 36.94654834 -14.98654834
3 3 10.98 36.94654834 -14.98654834
7 7 10.98 36.94654834 -14.98654834
30 30 10.98 36.94654834 -14.98654834
21 21 10.98 36.94654834 -14.98654834
3 3 10.98 36.94654834 -14.98654834
1 1 10.98 36.94654834 -14.98654834
5 5 10.98 36.94654834 -14.98654834
11 11 10.98 36.94654834 -14.98654834
13 13 10.98 36.94654834 -14.98654834
5 5 10.98 36.94654834 -14.98654834
1 1 10.98 36.94654834 -14.98654834
4 4 10.98 36.94654834 -14.98654834
11 11 10.98 36.94654834 -14.98654834
14 14 10.98 36.94654834 -14.98654834
15 15 10.98 36.94654834 -14.98654834
2 2 10.98 36.94654834 -14.98654834
9 9 10.98 36.94654834 -14.98654834
22 22 10.98 36.94654834 -14.98654834
10 10 10.98 36.94654834 -14.98654834
6 6 10.98 36.94654834 -14.98654834
9 9 10.98 36.94654834 -14.98654834
14 14 10.98 36.94654834 -14.98654834
15 15 10.98 36.94654834 -14.98654834
3 3 10.98 36.94654834 -14.98654834
7 7 10.98 36.94654834 -14.98654834
30 30 10.98 36.94654834 -14.98654834
21 21 10.98 36.94654834 -14.98654834
3 3 10.98 36.94654834 -14.98654834
1 1 10.98 36.94654834 -14.98654834
5 5 10.98 36.94654834 -14.98654834
11 11 10.98 36.94654834 -14.98654834
13 13 10.98 36.94654834 -14.98654834

17PROCESS MAP AND CONTROL CHART
51 51 10.98 36.94654834 -14.98654834
14 14 10.98 36.94654834 -14.98654834
15 15 10.98 36.94654834 -14.98654834
10 10 10.98 36.94654834 -14.98654834
9 9 10.98 36.94654834 -14.98654834
1 1 10.98 36.94654834 -14.98654834
11 11 10.98 36.94654834 -14.98654834
6 6 10.98 36.94654834 -14.98654834
10 10 10.98 36.94654834 -14.98654834
20 20 10.98 36.94654834 -14.98654834
9 9 10.98 36.94654834 -14.98654834
6 6 10.98 36.94654834 -14.98654834
8 8 10.98 36.94654834 -14.98654834
20 20 10.98 36.94654834 -14.98654834
8 8 10.98 36.94654834 -14.98654834
16 16 10.98 36.94654834 -14.98654834
3 3 10.98 36.94654834 -14.98654834
X-Bar control chart for self-checkout:

18PROCESS MAP AND CONTROL CHART
0 2 4 6 8 10 12
-5
0
5
10
15
20
25
X-bar chart for self checkout
Xbar X-Dbar
UCL(X-Dvar + 3*Sigma) LCL(X-Dbar - 3*Sigma)
Group
Average products transaction
R-Bar control chart for self-checkout:
0 2 4 6 8 10 12
0
5
10
15
20
25
30
35
40
45
Rbar chart for self checkout
Range Rbar UCL(D4*Rbar) LCL(D3*Rbar)
Group number
Range of products transactions
0 2 4 6 8 10 12
-5
0
5
10
15
20
25
X-bar chart for self checkout
Xbar X-Dbar
UCL(X-Dvar + 3*Sigma) LCL(X-Dbar - 3*Sigma)
Group
Average products transaction
R-Bar control chart for self-checkout:
0 2 4 6 8 10 12
0
5
10
15
20
25
30
35
40
45
Rbar chart for self checkout
Range Rbar UCL(D4*Rbar) LCL(D3*Rbar)
Group number
Range of products transactions
Paraphrase This Document
Need a fresh take? Get an instant paraphrase of this document with our AI Paraphraser

19PROCESS MAP AND CONTROL CHART
X-bar control chart for staff-checkout:
0 2 4 6 8 10 12
-40
-20
0
20
40
60
80
X-bar chart of staff checkout
Xbar X-Dbar
UCL(X-Dvar + 3*Sigma) LCL(X-Dbar - 3*Sigma)
Group number
Average product transactions
R-bar control chart for staff-checkout:
X-bar control chart for staff-checkout:
0 2 4 6 8 10 12
-40
-20
0
20
40
60
80
X-bar chart of staff checkout
Xbar X-Dbar
UCL(X-Dvar + 3*Sigma) LCL(X-Dbar - 3*Sigma)
Group number
Average product transactions
R-bar control chart for staff-checkout:

20PROCESS MAP AND CONTROL CHART
0 2 4 6 8 10 12
0
50
100
150
200
250
R-bar chart of staff checkout
Range Rbar UCL(D4*Rbar) LCL(D3*Rbar)
Group number
Range of number of product transaction
0 2 4 6 8 10 12
0
50
100
150
200
250
R-bar chart of staff checkout
Range Rbar UCL(D4*Rbar) LCL(D3*Rbar)
Group number
Range of number of product transaction
1 out of 21
Related Documents

Your All-in-One AI-Powered Toolkit for Academic Success.
 +13062052269
info@desklib.com
Available 24*7 on WhatsApp / Email
Unlock your academic potential
© 2024  |  Zucol Services PVT LTD  |  All rights reserved.