Productivity and Collaboration Tools: A Sales Data Analysis Report
VerifiedAdded on 2023/06/04
|8
|640
|442
Presentation
AI Summary
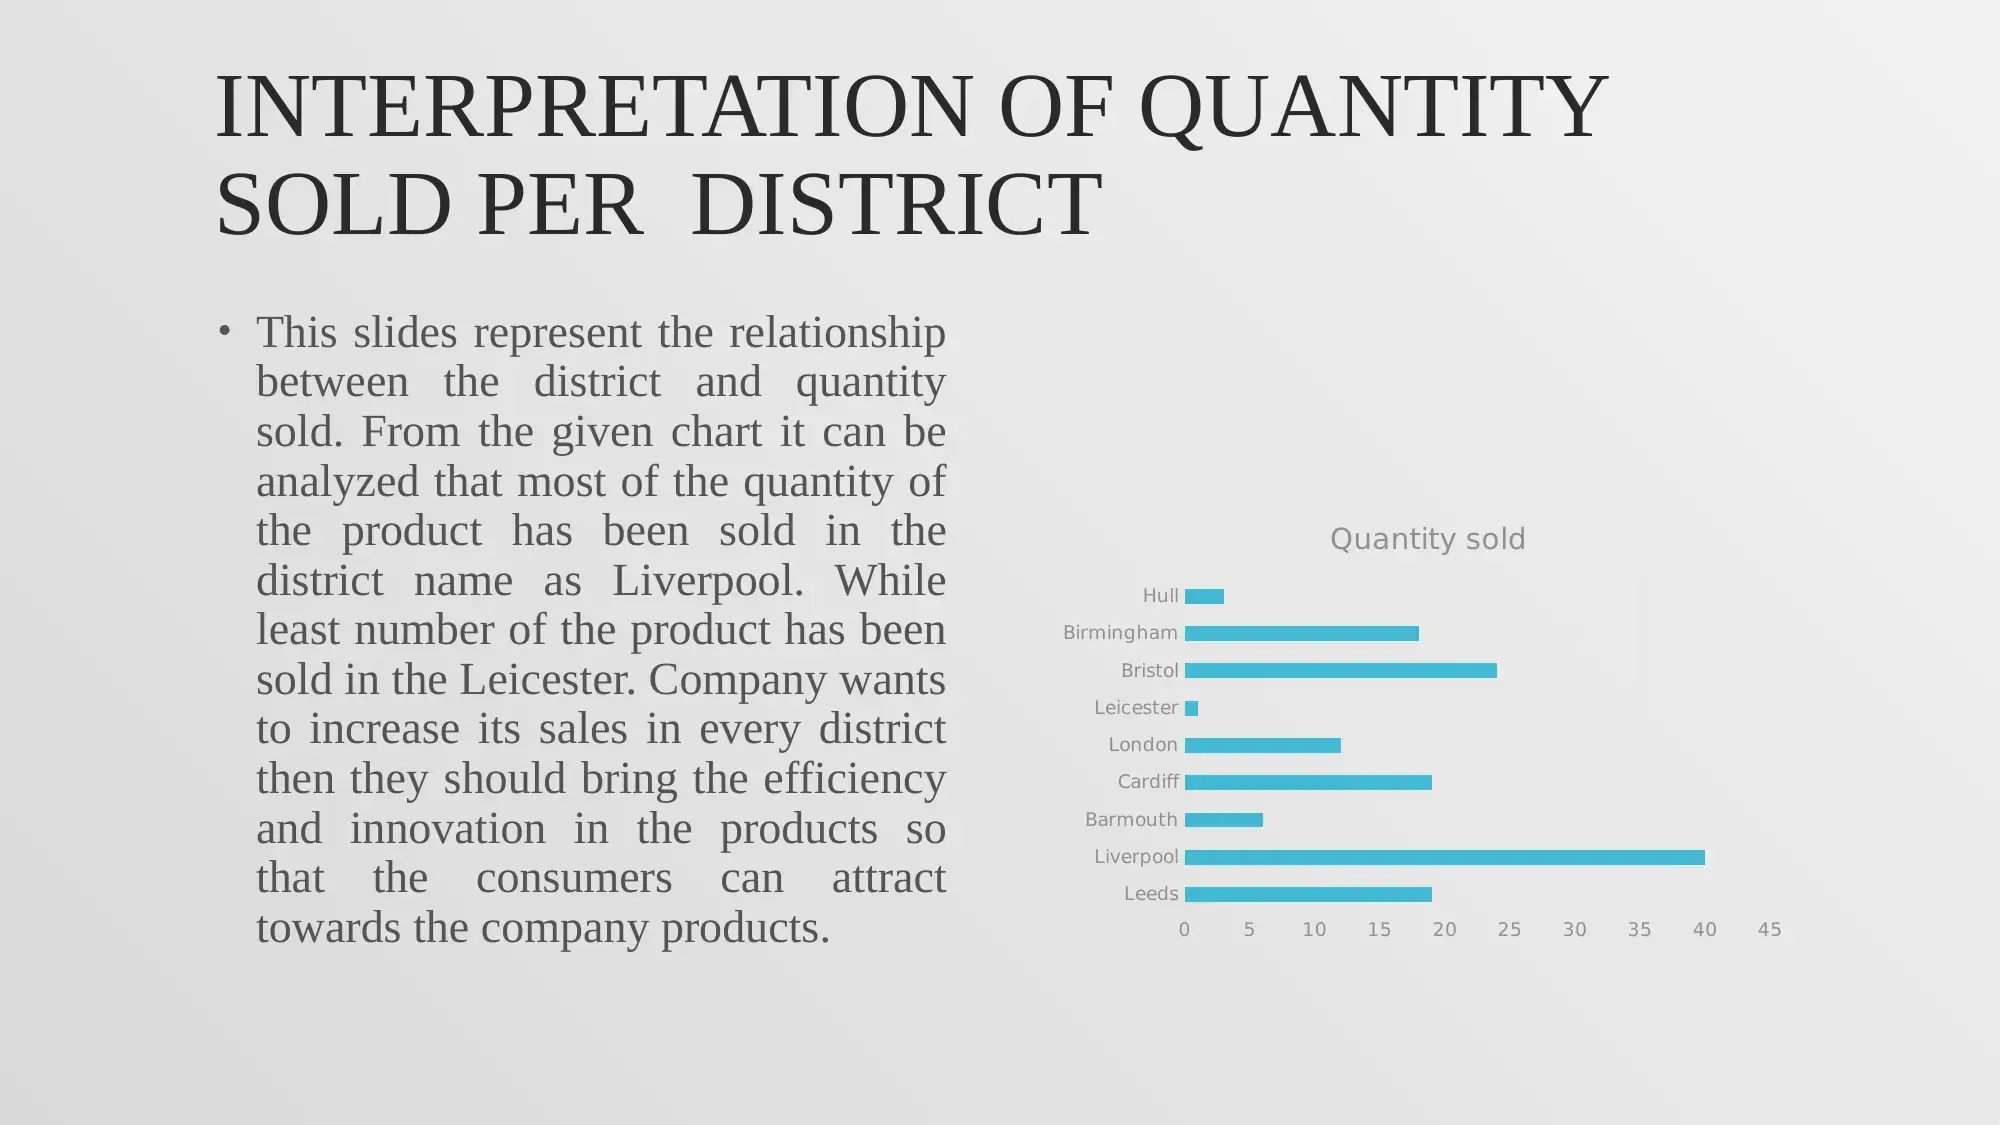
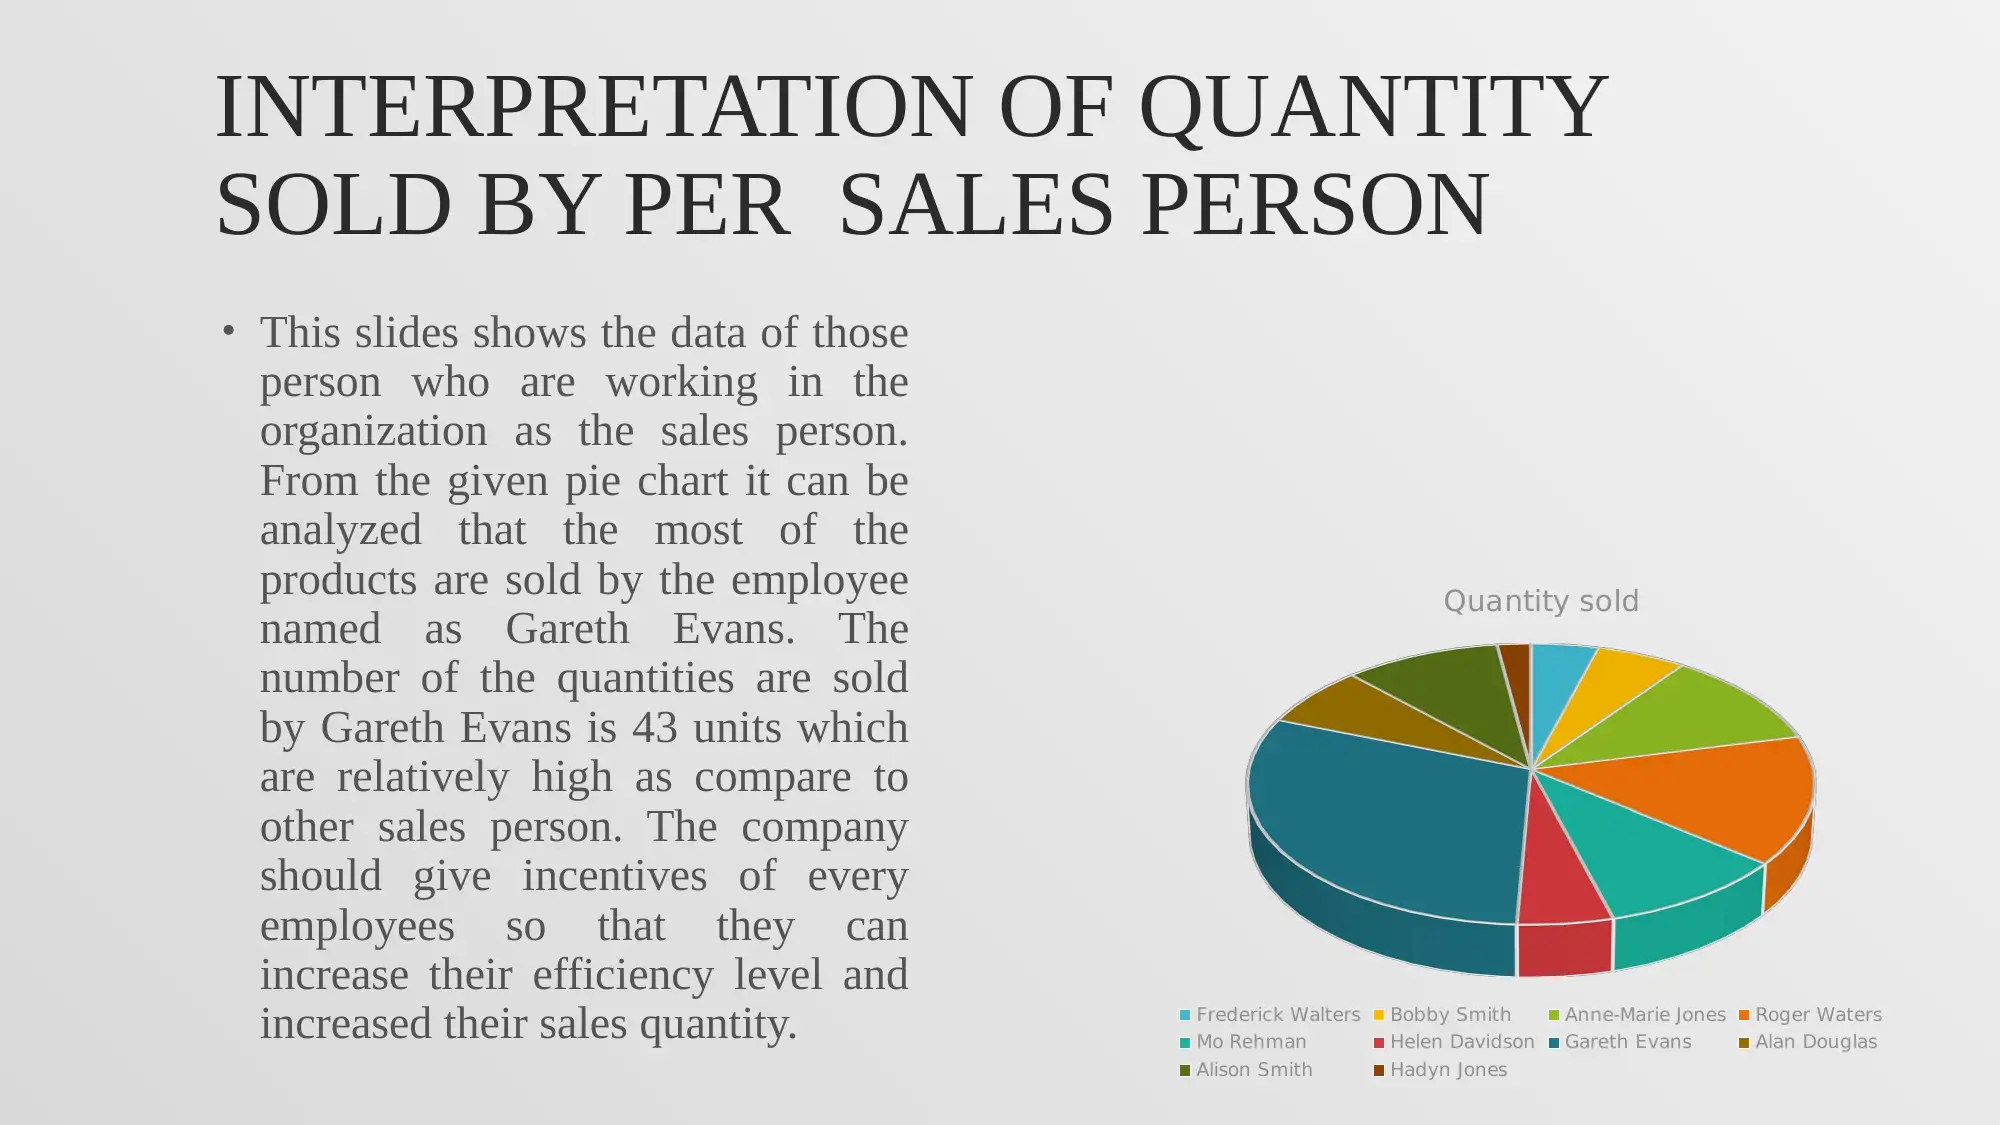
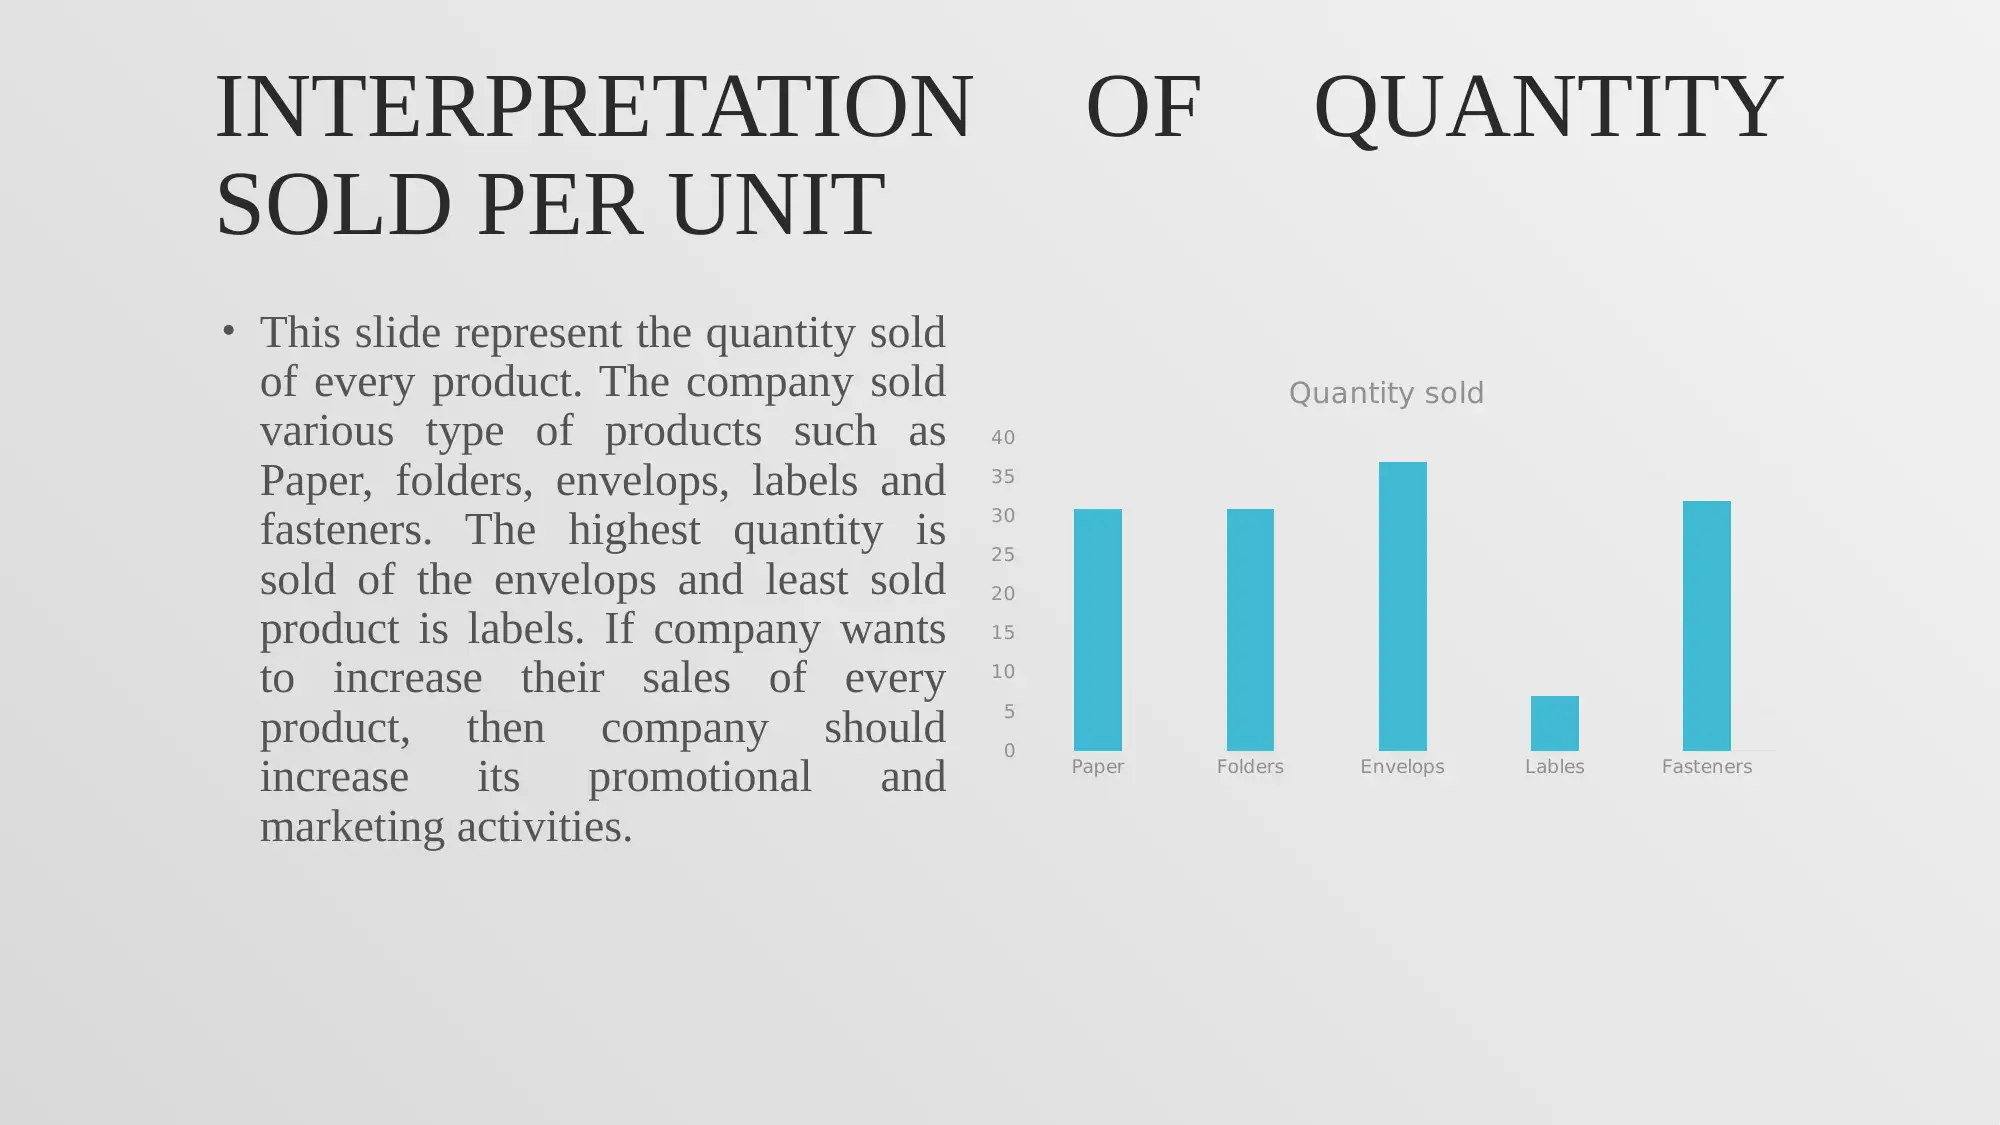
This presentation provides a comprehensive analysis of sales data using various charts and tables to understand an organization's productivity. It interprets sales quantities by district, highlighting Liverpool as the top-performing district and Leicester as the lowest. The analysis extends to sales per person, noting Gareth Evans as the highest performer, and sales per product, with envelopes leading and labels lagging. The presentation concludes with recommendations to improve sales consistency across all products and districts, emphasizing the importance of incentives for sales personnel and enhanced promotional activities. References to relevant research on productivity software and smart offices support the analysis.


1 out of 8
Your All-in-One AI-Powered Toolkit for Academic Success.
+13062052269
info@desklib.com
Available 24*7 on WhatsApp / Email
![[object Object]](/_next/static/media/star-bottom.7253800d.svg)
Copyright © 2020–2025 A2Z Services. All Rights Reserved. Developed and managed by ZUCOL.