Business Analytics: Cox Electric Profit Calculation

Verified

Added on  2022/09/27

|6
|961
|18
Homework Assignment
AI Summary
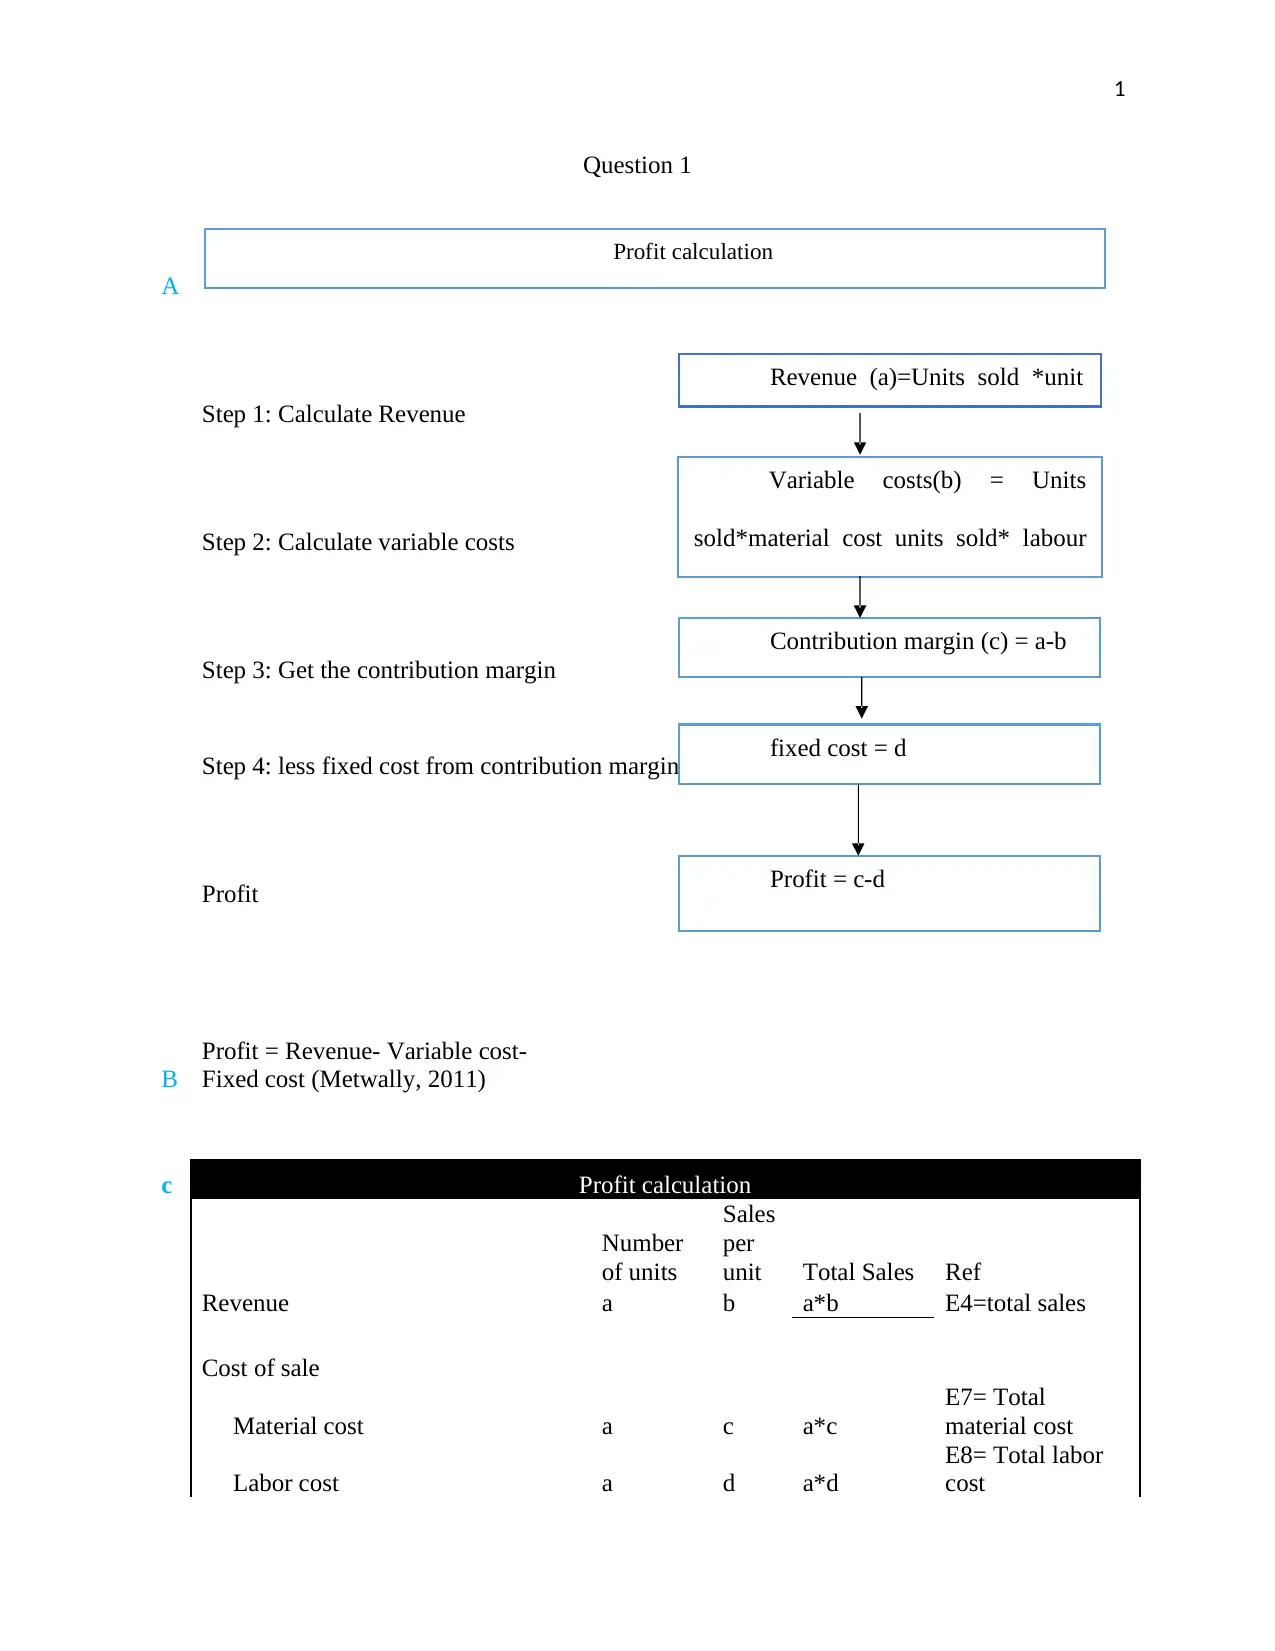
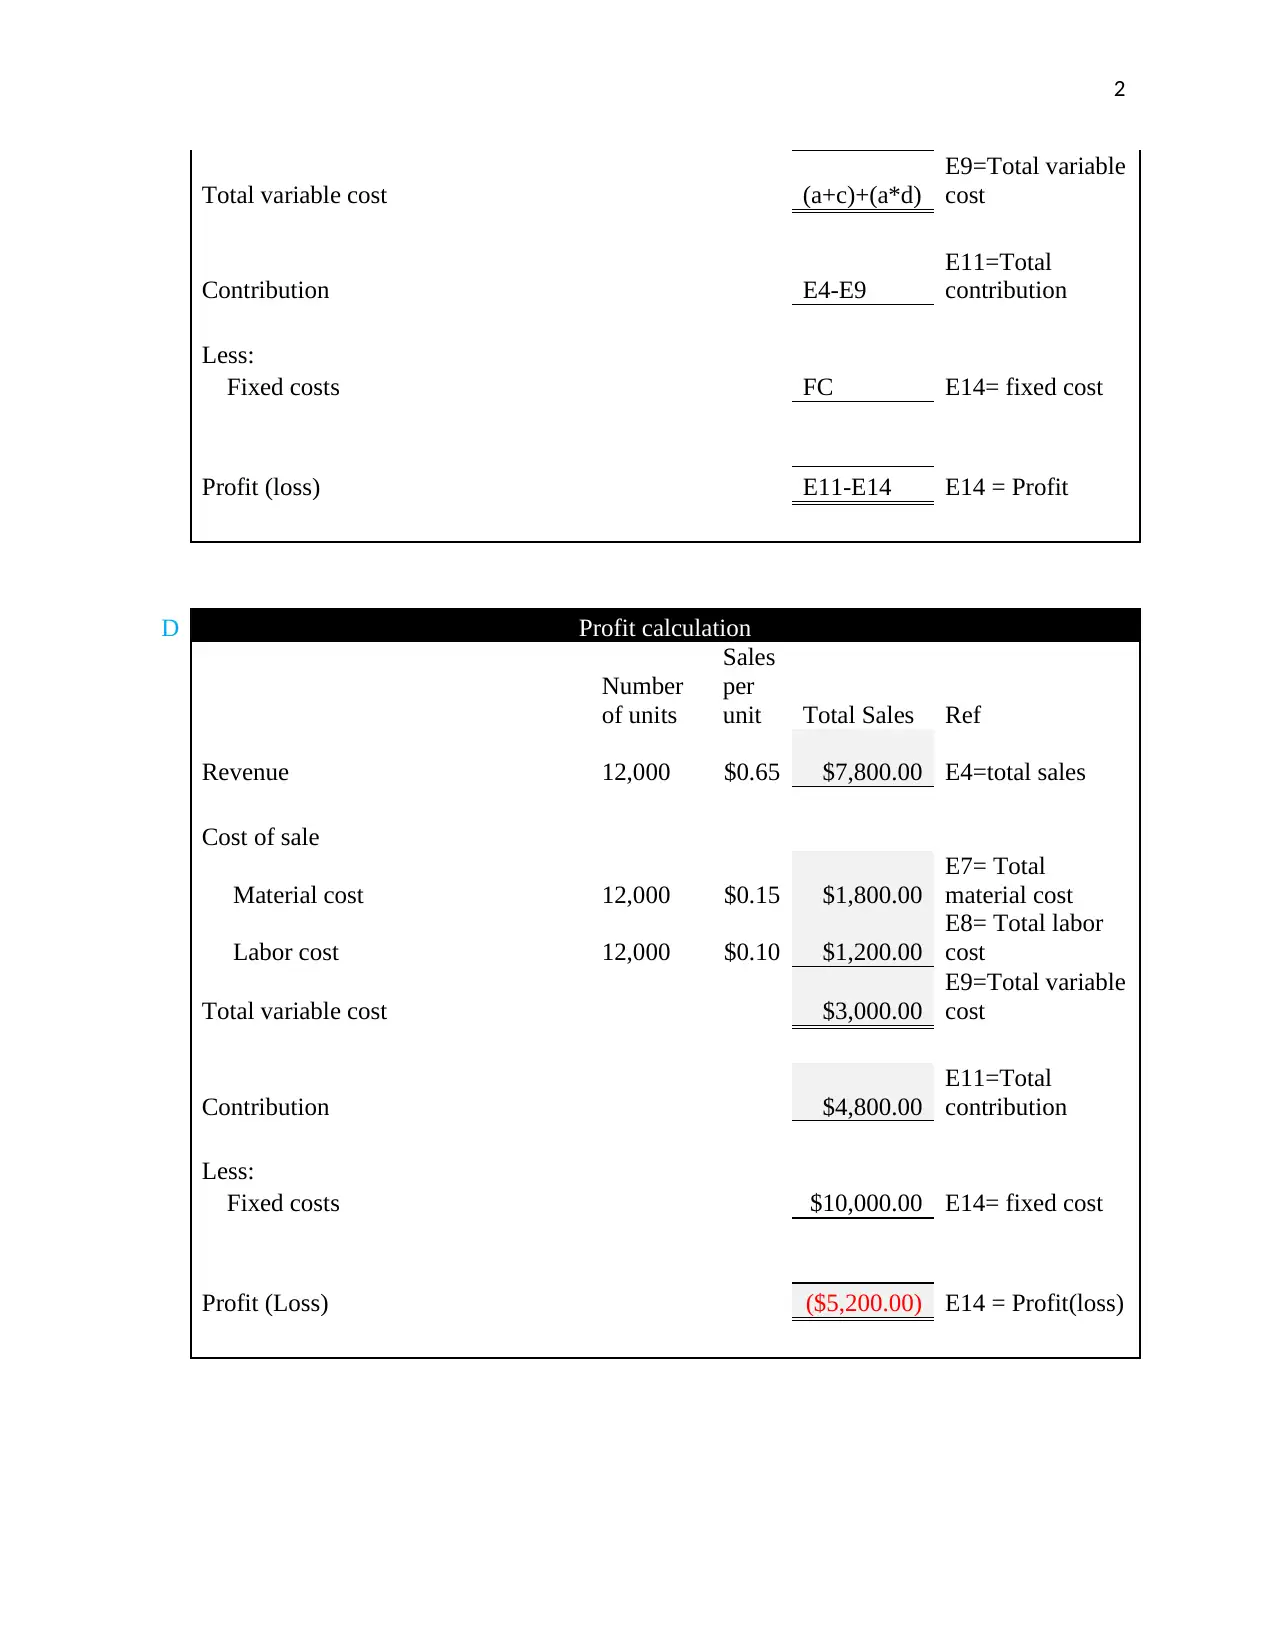
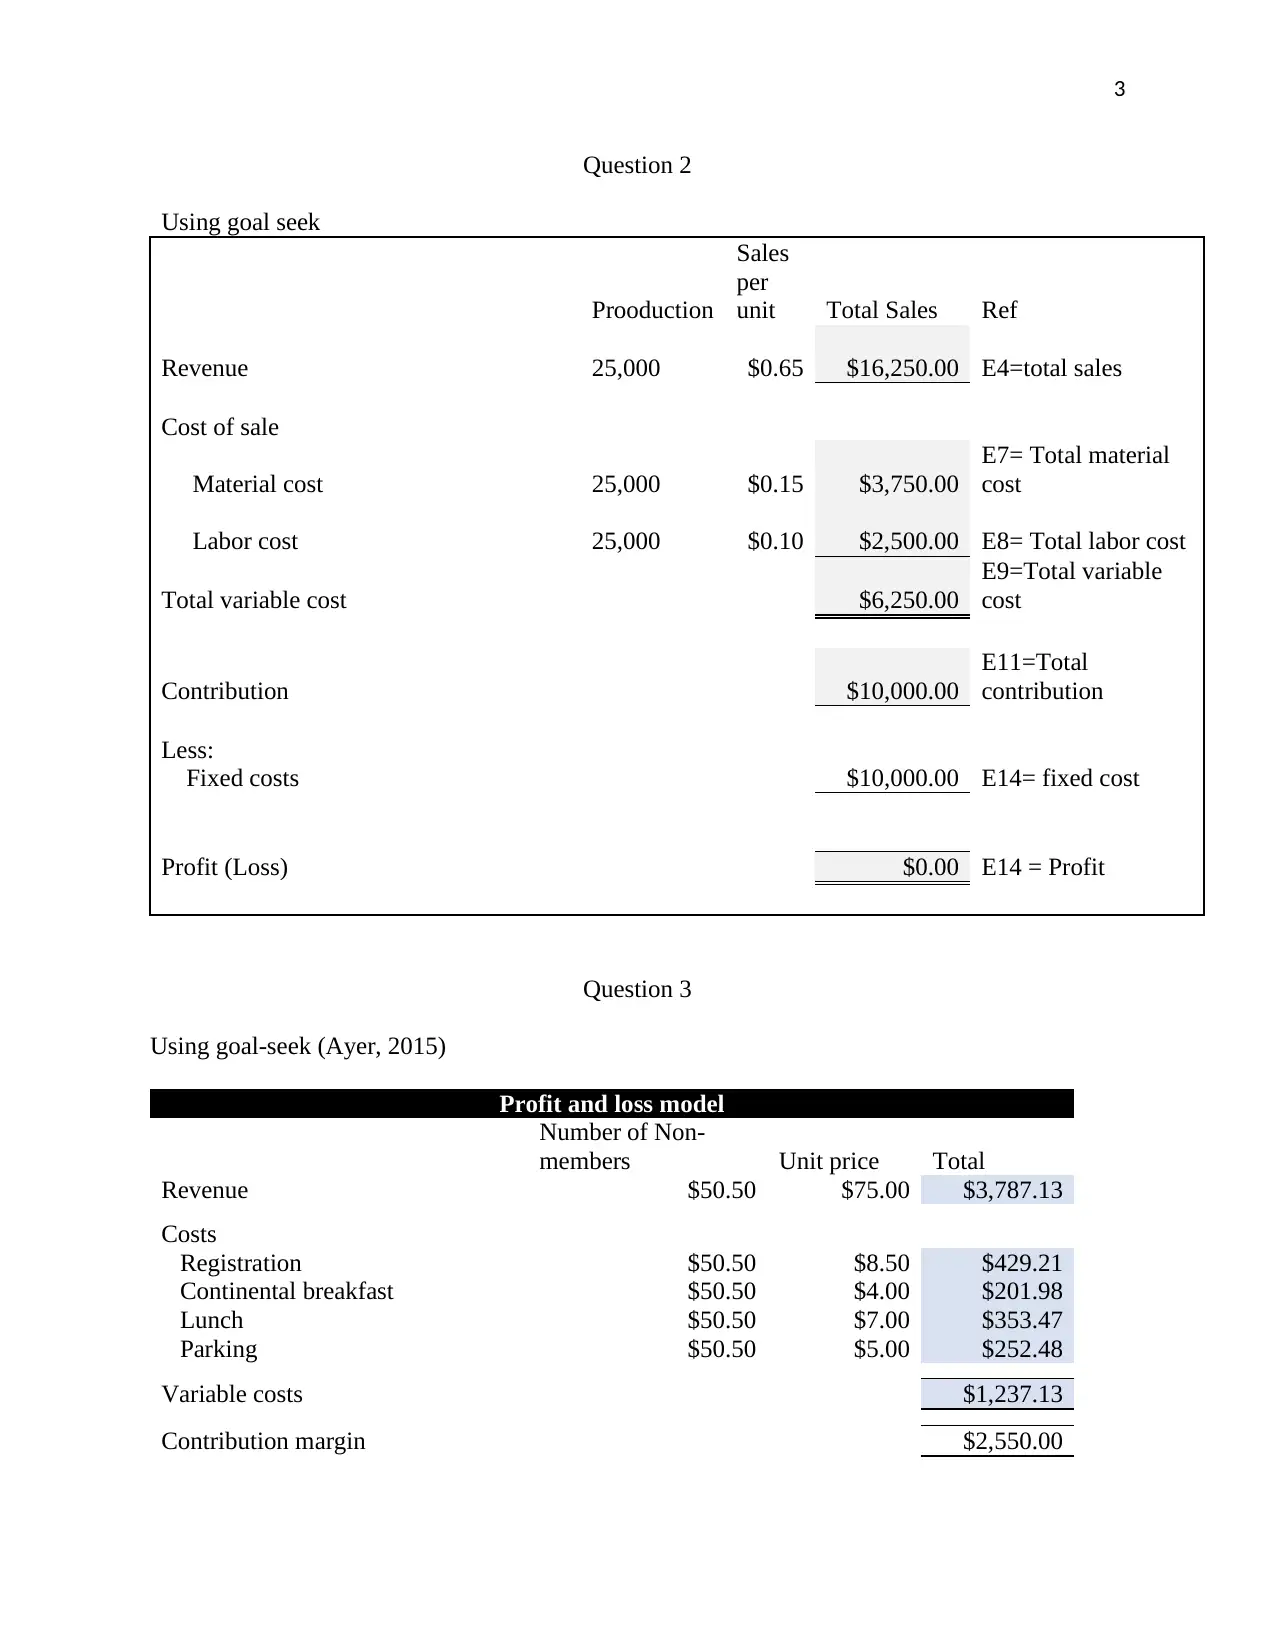
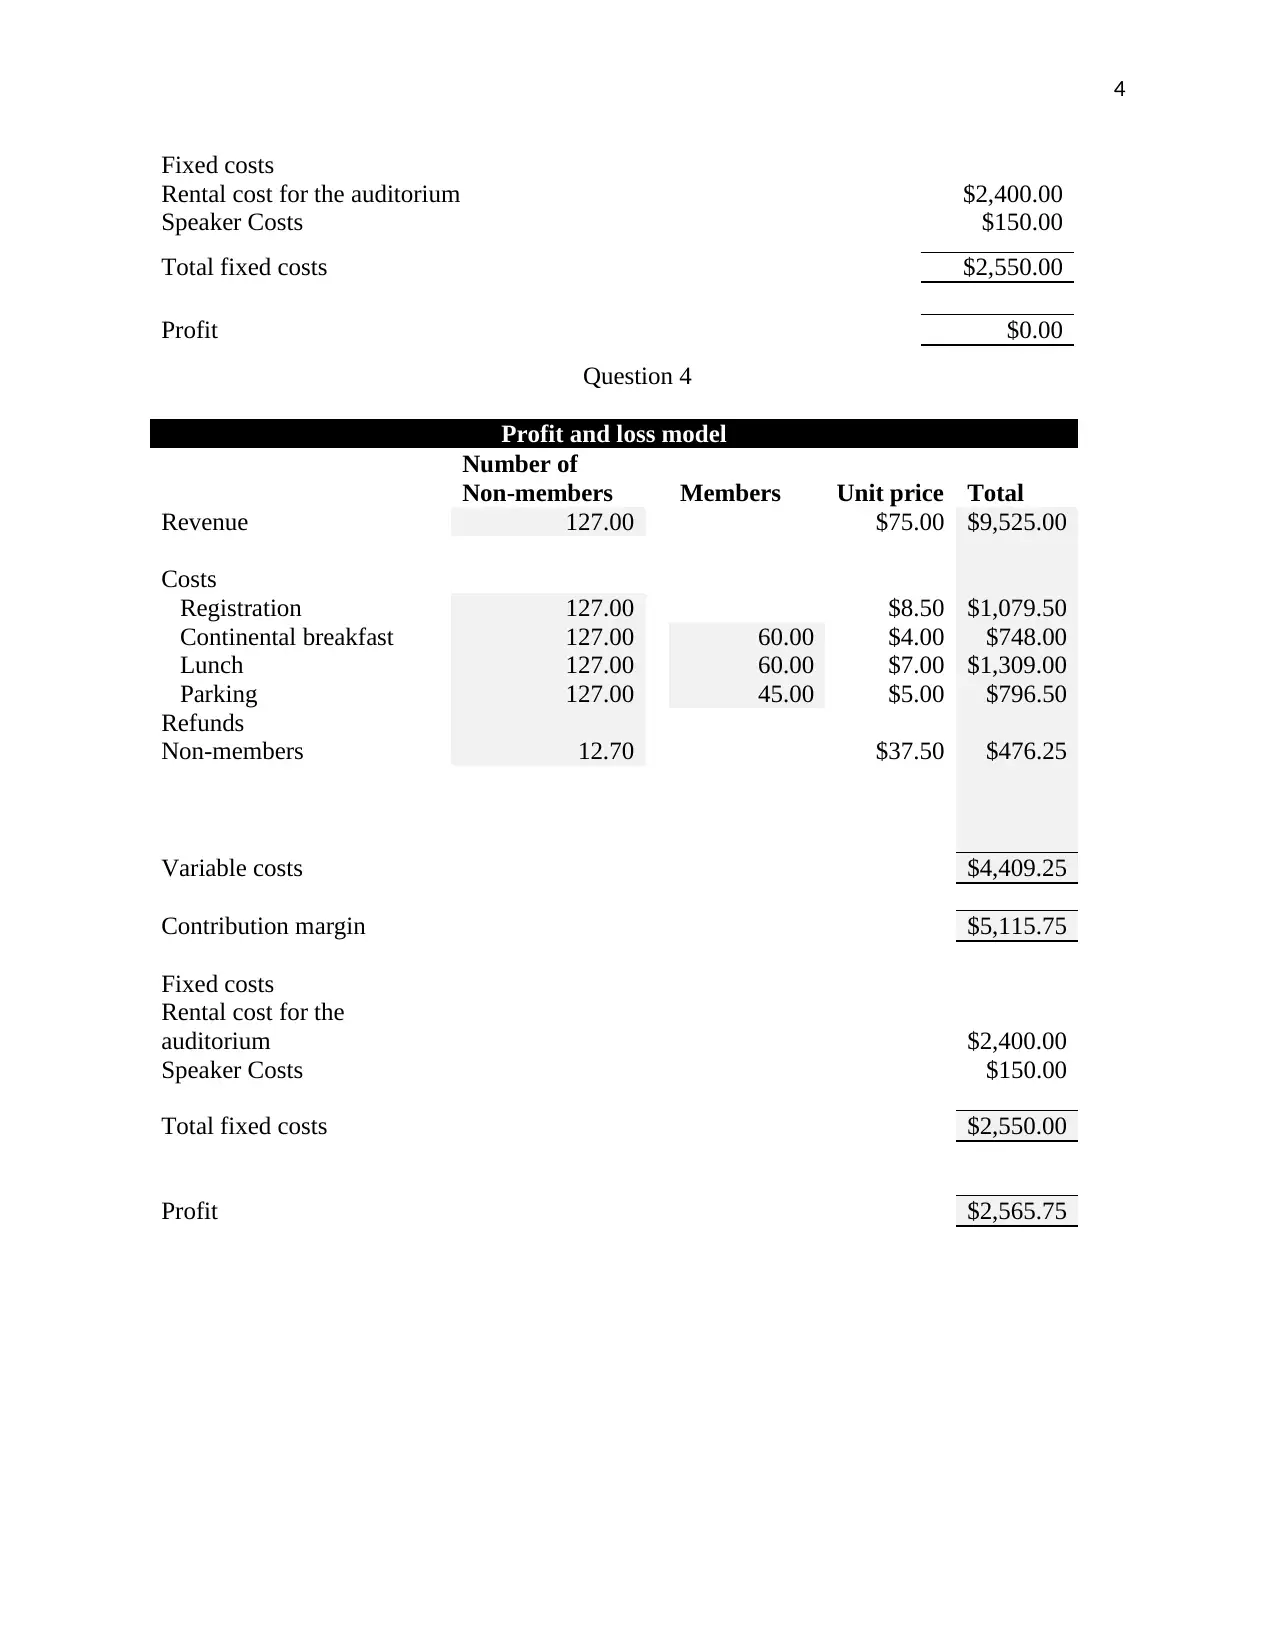
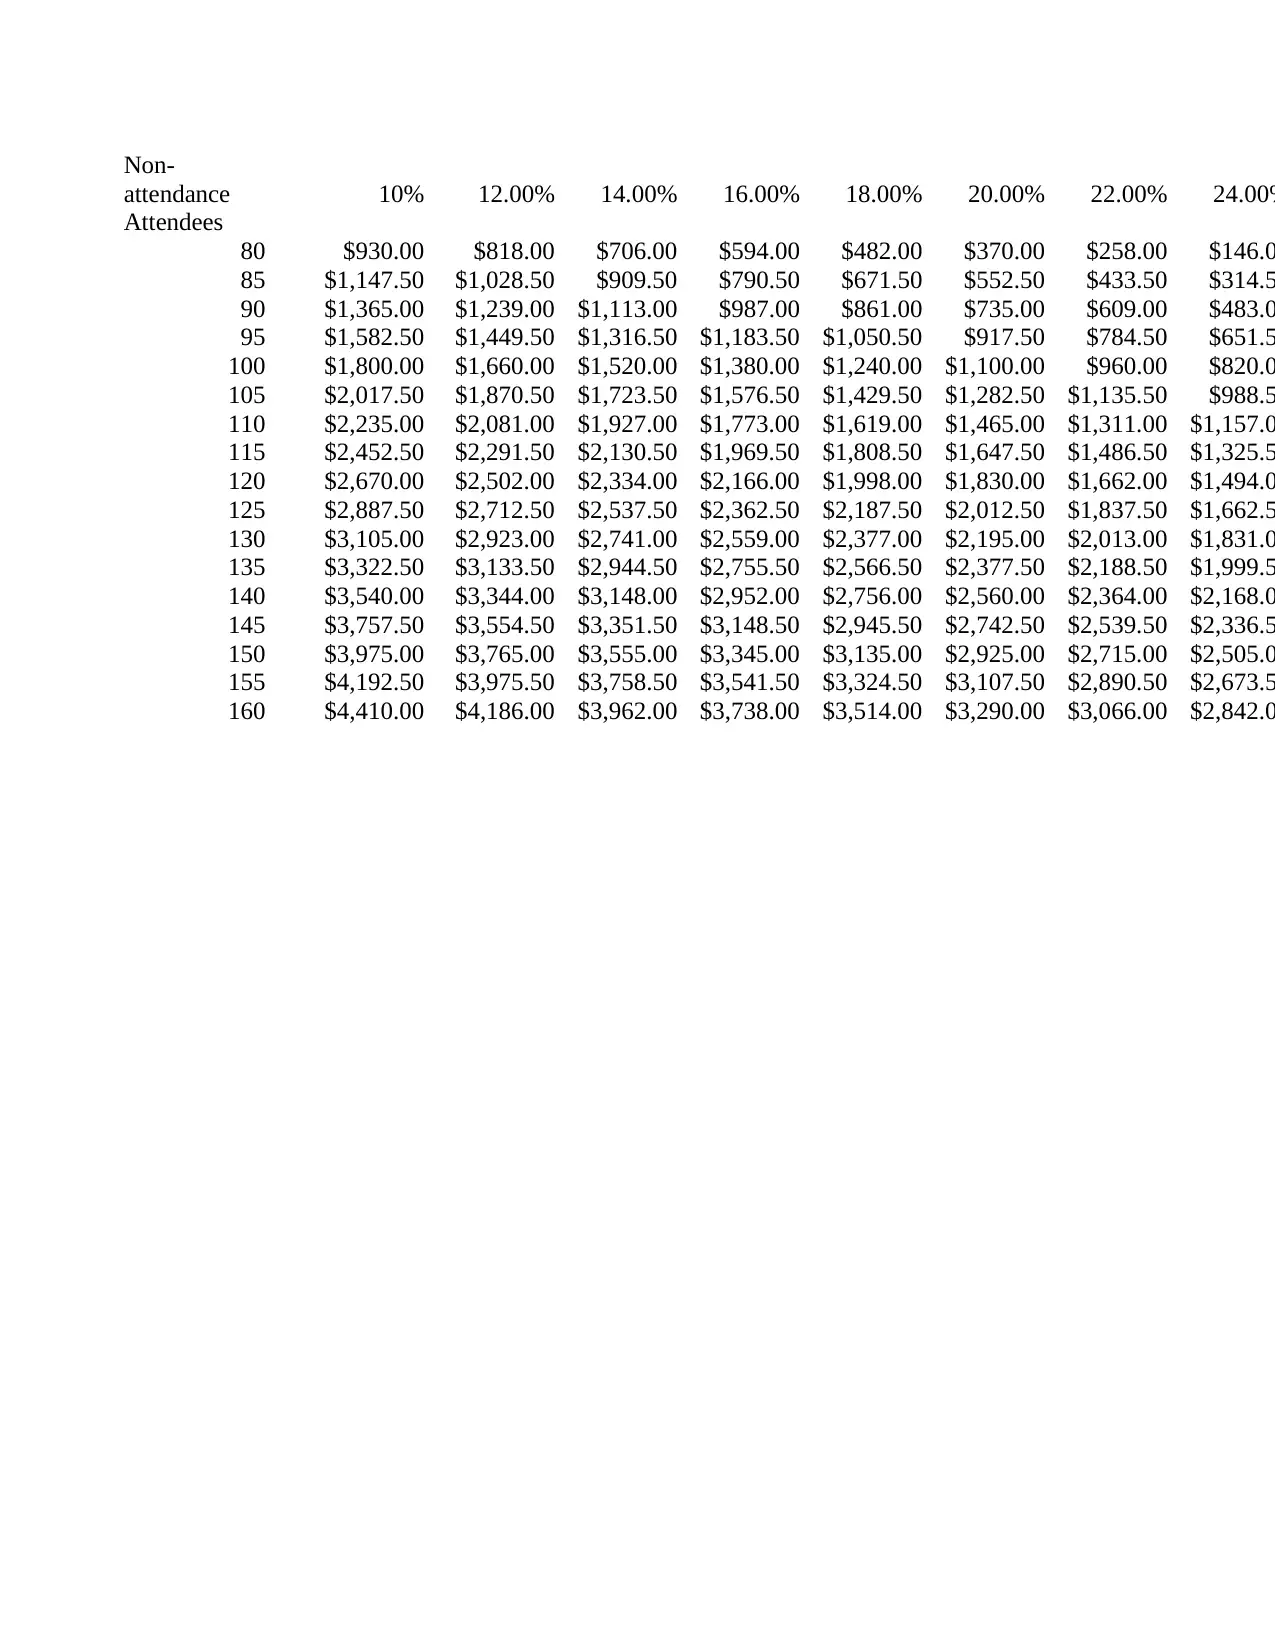
This assignment focuses on profit calculation using spreadsheet models. It begins with the fundamentals of calculating profit, including revenue, variable costs, fixed costs, and contribution margin. The assignment presents a case study of Cox Electric, a company that makes electronic components, and guides the creation of an Excel model to calculate profit based on different production volumes. The assignment covers building an influence diagram, creating a mathematical model, and constructing an Excel model. Students are required to calculate profit for a given production volume, create a one-way data table to analyze profit at different production volumes and use goal-seek to determine the production volume needed to achieve a profit of zero. The assignment further explores profit and loss models, incorporating scenarios with non-members and members, and analyzes the impact of non-attendance on profit. The assignment provides all the necessary information, formulas, and calculations needed to understand and solve the problems, using real-world examples and references.
Document Page
1
Question 1
A
Step 1: Calculate Revenue
Step 2: Calculate variable costs
Step 3: Get the contribution margin
Step 4: less fixed cost from contribution margin
Profit
B
Profit = Revenue- Variable cost-
Fixed cost (Metwally, 2011)
c Profit calculation
Number
of units
Sales
per
unit Total Sales Ref
Revenue a b a*b E4=total sales
Cost of sale
Material cost a c a*c
E7= Total
material cost
Labor cost a d a*d
E8= Total labor
cost
Profit calculation
Revenue (a)=Units sold *unit
Variable costs(b) = Units
sold*material cost units sold* labour
Contribution margin (c) = a-b
fixed cost = d
Profit = c-d
tabler-icon-diamond-filled.svg

Paraphrase This Document

Need a fresh take? Get an instant paraphrase of this document with our AI Paraphraser
Document Page
2
Total variable cost (a+c)+(a*d)
E9=Total variable
cost
Contribution E4-E9
E11=Total
contribution
Less:
Fixed costs FC E14= fixed cost
Profit (loss) E11-E14 E14 = Profit
D Profit calculation
Number
of units
Sales
per
unit Total Sales Ref
Revenue 12,000 $0.65 $7,800.00 E4=total sales
Cost of sale
Material cost 12,000 $0.15 $1,800.00
E7= Total
material cost
Labor cost 12,000 $0.10 $1,200.00
E8= Total labor
cost
Total variable cost $3,000.00
E9=Total variable
cost
Contribution $4,800.00
E11=Total
contribution
Less:
Fixed costs $10,000.00 E14= fixed cost
Profit (Loss) ($5,200.00) E14 = Profit(loss)
Document Page
3
Question 2
Using goal seek
Prooduction
Sales
per
unit Total Sales Ref
Revenue 25,000 $0.65 $16,250.00 E4=total sales
Cost of sale
Material cost 25,000 $0.15 $3,750.00
E7= Total material
cost
Labor cost 25,000 $0.10 $2,500.00 E8= Total labor cost
Total variable cost $6,250.00
E9=Total variable
cost
Contribution $10,000.00
E11=Total
contribution
Less:
Fixed costs $10,000.00 E14= fixed cost
Profit (Loss) $0.00 E14 = Profit
Question 3
Using goal-seek (Ayer, 2015)
Profit and loss model
Number of Non-
members Unit price Total
Revenue $50.50 $75.00 $3,787.13
Costs
Registration $50.50 $8.50 $429.21
Continental breakfast $50.50 $4.00 $201.98
Lunch $50.50 $7.00 $353.47
Parking $50.50 $5.00 $252.48
Variable costs $1,237.13
Contribution margin $2,550.00
Document Page
4
Fixed costs
Rental cost for the auditorium $2,400.00
Speaker Costs $150.00
Total fixed costs $2,550.00
Profit $0.00
Question 4
Profit and loss model
Number of
Non-members Members Unit price Total
Revenue 127.00 $75.00 $9,525.00
Costs
Registration 127.00 $8.50 $1,079.50
Continental breakfast 127.00 60.00 $4.00 $748.00
Lunch 127.00 60.00 $7.00 $1,309.00
Parking 127.00 45.00 $5.00 $796.50
Refunds
Non-members 12.70 $37.50 $476.25
Variable costs $4,409.25
Contribution margin $5,115.75
Fixed costs
Rental cost for the
auditorium $2,400.00
Speaker Costs $150.00
Total fixed costs $2,550.00
Profit $2,565.75
tabler-icon-diamond-filled.svg

Paraphrase This Document

Need a fresh take? Get an instant paraphrase of this document with our AI Paraphraser
Document Page
Non-
attendance 10% 12.00% 14.00% 16.00% 18.00% 20.00% 22.00% 24.00%
Attendees
80 $930.00 $818.00 $706.00 $594.00 $482.00 $370.00 $258.00 $146.0
85 $1,147.50 $1,028.50 $909.50 $790.50 $671.50 $552.50 $433.50 $314.5
90 $1,365.00 $1,239.00 $1,113.00 $987.00 $861.00 $735.00 $609.00 $483.0
95 $1,582.50 $1,449.50 $1,316.50 $1,183.50 $1,050.50 $917.50 $784.50 $651.5
100 $1,800.00 $1,660.00 $1,520.00 $1,380.00 $1,240.00 $1,100.00 $960.00 $820.0
105 $2,017.50 $1,870.50 $1,723.50 $1,576.50 $1,429.50 $1,282.50 $1,135.50 $988.5
110 $2,235.00 $2,081.00 $1,927.00 $1,773.00 $1,619.00 $1,465.00 $1,311.00 $1,157.0
115 $2,452.50 $2,291.50 $2,130.50 $1,969.50 $1,808.50 $1,647.50 $1,486.50 $1,325.5
120 $2,670.00 $2,502.00 $2,334.00 $2,166.00 $1,998.00 $1,830.00 $1,662.00 $1,494.0
125 $2,887.50 $2,712.50 $2,537.50 $2,362.50 $2,187.50 $2,012.50 $1,837.50 $1,662.5
130 $3,105.00 $2,923.00 $2,741.00 $2,559.00 $2,377.00 $2,195.00 $2,013.00 $1,831.0
135 $3,322.50 $3,133.50 $2,944.50 $2,755.50 $2,566.50 $2,377.50 $2,188.50 $1,999.5
140 $3,540.00 $3,344.00 $3,148.00 $2,952.00 $2,756.00 $2,560.00 $2,364.00 $2,168.0
145 $3,757.50 $3,554.50 $3,351.50 $3,148.50 $2,945.50 $2,742.50 $2,539.50 $2,336.5
150 $3,975.00 $3,765.00 $3,555.00 $3,345.00 $3,135.00 $2,925.00 $2,715.00 $2,505.0
155 $4,192.50 $3,975.50 $3,758.50 $3,541.50 $3,324.50 $3,107.50 $2,890.50 $2,673.5
160 $4,410.00 $4,186.00 $3,962.00 $3,738.00 $3,514.00 $3,290.00 $3,066.00 $2,842.0
Document Page
6
References
Ayer, G. (2015). Excel in Excel®!*. Energy Engineering, 112(2), 14-25. doi:
10.1080/01998595.2015.11090950
Metwally, K. (2011). Understanding Internal Markets Through Franchise Contribution Margin
Analysis. SSRN Electronic Journal. doi: 10.2139/ssrn.1770942
chevron_up_icon
1 out of 6
circle_padding
hide_on_mobile
zoom_out_icon
[object Object]