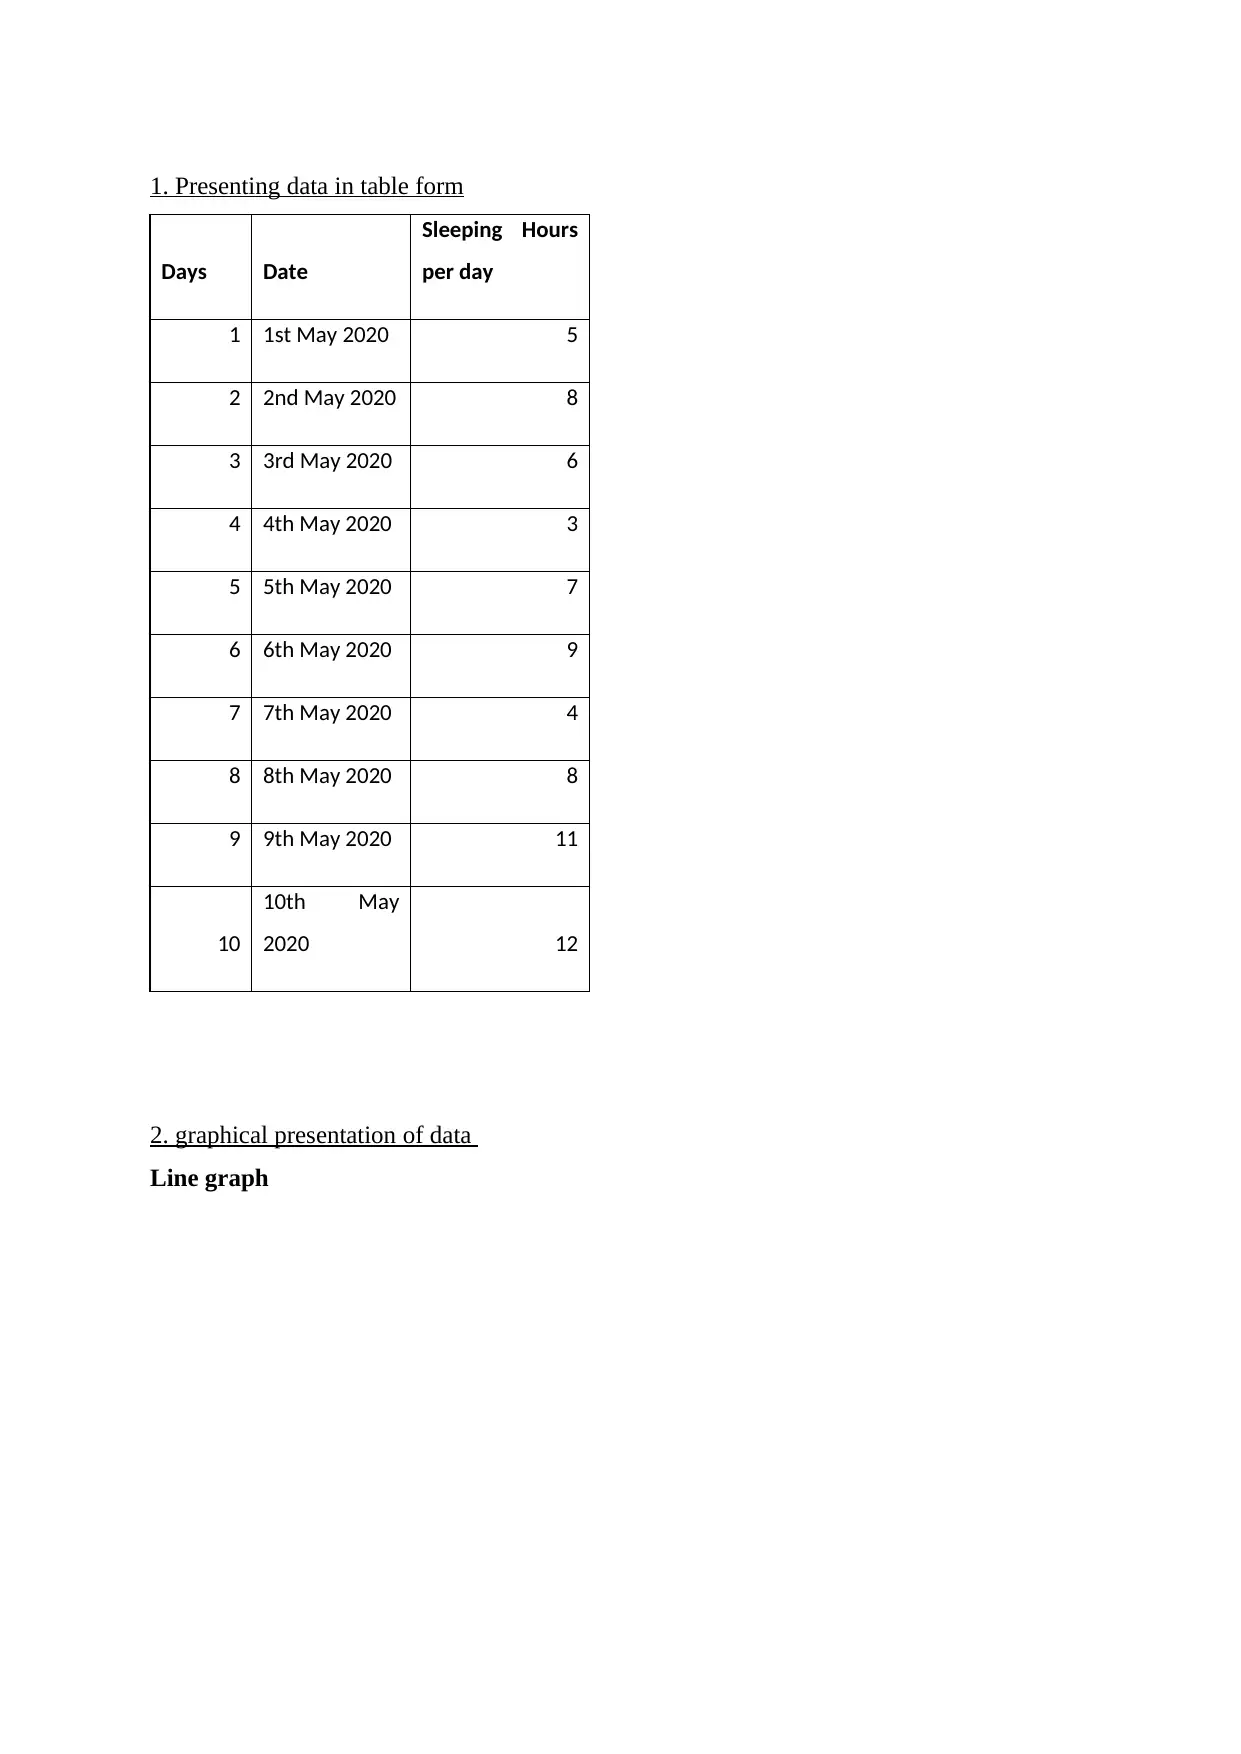
Presenting Data in Table Form
VerifiedAdded on 2023/01/11
|12
|1259
|78
AI Summary
This document discusses the techniques and importance of presenting data in table form. It provides examples and tips for effective data presentation. The document also includes a section on determining descriptive statistics and using the linear forecasting model for predicting values. It is a valuable resource for students studying statistics and data analysis.
Contribute Materials
Your contribution can guide someone’s learning journey. Share your
documents today.


1 out of 12
Related Documents


Your All-in-One AI-Powered Toolkit for Academic Success.
+13062052269
info@desklib.com
Available 24*7 on WhatsApp / Email
![[object Object]](/_next/static/media/star-bottom.7253800d.svg)
© 2024 | Zucol Services PVT LTD | All rights reserved.