Project Analysis for Upgrade Customer Management System of COVI - Report
VerifiedAdded on 2022/06/07
|21
|3947
|31
AI Summary
Management System of COVI - This report is based on introducing a fully integrated customer management system to COVI as a system upgrade of the previous IT system. The project works are planned, controlled, and monitored by an assigned project manager and the project team. The plan is to complete the project in the shortest possible time period as the delay will cancel the existing contract with the client.
Contribute Materials
Your contribution can guide someone’s learning journey. Share your
documents today.
Project Analysis for Upgrade Customer Management System of COVI
1. Introduction
COVI is a medical equipment and maintenance service company for hospitals. Also, COVI
works as an authorized agent for providing flu vaccines to patients affected by pandemic
situations in the country.
This analysis discusses details related to the fully integrated customer management system to be
introduced as a system upgrade of the previous IT system. It solves the problem of engineers
could not identify the new machines of clients not covered with a warranty and losing revenue
from them. With this project, the company can easily identify the customer's new machines and
minimize the company's losses. Visiting engineer can easily determine if a product is covered by
the contract by scanning the bar code from his mobile device and verifying from a central
computer that the device belongs to the scope of service and warranty.
The report covers the areas of Project Structure, WBS, CPM Analysis, Gantt Chart, Stakeholder
Management Chart, Resource Chart, Cost Analysis, Project Order (Scope Summary), Risk
Assessment, Monitoring & Controls, Challenges, Change Management Approach,
Communication Matrix, Action Template and others Analyzes required for a project.
Secure Best Marks with AI Grader
Need help grading? Try our AI Grader for instant feedback on your assignments.
2. Project Charter for Customer Management System
2.1 Overview
Project is based on introducing fully integrated customer management system to COVI as a
system upgrade of the previous IT system. The project works are planned, controlled and
monitored by an assigned project manager and the project team. The plan is to complete the
project in the shortest possible time period as the delay will cancel the existing contract with the
client.
2.2 Reasons for The Project
The project is a design for the problem faced by the visiting engineers of COVI and to provide a
solution to it to eliminate the lost revenue and time.
2.1 Problem Identification
COVI is in the business of maintenance of its customers' medical devices. Customers first
provide the list of equipment (e.g. 5 mobile x-ray machines, 4 ultrasound machines, 3 MRI
scanners, etc.) and add it to the agreement with the scope details. However, the problem arises
because customers purchase new machines and do not inform COVI. Therefore, it was difficult
for the visiting engineer to identify the machines that cover the contract since the engineer does
not carry the contract on site. Because of this, given the urgency and customer relationship, the
engineer has to repair all the machines and the company's revenue and time are lost.
2.2 Solution Proposed
Conduct a full audit of all customer devices that appear on the contracts and label those with a
barcode. Introduce a new customer management system to identify those machines by scanning
the barcode with a mobile app. In addition, the engineer can use a central computer to check
whether the device is covered by the COVI service guarantee.
2.3 Objectives
1. Completely eliminate the company's loss of time and revenue due to machine repairs
not covered by the warranty.
2. Effectively manage customer relationships by avoiding disputes related to machine
repairs and providing effective service.
3. Increase company revenue by 15% by effectively managing engineer visiting time.
4. Complete the project in the shortest possible time
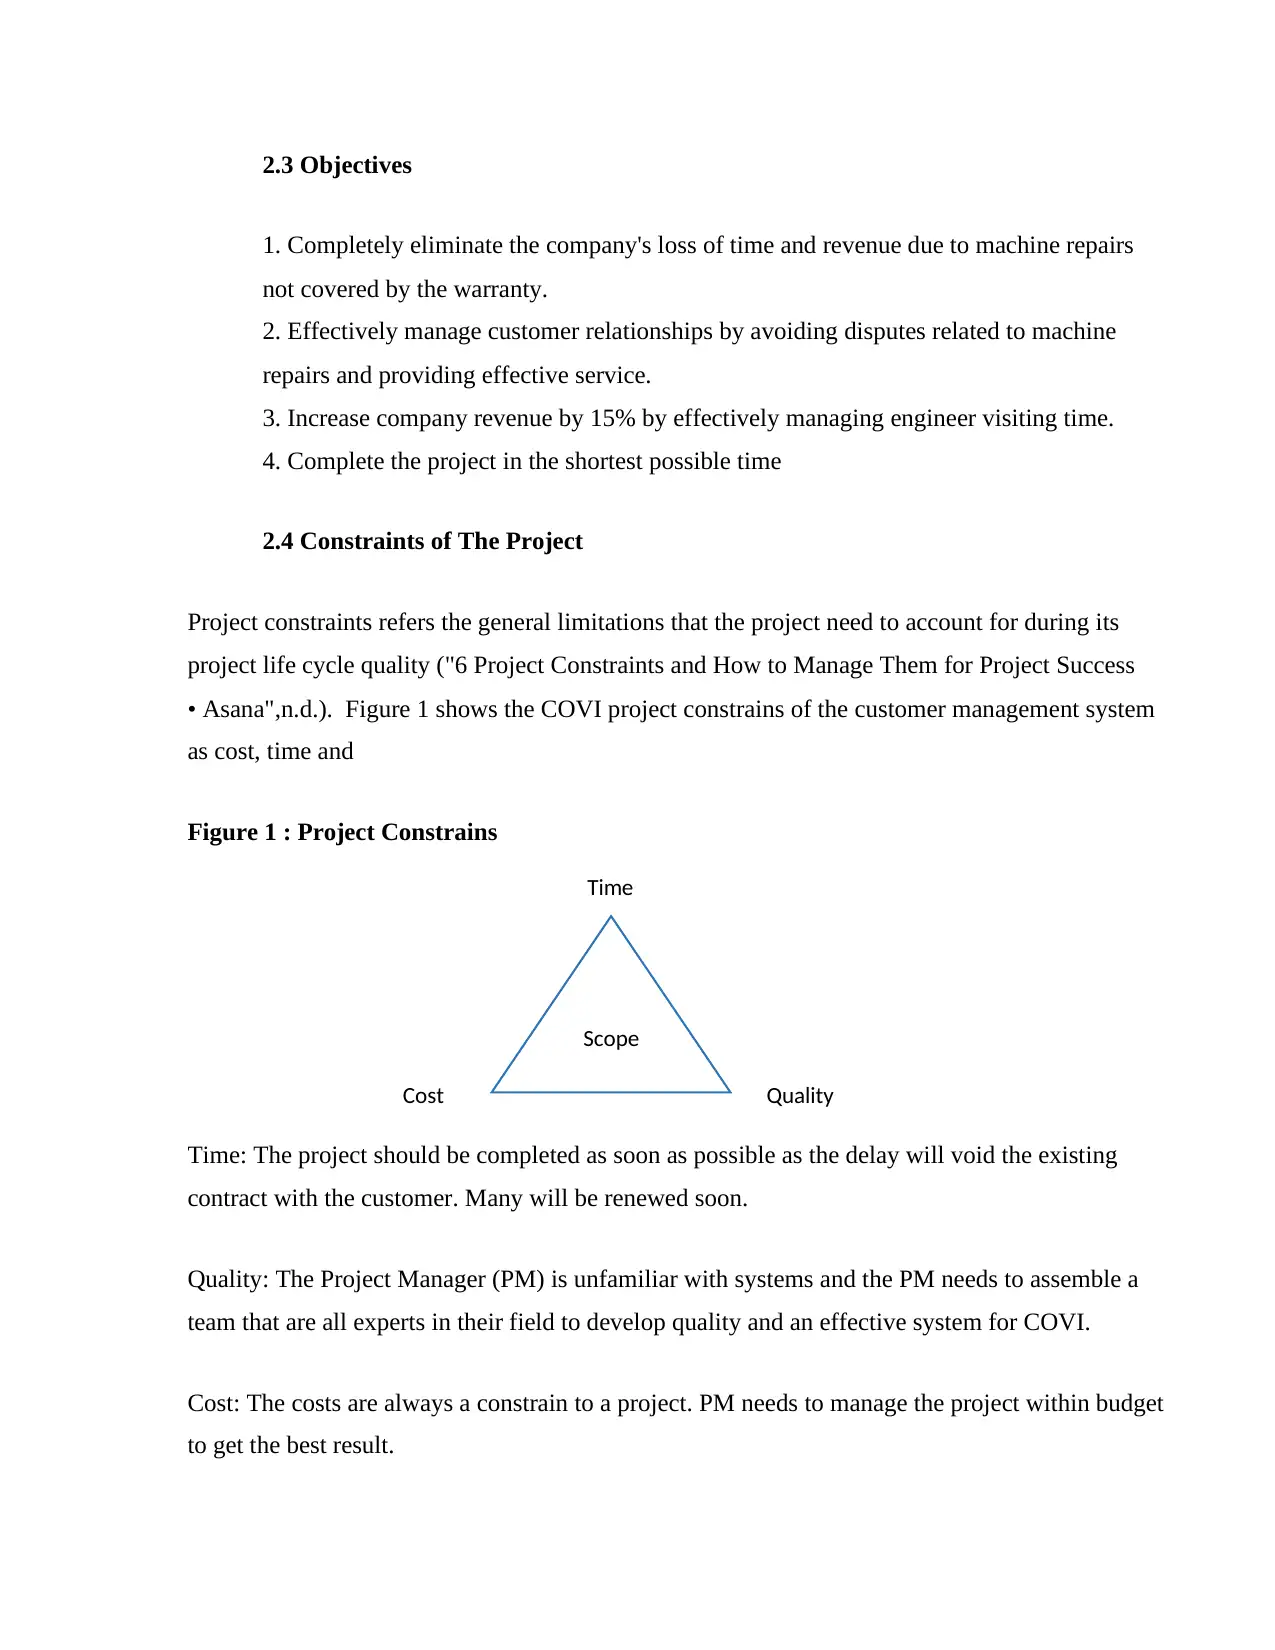
2.4 Constraints of The Project
Project constraints refers the general limitations that the project need to account for during its
project life cycle quality ("6 Project Constraints and How to Manage Them for Project Success
• Asana",n.d.). Figure 1 shows the COVI project constrains of the customer management system
as cost, time and
Figure 1 : Project Constrains
Time: The project should be completed as soon as possible as the delay will void the existing
contract with the customer. Many will be renewed soon.
Quality: The Project Manager (PM) is unfamiliar with systems and the PM needs to assemble a
team that are all experts in their field to develop quality and an effective system for COVI.
Cost: The costs are always a constrain to a project. PM needs to manage the project within budget
to get the best result.
Scope
Time
QualityCost
1. Completely eliminate the company's loss of time and revenue due to machine repairs
not covered by the warranty.
2. Effectively manage customer relationships by avoiding disputes related to machine
repairs and providing effective service.
3. Increase company revenue by 15% by effectively managing engineer visiting time.
4. Complete the project in the shortest possible time
2.4 Constraints of The Project
Project constraints refers the general limitations that the project need to account for during its
project life cycle quality ("6 Project Constraints and How to Manage Them for Project Success
• Asana",n.d.). Figure 1 shows the COVI project constrains of the customer management system
as cost, time and
Figure 1 : Project Constrains
Time: The project should be completed as soon as possible as the delay will void the existing
contract with the customer. Many will be renewed soon.
Quality: The Project Manager (PM) is unfamiliar with systems and the PM needs to assemble a
team that are all experts in their field to develop quality and an effective system for COVI.
Cost: The costs are always a constrain to a project. PM needs to manage the project within budget
to get the best result.
Scope
Time
QualityCost
2.5 Main Stakeholders
The main stakeholders of the project are COVI shareholders, company employees , project team
, customers , software developers and suppliers.
2.6 Risks Identified
Mainly identified risks of COVI project are supply delay, not complete project on time, High
costs, employees not familiar to the system.
2.7 Benefits of The Project
Avoid loss of revenue and time by avoiding out-of-warranty machine servicing, and increase
revenue by effectively managing resources.
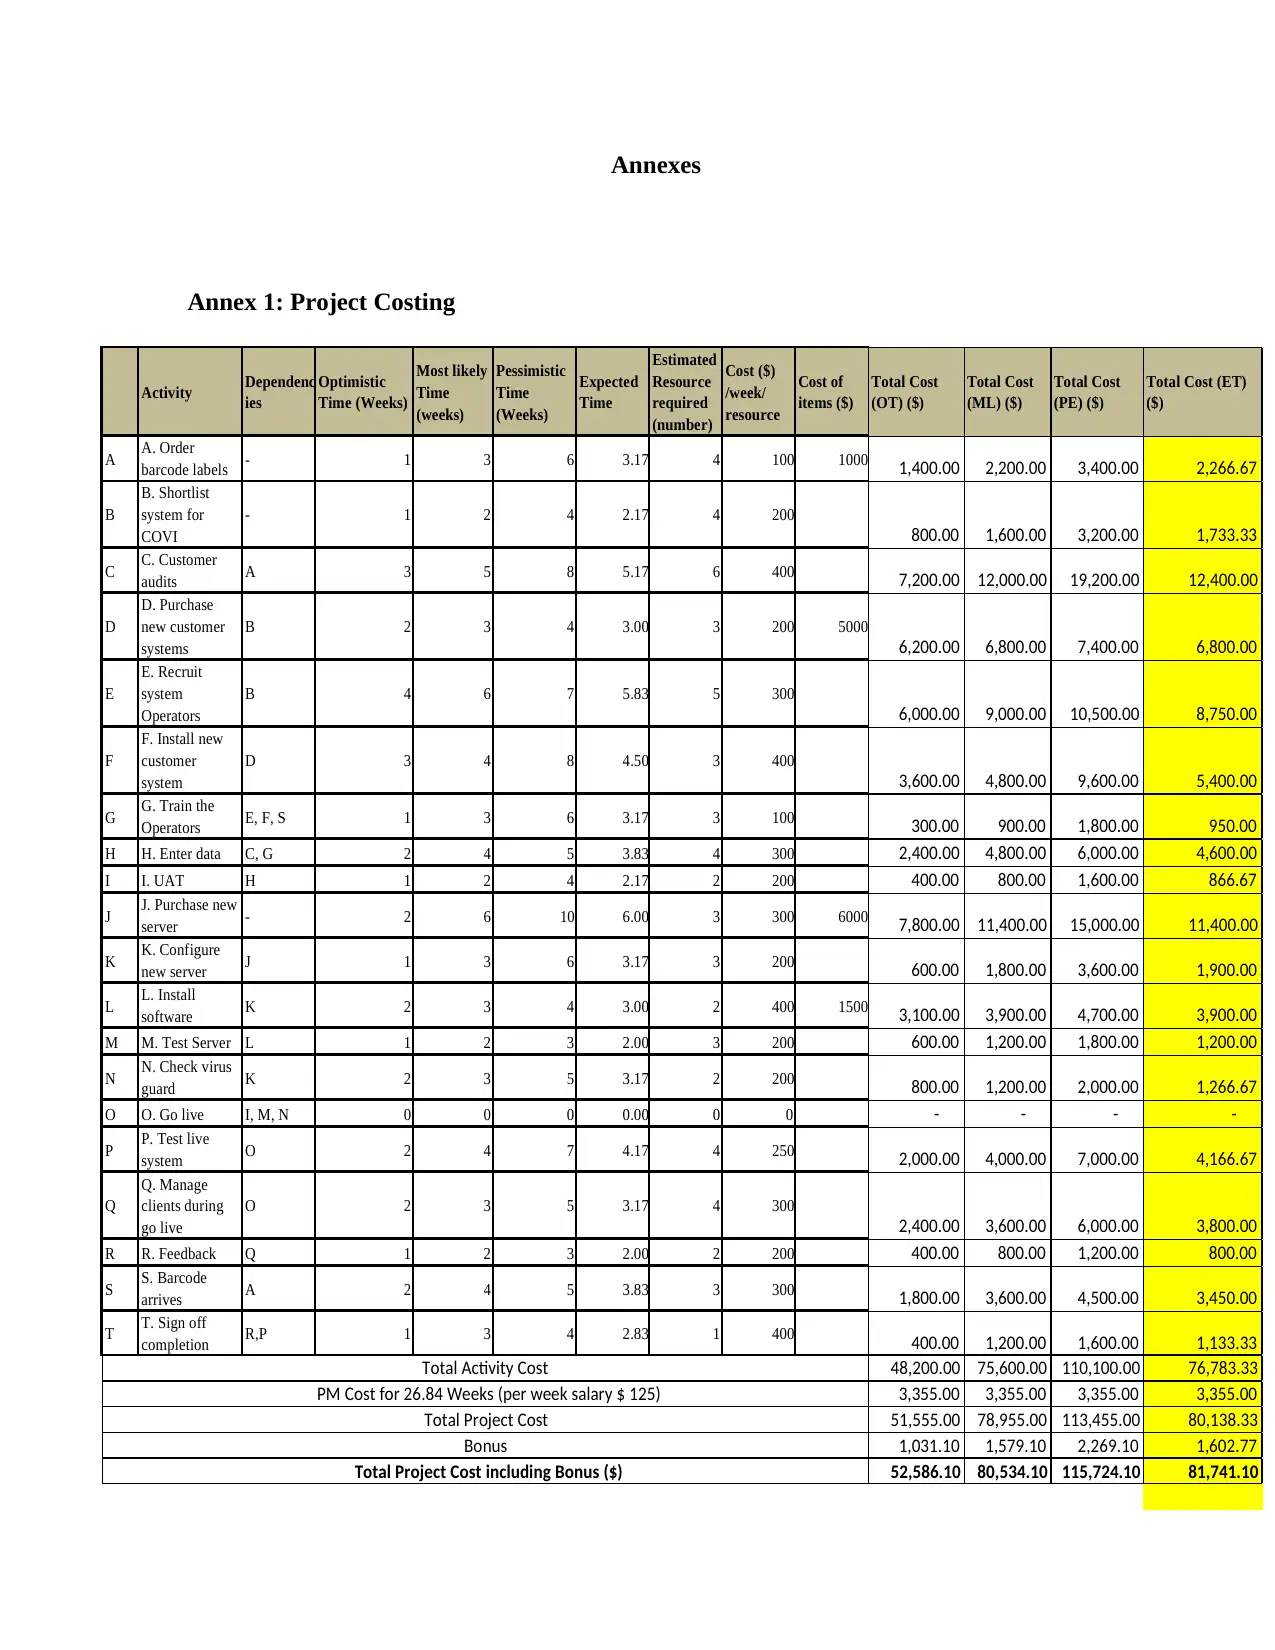
2.8 General Overview of The Budget
The budget of the project as per Annexure 1 is US$81,741.10 considering the effective
management of the project's time and cost.
2.9 Time & Scope
As per the Annexure 2 the project completion time is 26.84 weeks and encompasses the scope
from finding a supplier for the system to the point of system implementation and the sign of
completion of the project.
1. Project Assumptions
1. All project team have same capability of working
2. All employees are full time workers
3. 4-week months considered
4. 8 hrs. working time considered for a day and considered week start from Sunday
The main stakeholders of the project are COVI shareholders, company employees , project team
, customers , software developers and suppliers.
2.6 Risks Identified
Mainly identified risks of COVI project are supply delay, not complete project on time, High
costs, employees not familiar to the system.
2.7 Benefits of The Project
Avoid loss of revenue and time by avoiding out-of-warranty machine servicing, and increase
revenue by effectively managing resources.
2.8 General Overview of The Budget
The budget of the project as per Annexure 1 is US$81,741.10 considering the effective
management of the project's time and cost.
2.9 Time & Scope
As per the Annexure 2 the project completion time is 26.84 weeks and encompasses the scope
from finding a supplier for the system to the point of system implementation and the sign of
completion of the project.
1. Project Assumptions
1. All project team have same capability of working
2. All employees are full time workers
3. 4-week months considered
4. 8 hrs. working time considered for a day and considered week start from Sunday
Secure Best Marks with AI Grader
Need help grading? Try our AI Grader for instant feedback on your assignments.
5. Project start date considered as March 1st of 2022
6. Given resources are considered as people
2. Work Breakdown Structure (WBS)
Work Breakdown Structure (WBS) is the tool that is one of the most important projects
management documents. It single-handedly integrates scope, cost, and schedule baselines,
ensuring project plans are aligned ("Work Breakdown Structure", n.d.).
Taking into account the scope of the project and the tasks to be completed, the WBS can be
proposed as Appendix 4.
Project handling by newly assigned PM and his project teams.
Stage 1 – Upgrade of COVI's customer management system
Level 2 – Activities have been identified as functional divisions of Engineering,
Procurement, Human Resource Management (HR), Sales and Information Technology (IT).
Heavy weight of engineering and IT departments.
Level 3 - All project tasks are assigned to the above 5 departments according to Appendix 4.
3. Project Structure
Functional project structure developed according to Annex 5 for the project considering the
project scope, time and cost. The structure is led by the Director of Supply and Maintenance
and the Heads of Engineering, Procurement, Human Resource Management (HR), Sales and
Information Technology (IT) report directly to the Director. Under the Department Heads,
other department subordinates work and report to the department head. The project manager
reports directly to the director and has no direct reports to him, and executes the project using
shared resources from other functional departments.
When planning the project structure, the following areas are considered,
1. The project is a one-off work and upon completion, the project team must disband as the
works are completed.
2. Hiring a project team for just one project involves high cost for the project, and functional
structure is the solution to have low overhead.
3. The urgency of completing the project as any delay will cancel the existing contract with
the client and many will soon need to be renewed. So no time for urgent hiring of skilled
workers
4. The project manager is less technically savvy and can obtain knowledge from experts on the
processes and requirements from existing functional departments.
5. The project is completed in 6 months and the functional structure is suitable for this type of
project.
However, the functional structure can cause project delays as there is no dedicated team for
the project and they have no control over the project manager. Also, decisions can be delayed
because the project manager has less authority.
4. Critical Path Method Analysis
In project management, the critical path is the longest sequence of tasks that must be completed
to complete a project. Critical road tasks are called critical activities because if they are
delayed, the completion of the entire project will be delayed ("What Is the Critical Path of a
Project?", 2016). If the project is delayed, over budget, or fails to meet key stakeholder needs,
the project will not reach its goal and it will be a problem for the organization (Maylor, 2005).
This critical path serves to identify the key areas of the project early on and helps to effectively
manage the project management process.
According to Appendix 3, the critical path of the project is B, D, F, G, H, I, O, Q, R, T, with
the forward and backward past being equal. If any activity on this critical path is delayed, the
overall project will be delayed. Since the project is very keen to complete it in the shortest
possible time, this will be of great importance to the project team.
Example: With a delay of activity A with 3 weeks, the entire project is delayed by 0.33 weeks.
Therefore, the project team should be alert about these activities.
7. Gantt Chart
Although the Gantt chart is a fairly old method, it can still be considered almost the world
standard project management tool. It helps project managers create and schedule various tasks
and control tasks over time. The tool simply provides the ability to visualize various tasks,
dependencies, time constraints and other project management related specifications. so project
managers can track and complete intended work when scheduled. In short, the tool gives
project managers the ability to define problems, control them, and accept other solutions if
necessary (Hekim, 2018).
With reference to the annexure 2 Gannt chart has developed for the activities identify related
to COVI customer relationship management project. All activities identified from A- Oder
Barcode Label to T – Signoff completion. As per the analysis 28.6 weeks required for project
completion.
As shown in figure 1 and figure 2 Whether the Most Likely is more appropriate to reduce the
project time, but it is riskier than the expected time. Also, the time difference between the
expected date and the Most Likely is only 0.84 weeks. Also, the cost difference is about $1207,
which is only about 1.4 percent of the total project cost as a percentage. Therefore, it has been
chosen the expected time for the analysis because it reduces risk and doesn't have a large impact
on time and cost.
Paraphrase This Document
Need a fresh take? Get an instant paraphrase of this document with our AI Paraphraser
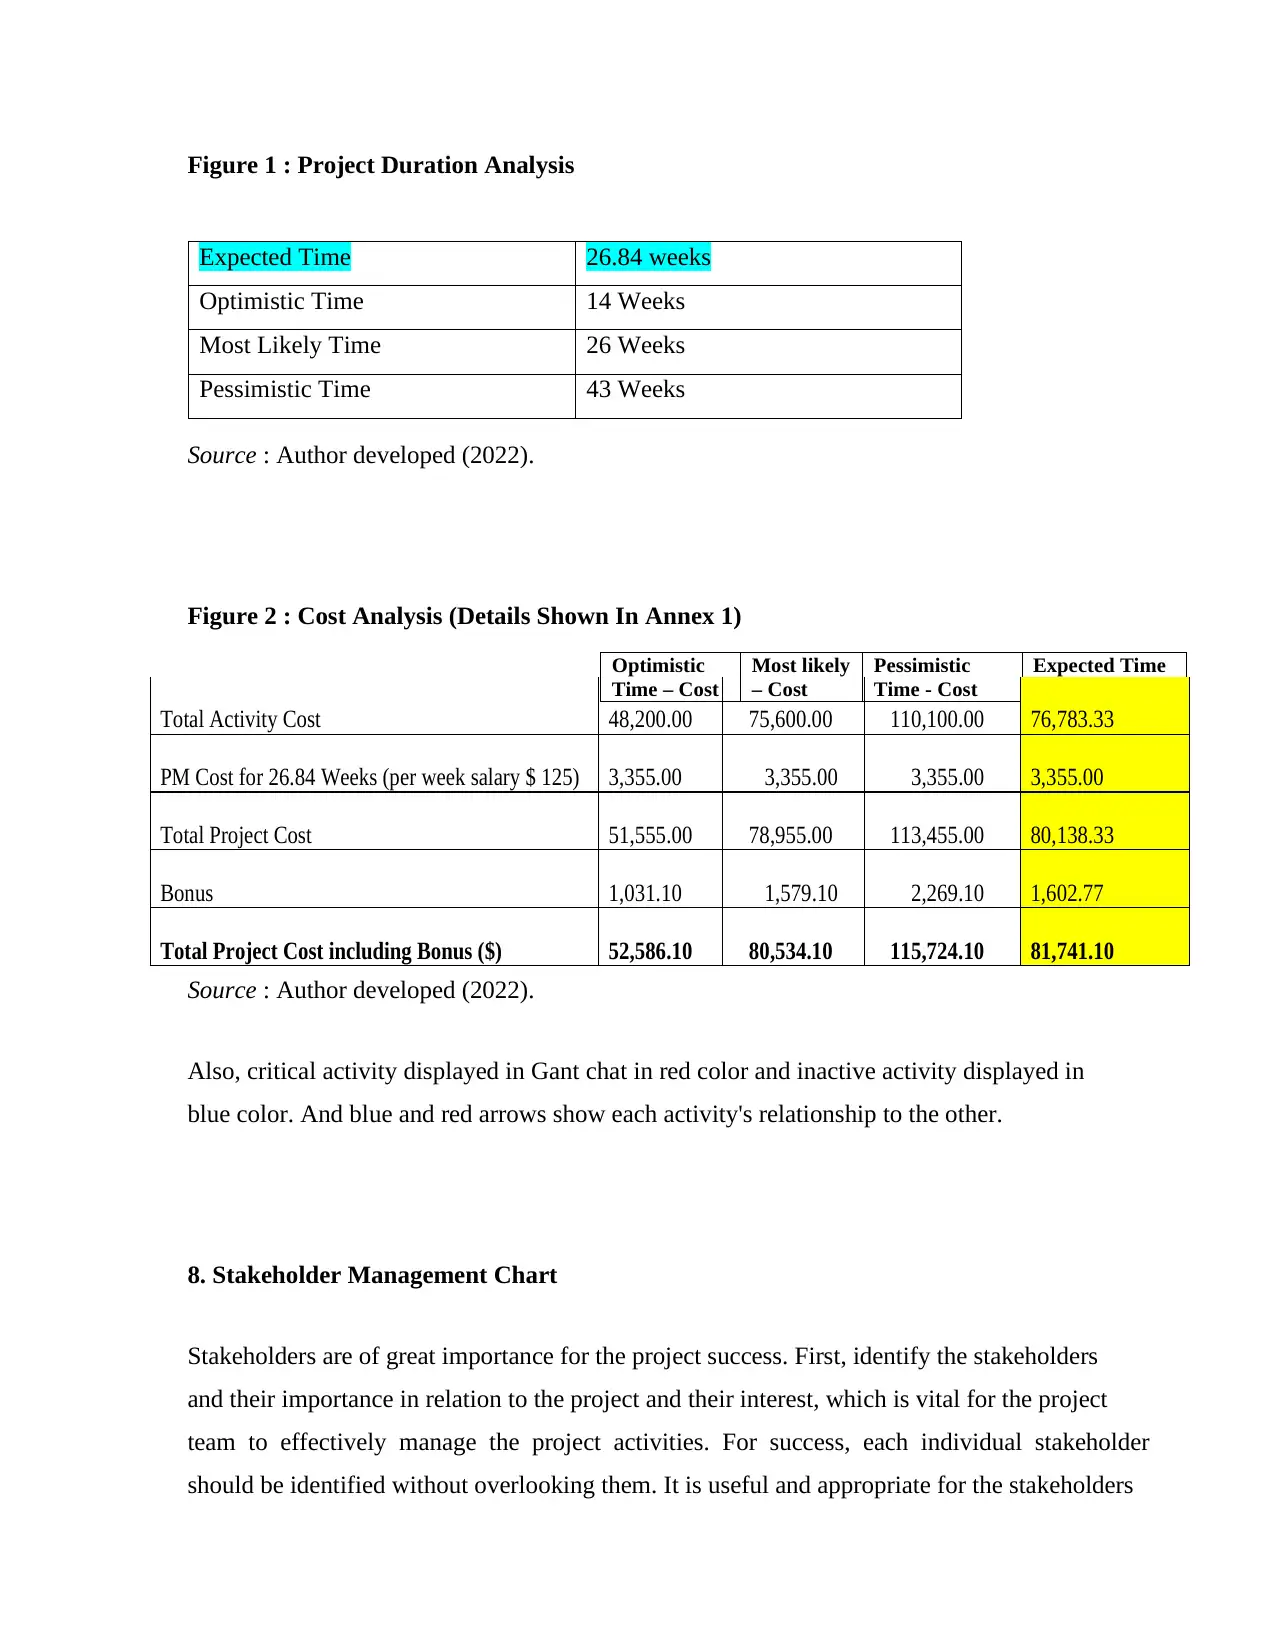
Figure 1 : Project Duration Analysis
Source : Author developed (2022).
Figure 2 : Cost Analysis (Details Shown In Annex 1)
Source : Author developed (2022).
Also, critical activity displayed in Gant chat in red color and inactive activity displayed in
blue color. And blue and red arrows show each activity's relationship to the other.
8. Stakeholder Management Chart
Stakeholders are of great importance for the project success. First, identify the stakeholders
and their importance in relation to the project and their interest, which is vital for the project
team to effectively manage the project activities. For success, each individual stakeholder
should be identified without overlooking them. It is useful and appropriate for the stakeholders
Expected Time 26.84 weeks
Optimistic Time 14 Weeks
Most Likely Time 26 Weeks
Pessimistic Time 43 Weeks
Optimistic
Time – Cost
Most likely
– Cost
Pessimistic
Time - Cost
Expected Time
- Cost
Total Activity Cost 48,200.00 75,600.00 110,100.00 76,783.33
PM Cost for 26.84 Weeks (per week salary $ 125) 3,355.00 3,355.00 3,355.00 3,355.00
Total Project Cost 51,555.00 78,955.00 113,455.00 80,138.33
Bonus 1,031.10 1,579.10 2,269.10 1,602.77
Total Project Cost including Bonus ($) 52,586.10 80,534.10 115,724.10 81,741.10
Source : Author developed (2022).
Figure 2 : Cost Analysis (Details Shown In Annex 1)
Source : Author developed (2022).
Also, critical activity displayed in Gant chat in red color and inactive activity displayed in
blue color. And blue and red arrows show each activity's relationship to the other.
8. Stakeholder Management Chart
Stakeholders are of great importance for the project success. First, identify the stakeholders
and their importance in relation to the project and their interest, which is vital for the project
team to effectively manage the project activities. For success, each individual stakeholder
should be identified without overlooking them. It is useful and appropriate for the stakeholders
Expected Time 26.84 weeks
Optimistic Time 14 Weeks
Most Likely Time 26 Weeks
Pessimistic Time 43 Weeks
Optimistic
Time – Cost
Most likely
– Cost
Pessimistic
Time - Cost
Expected Time
- Cost
Total Activity Cost 48,200.00 75,600.00 110,100.00 76,783.33
PM Cost for 26.84 Weeks (per week salary $ 125) 3,355.00 3,355.00 3,355.00 3,355.00
Total Project Cost 51,555.00 78,955.00 113,455.00 80,138.33
Bonus 1,031.10 1,579.10 2,269.10 1,602.77
Total Project Cost including Bonus ($) 52,586.10 80,534.10 115,724.10 81,741.10
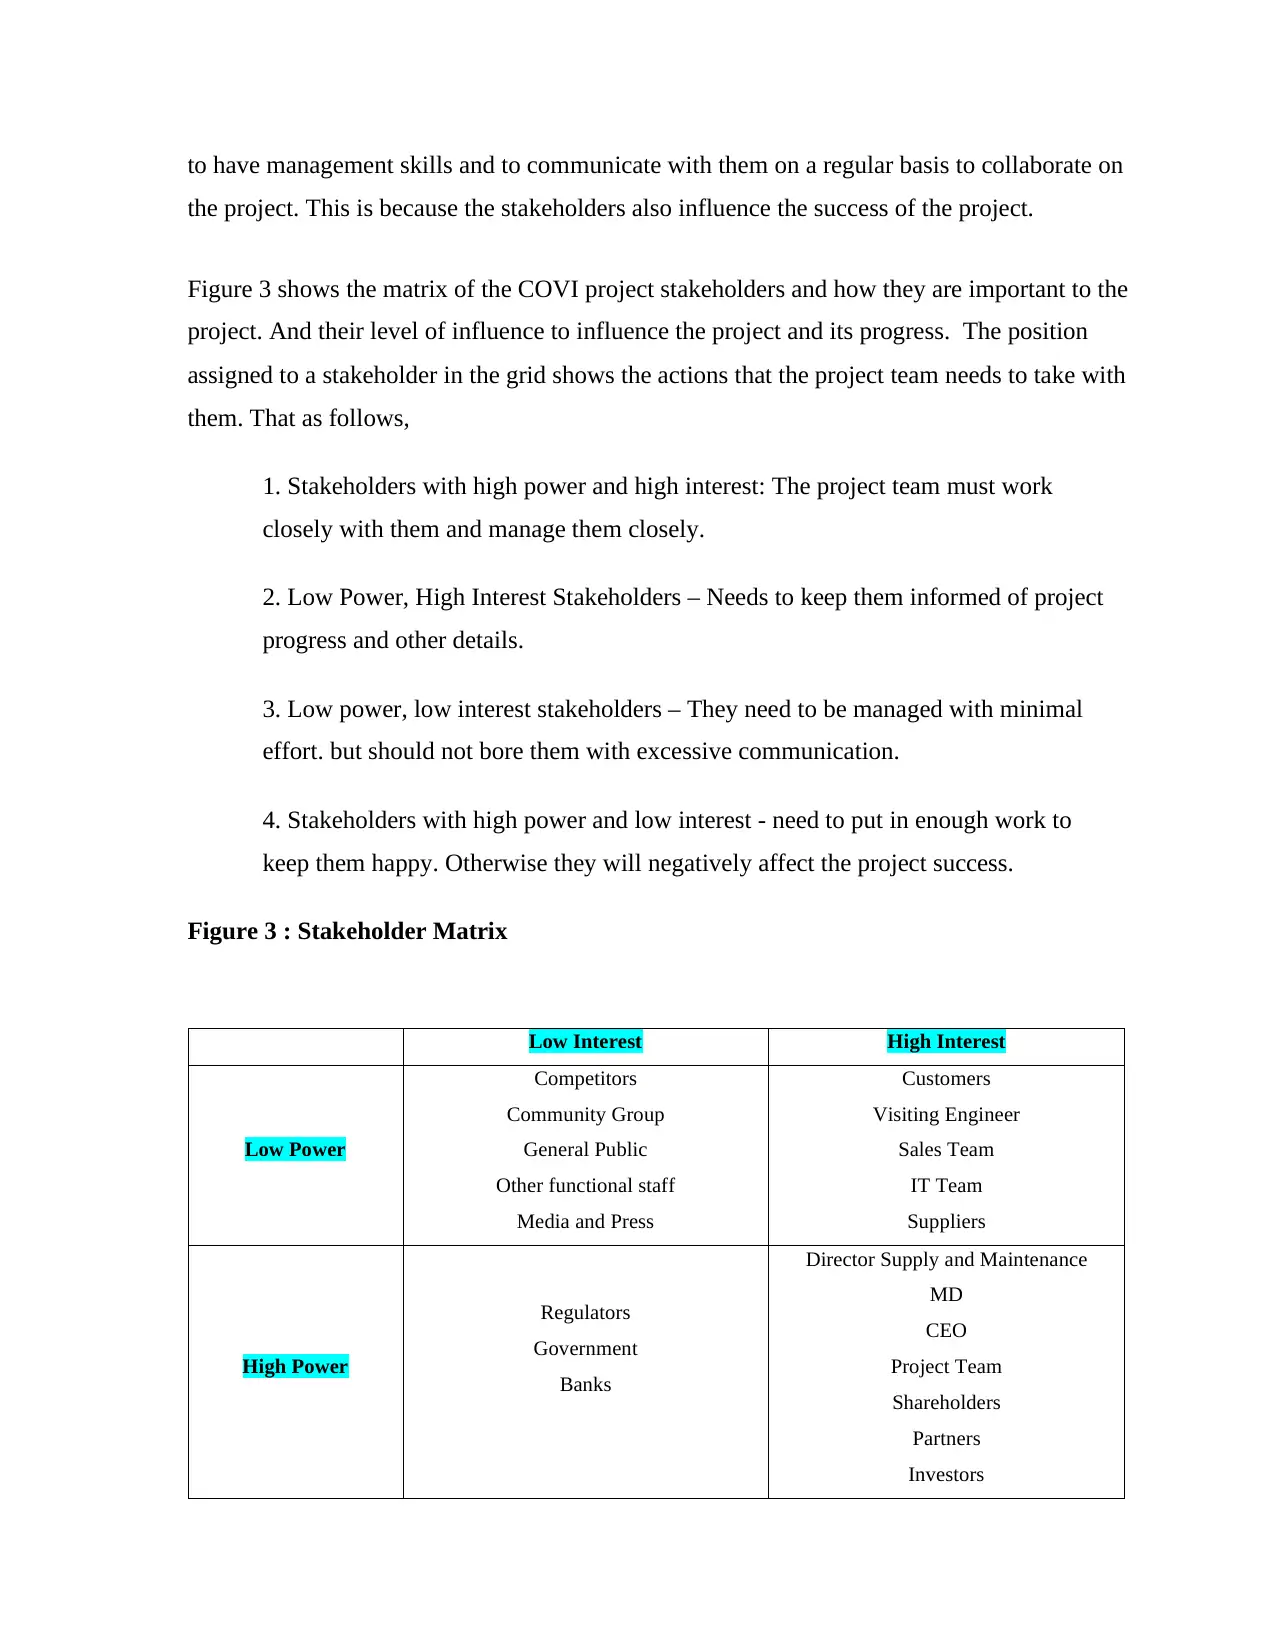
to have management skills and to communicate with them on a regular basis to collaborate on
the project. This is because the stakeholders also influence the success of the project.
Figure 3 shows the matrix of the COVI project stakeholders and how they are important to the
project. And their level of influence to influence the project and its progress. The position
assigned to a stakeholder in the grid shows the actions that the project team needs to take with
them. That as follows,
1. Stakeholders with high power and high interest: The project team must work
closely with them and manage them closely.
2. Low Power, High Interest Stakeholders – Needs to keep them informed of project
progress and other details.
3. Low power, low interest stakeholders – They need to be managed with minimal
effort. but should not bore them with excessive communication.
4. Stakeholders with high power and low interest - need to put in enough work to
keep them happy. Otherwise they will negatively affect the project success.
Figure 3 : Stakeholder Matrix
Low Interest High Interest
Low Power
Competitors
Community Group
General Public
Other functional staff
Media and Press
Customers
Visiting Engineer
Sales Team
IT Team
Suppliers
High Power
Regulators
Government
Banks
Director Supply and Maintenance
MD
CEO
Project Team
Shareholders
Partners
Investors
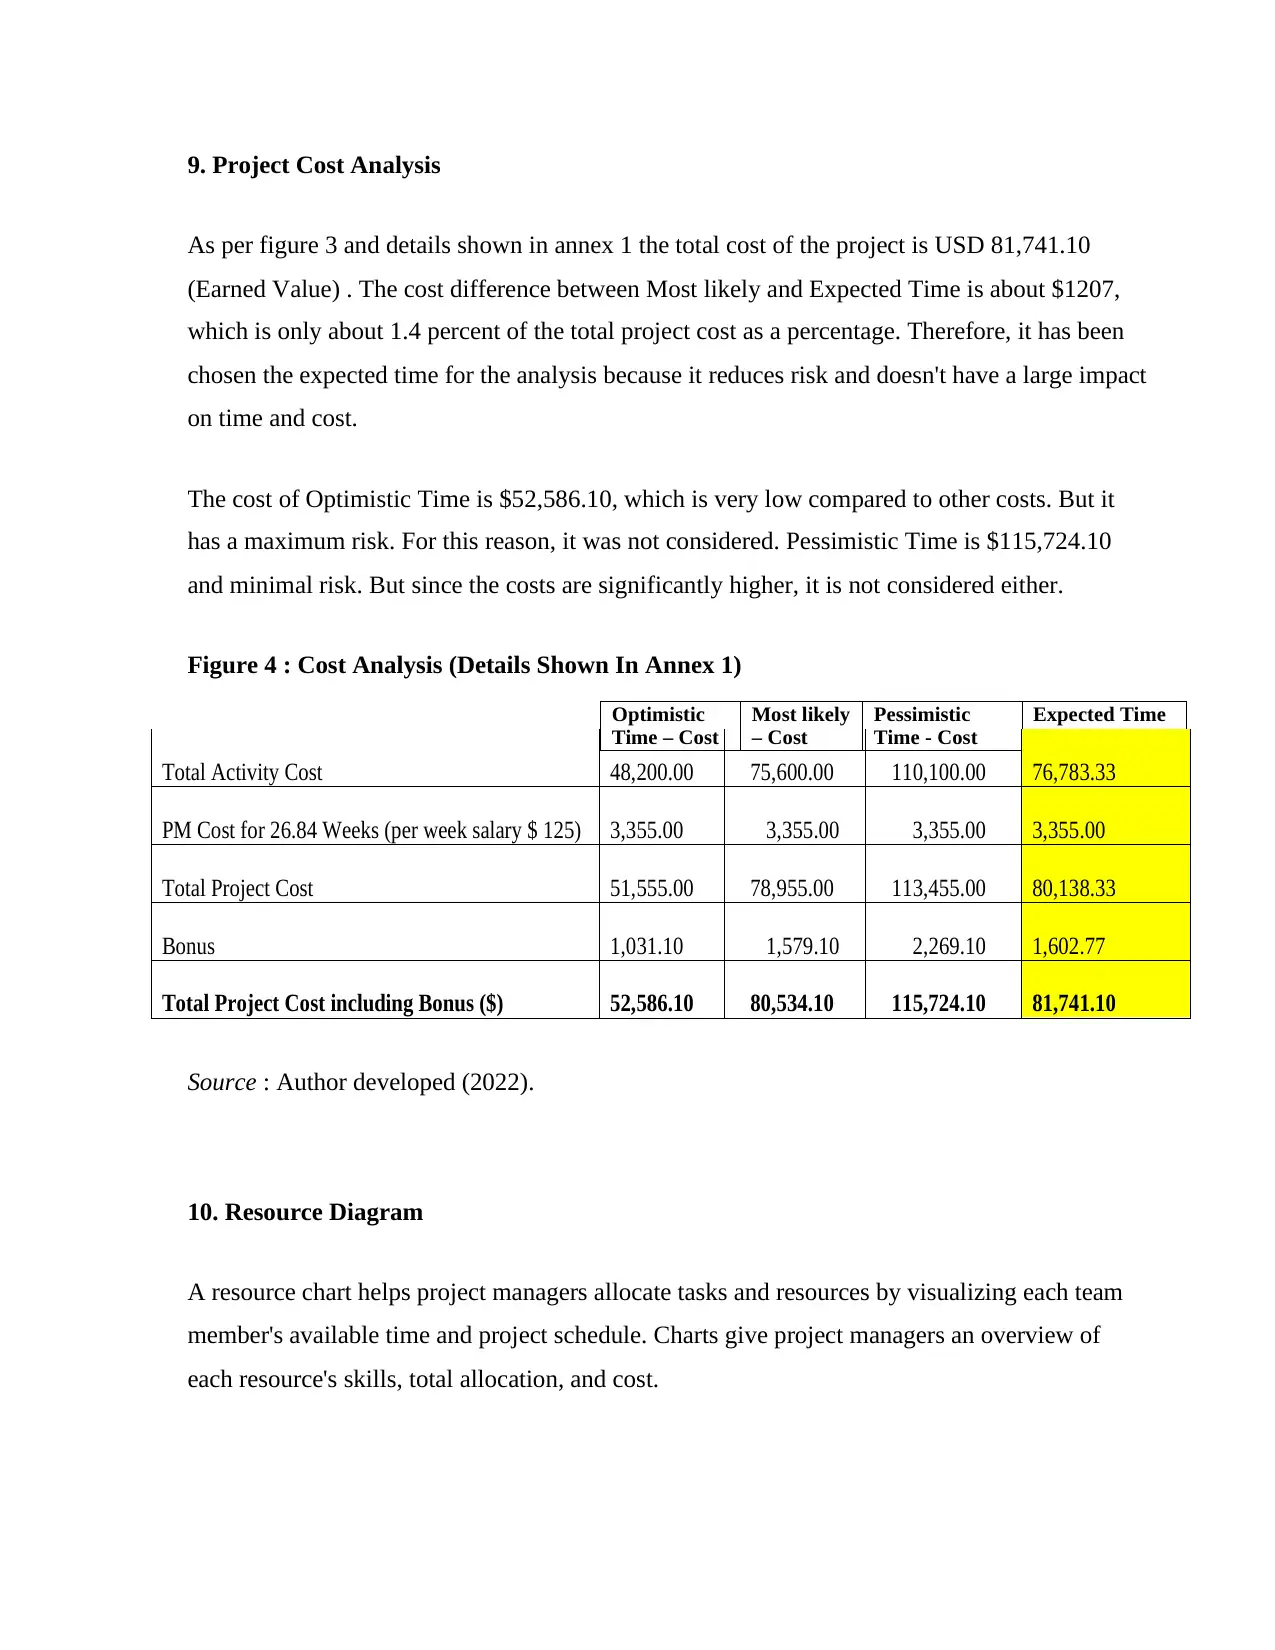
9. Project Cost Analysis
As per figure 3 and details shown in annex 1 the total cost of the project is USD 81,741.10
(Earned Value) . The cost difference between Most likely and Expected Time is about $1207,
which is only about 1.4 percent of the total project cost as a percentage. Therefore, it has been
chosen the expected time for the analysis because it reduces risk and doesn't have a large impact
on time and cost.
The cost of Optimistic Time is $52,586.10, which is very low compared to other costs. But it
has a maximum risk. For this reason, it was not considered. Pessimistic Time is $115,724.10
and minimal risk. But since the costs are significantly higher, it is not considered either.
Figure 4 : Cost Analysis (Details Shown In Annex 1)
Source : Author developed (2022).
10. Resource Diagram
A resource chart helps project managers allocate tasks and resources by visualizing each team
member's available time and project schedule. Charts give project managers an overview of
each resource's skills, total allocation, and cost.
Optimistic
Time – Cost
Most likely
– Cost
Pessimistic
Time - Cost
Expected Time
- Cost
Total Activity Cost 48,200.00 75,600.00 110,100.00 76,783.33
PM Cost for 26.84 Weeks (per week salary $ 125) 3,355.00 3,355.00 3,355.00 3,355.00
Total Project Cost 51,555.00 78,955.00 113,455.00 80,138.33
Bonus 1,031.10 1,579.10 2,269.10 1,602.77
Total Project Cost including Bonus ($) 52,586.10 80,534.10 115,724.10 81,741.10
Secure Best Marks with AI Grader
Need help grading? Try our AI Grader for instant feedback on your assignments.
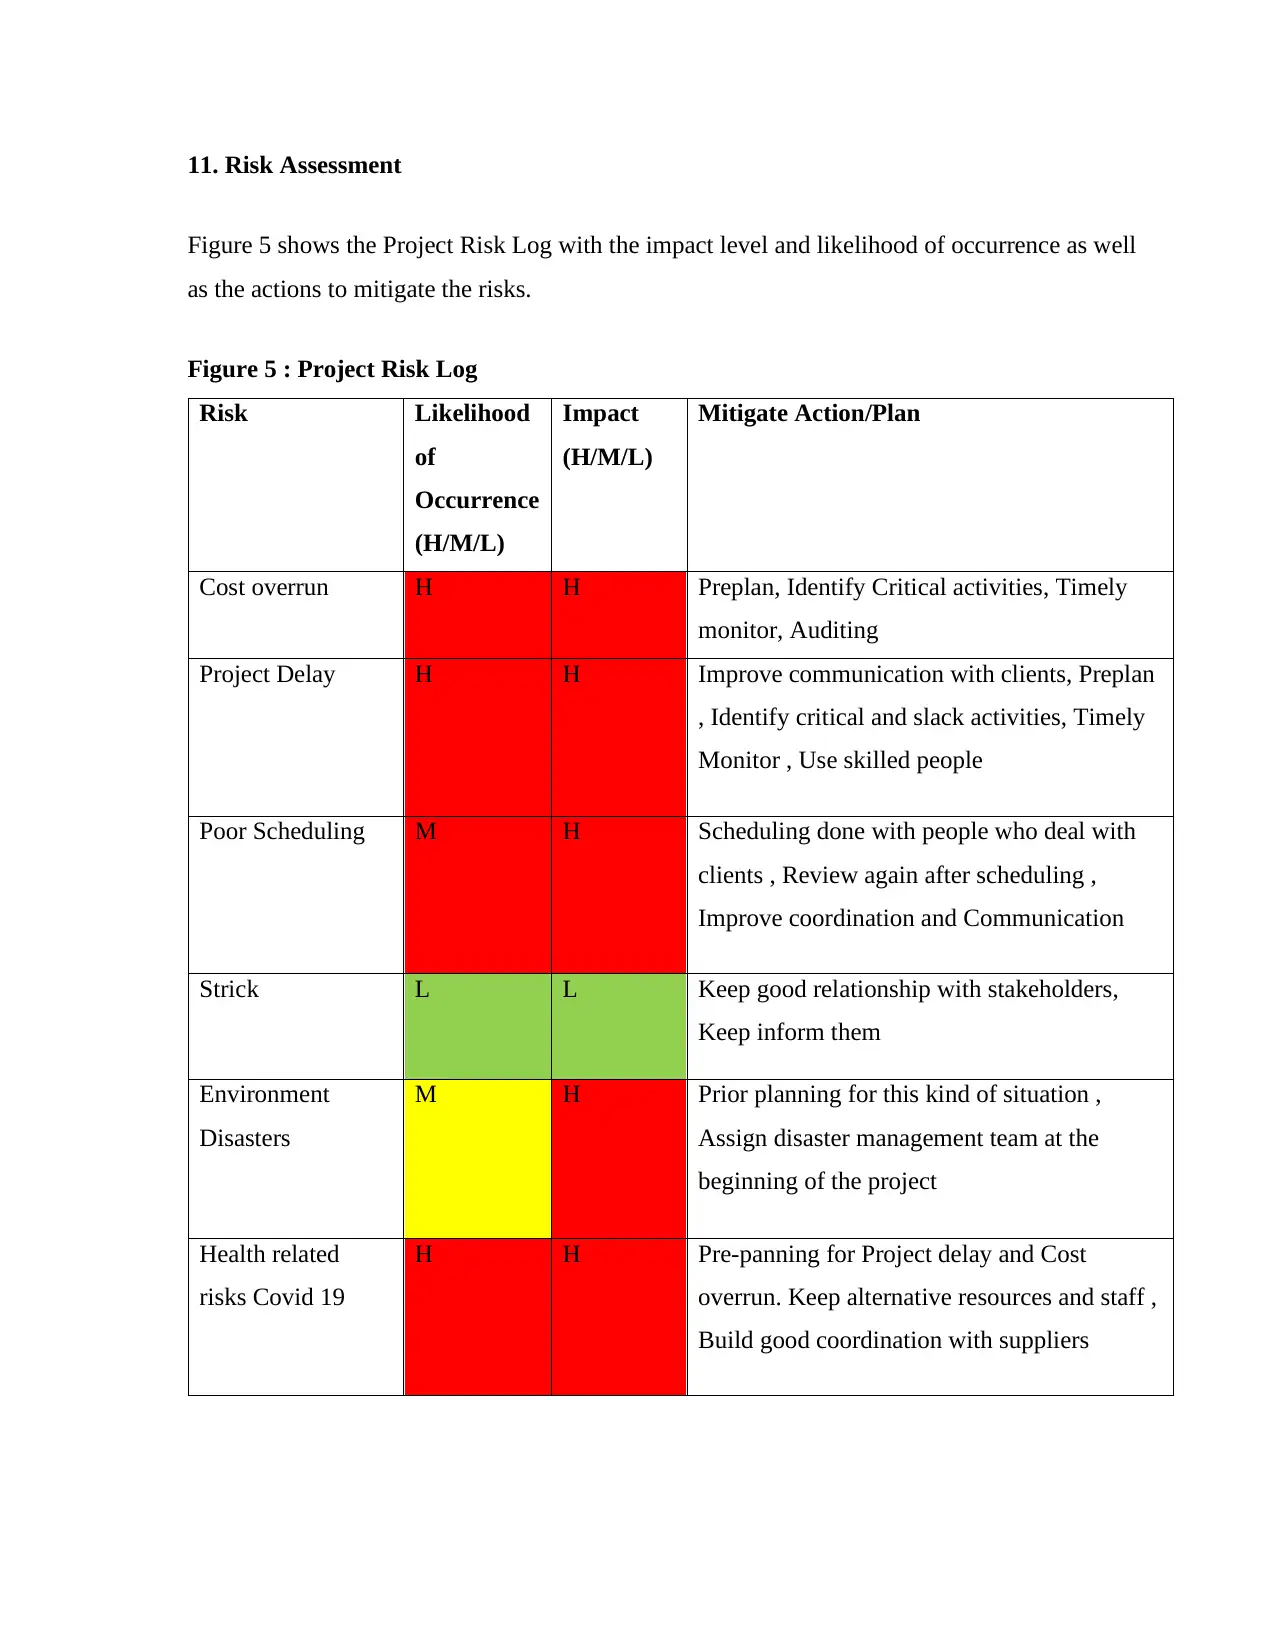
11. Risk Assessment
Figure 5 shows the Project Risk Log with the impact level and likelihood of occurrence as well
as the actions to mitigate the risks.
Figure 5 : Project Risk Log
Risk Likelihood
of
Occurrence
(H/M/L)
Impact
(H/M/L)
Mitigate Action/Plan
Cost overrun H H Preplan, Identify Critical activities, Timely
monitor, Auditing
Project Delay H H Improve communication with clients, Preplan
, Identify critical and slack activities, Timely
Monitor , Use skilled people
Poor Scheduling M H Scheduling done with people who deal with
clients , Review again after scheduling ,
Improve coordination and Communication
Strick L L Keep good relationship with stakeholders,
Keep inform them
Environment
Disasters
M H Prior planning for this kind of situation ,
Assign disaster management team at the
beginning of the project
Health related
risks Covid 19
H H Pre-panning for Project delay and Cost
overrun. Keep alternative resources and staff ,
Build good coordination with suppliers
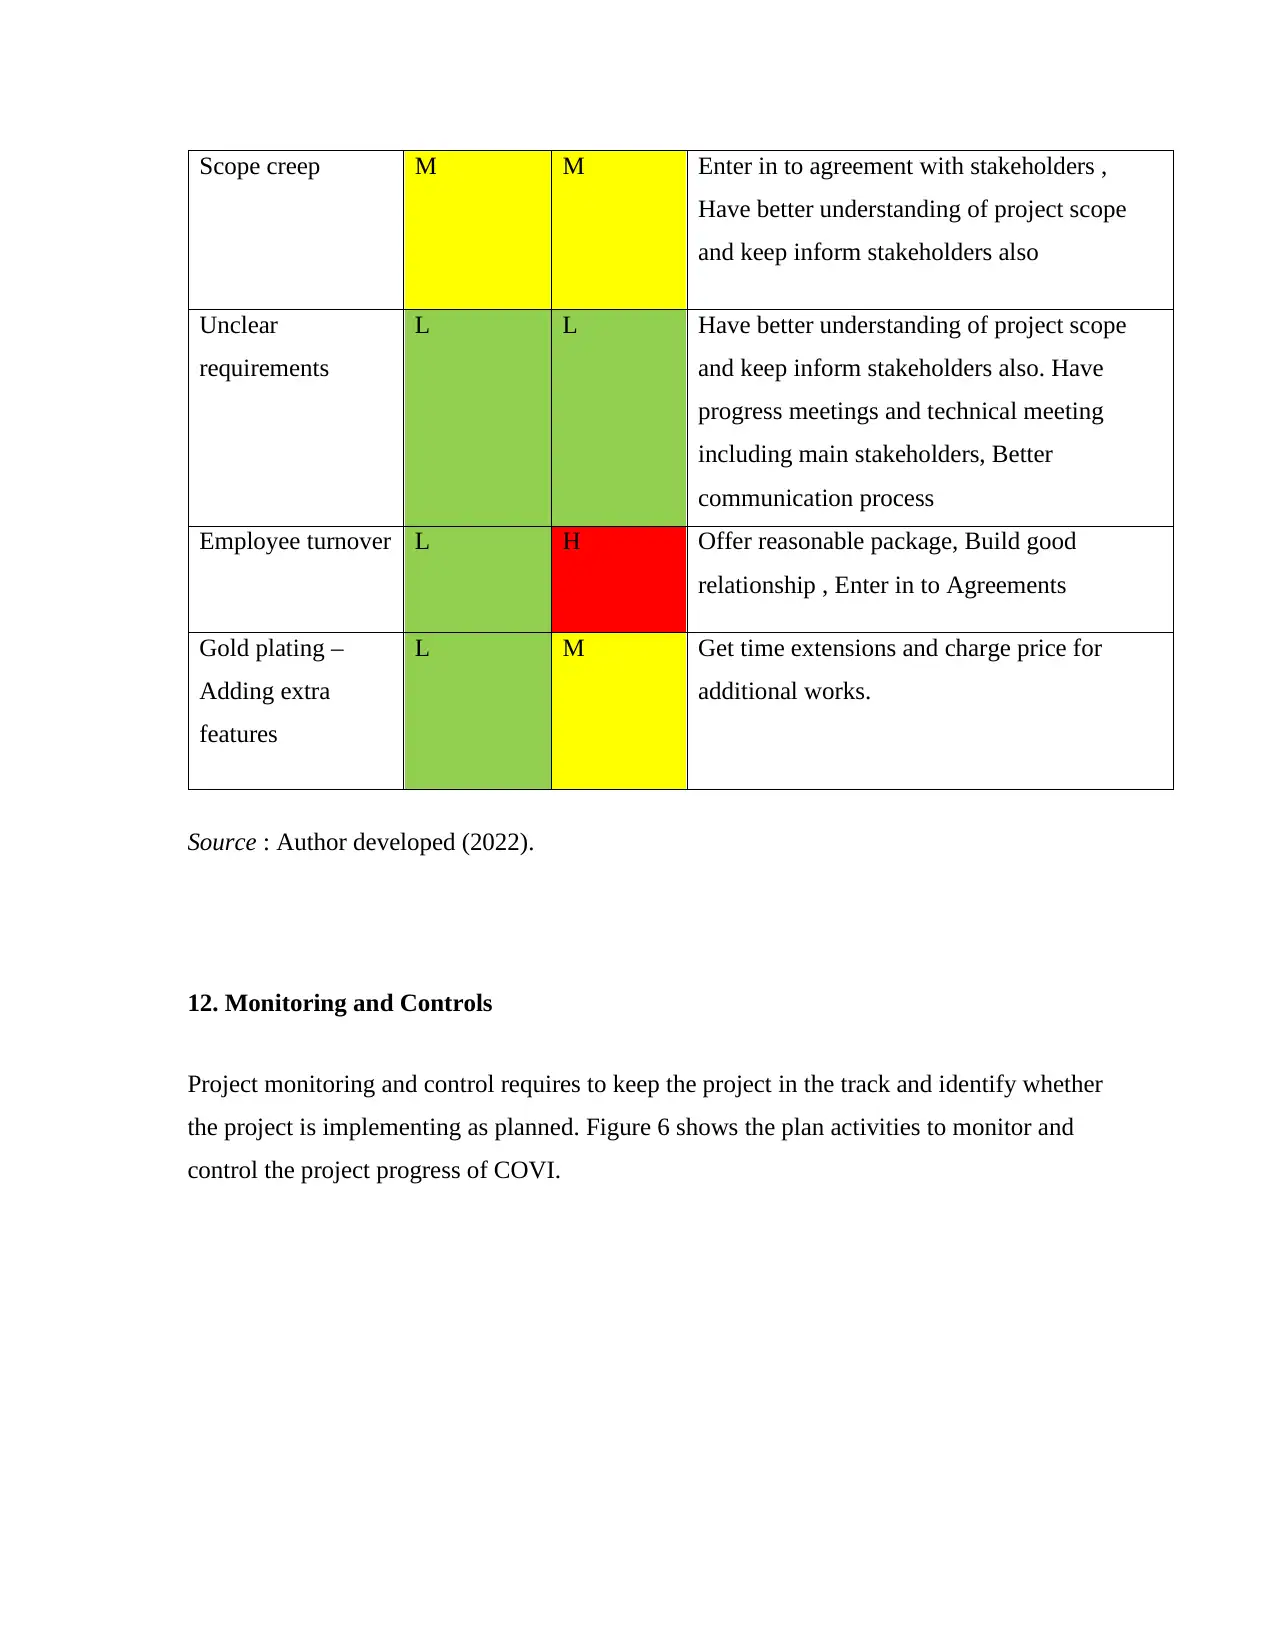
Scope creep M M Enter in to agreement with stakeholders ,
Have better understanding of project scope
and keep inform stakeholders also
Unclear
requirements
L L Have better understanding of project scope
and keep inform stakeholders also. Have
progress meetings and technical meeting
including main stakeholders, Better
communication process
Employee turnover L H Offer reasonable package, Build good
relationship , Enter in to Agreements
Gold plating –
Adding extra
features
L M Get time extensions and charge price for
additional works.
Source : Author developed (2022).
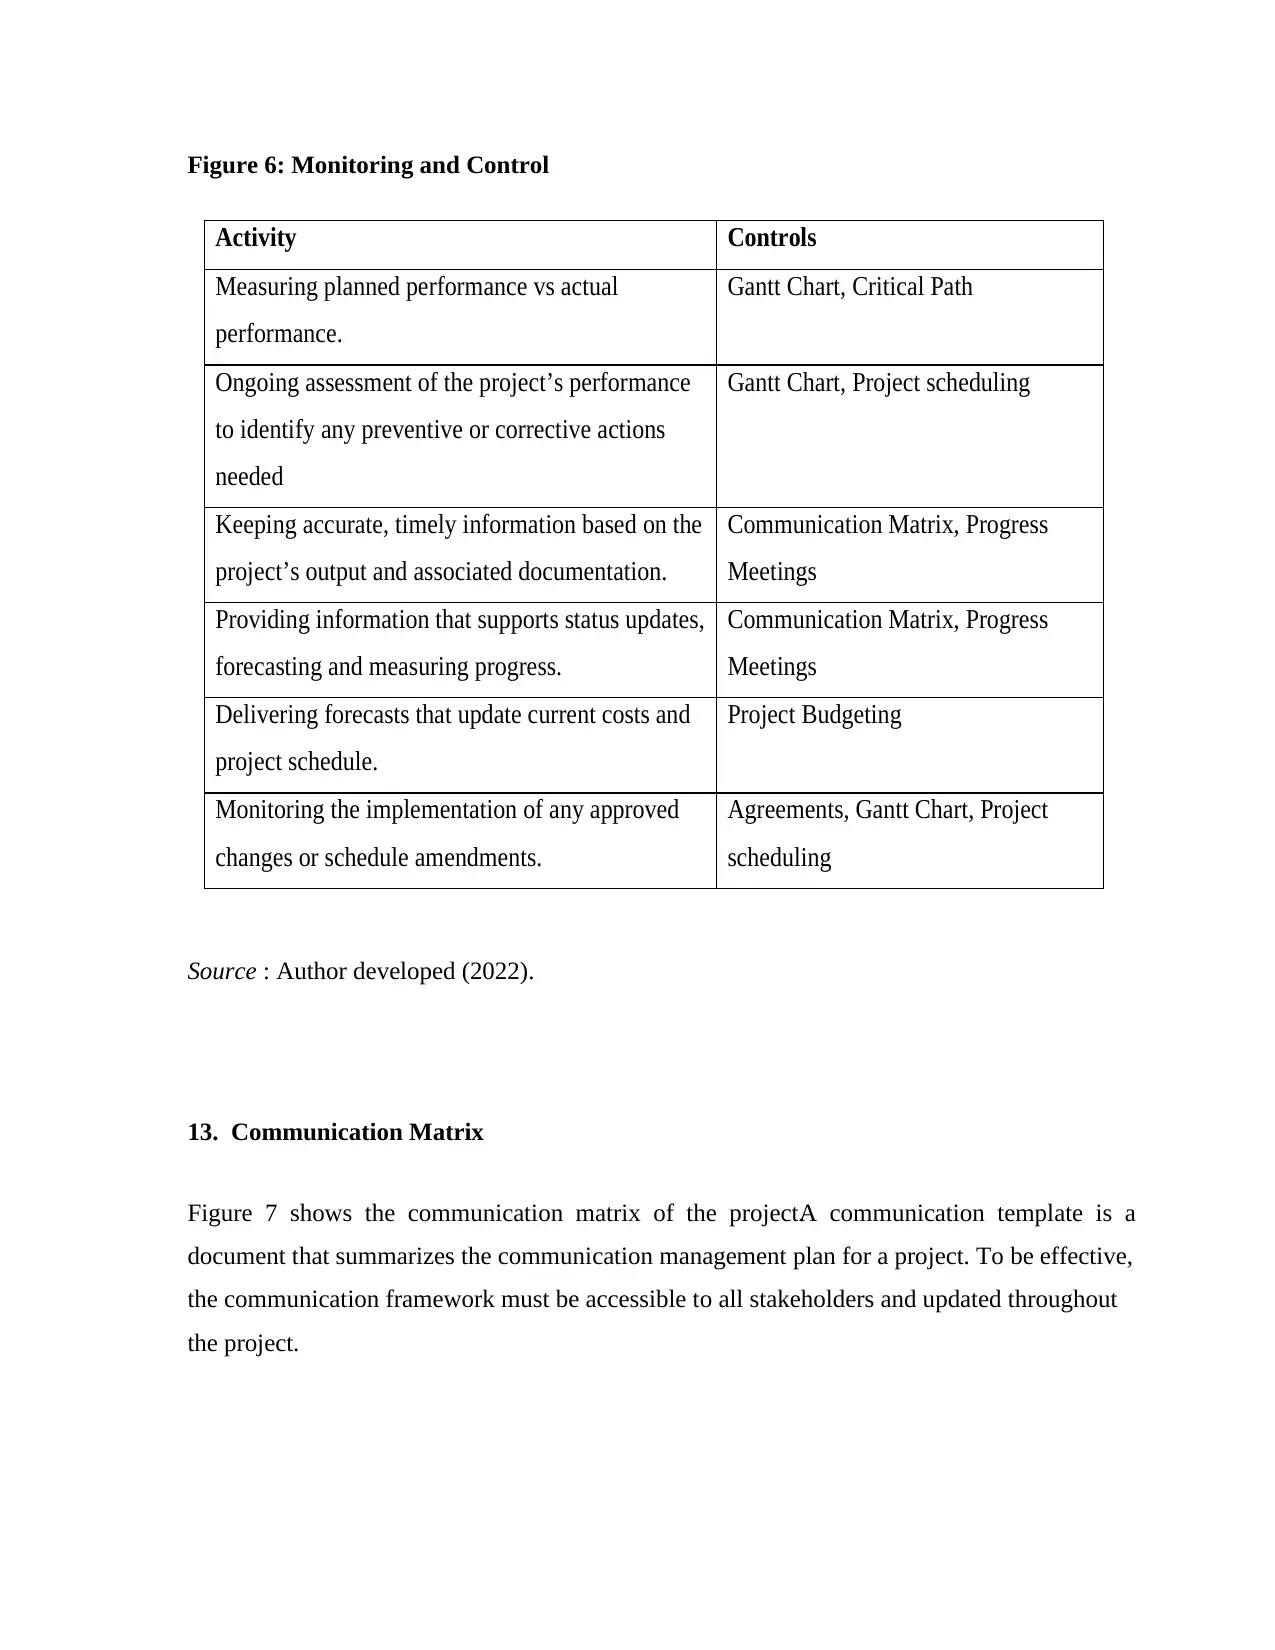
12. Monitoring and Controls
Project monitoring and control requires to keep the project in the track and identify whether
the project is implementing as planned. Figure 6 shows the plan activities to monitor and
control the project progress of COVI.
Have better understanding of project scope
and keep inform stakeholders also
Unclear
requirements
L L Have better understanding of project scope
and keep inform stakeholders also. Have
progress meetings and technical meeting
including main stakeholders, Better
communication process
Employee turnover L H Offer reasonable package, Build good
relationship , Enter in to Agreements
Gold plating –
Adding extra
features
L M Get time extensions and charge price for
additional works.
Source : Author developed (2022).
12. Monitoring and Controls
Project monitoring and control requires to keep the project in the track and identify whether
the project is implementing as planned. Figure 6 shows the plan activities to monitor and
control the project progress of COVI.
Activity Controls
Measuring planned performance vs actual
performance.
Gantt Chart, Critical Path
Ongoing assessment of the project’s performance
to identify any preventive or corrective actions
needed
Gantt Chart, Project scheduling
Keeping accurate, timely information based on the
project’s output and associated documentation.
Communication Matrix, Progress
Meetings
Providing information that supports status updates,
forecasting and measuring progress.
Communication Matrix, Progress
Meetings
Delivering forecasts that update current costs and
project schedule.
Project Budgeting
Monitoring the implementation of any approved
changes or schedule amendments.
Agreements, Gantt Chart, Project
scheduling
Figure 6: Monitoring and Control
Source : Author developed (2022).
13. Communication Matrix
Figure 7 shows the communication matrix of the project.A communication template is a
document that summarizes the communication management plan for a project. To be effective,
the communication framework must be accessible to all stakeholders and updated throughout
the project.
Paraphrase This Document
Need a fresh take? Get an instant paraphrase of this document with our AI Paraphraser
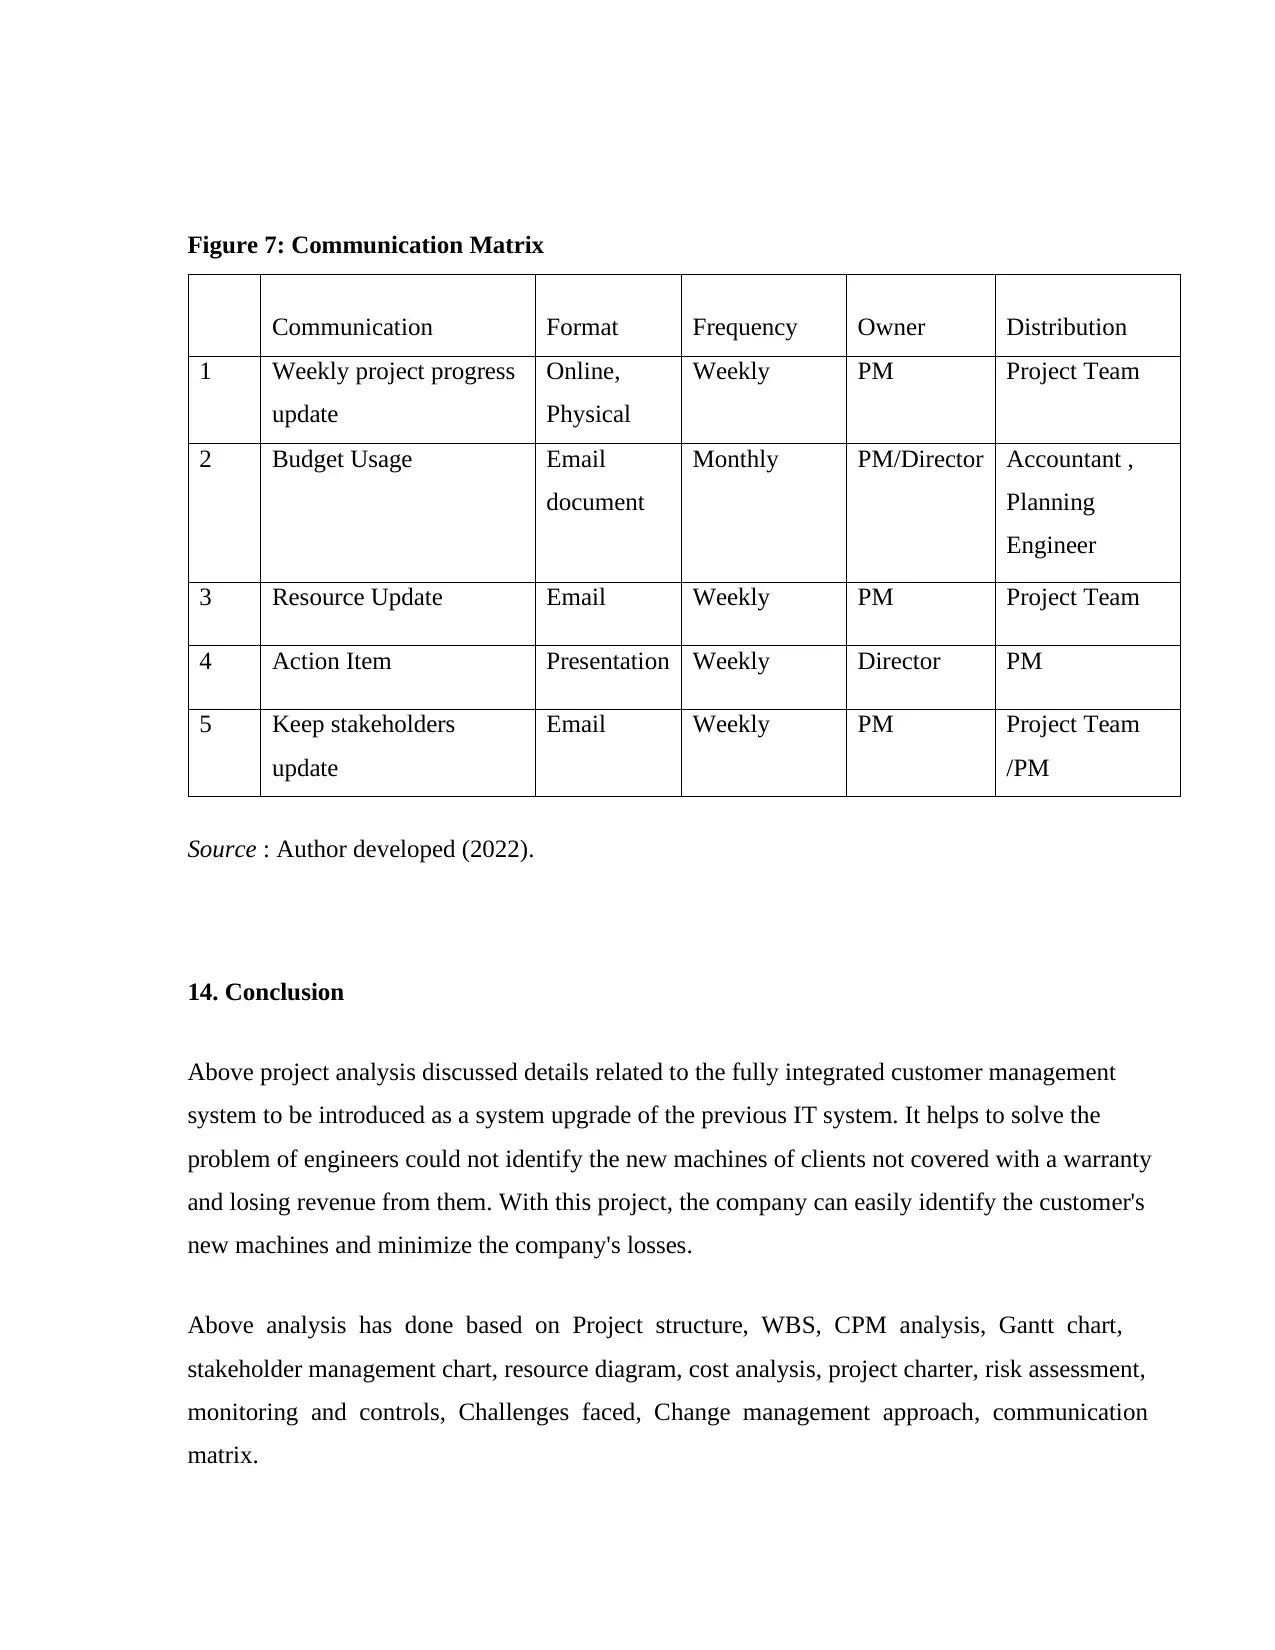
Figure 7: Communication Matrix
Communication Format Frequency Owner Distribution
1 Weekly project progress
update
Online,
Physical
Weekly PM Project Team
2 Budget Usage Email
document
Monthly PM/Director Accountant ,
Planning
Engineer
3 Resource Update Email Weekly PM Project Team
4 Action Item Presentation Weekly Director PM
5 Keep stakeholders
update
Email Weekly PM Project Team
/PM
Source : Author developed (2022).
14. Conclusion
Above project analysis discussed details related to the fully integrated customer management
system to be introduced as a system upgrade of the previous IT system. It helps to solve the
problem of engineers could not identify the new machines of clients not covered with a warranty
and losing revenue from them. With this project, the company can easily identify the customer's
new machines and minimize the company's losses.
Above analysis has done based on Project structure, WBS, CPM analysis, Gantt chart,
stakeholder management chart, resource diagram, cost analysis, project charter, risk assessment,
monitoring and controls, Challenges faced, Change management approach, communication
matrix.
References
Hekim, M. (2018). Gantt Chart in Project Management - apppm. Apppm.man.dtu.dk.
http://apppm.man.dtu.dk/index.php/Gantt_Chart_in_Project_Management.
Maylor, H. (2005). Project management (2nd ed.). Pearson Education.
Project Constraints and How to Manage Them for Project Success • Asana. (n.d.).
https://asana.com/resources/project-constraints.
What Is the Critical Path of a Project?. ProjectManager.com. (2016).
https://www.projectmanager.com/critical-path-method.
Work Breakdown Structure. workbreakdownstructure.com. (n.d.).
https://www.workbreakdownstructure.com/.
Maylor, H. (2005). Project management (2nd ed.). Pearson Education.
Activity Dependenc
ies
Optimistic
Time (Weeks)
Most likely
Time
(weeks)
Pessimistic
Time
(Weeks)
Expected
Time
Estimated
Resource
required
(number)
Cost ($)
/week/
resource
Cost of
items ($)
Total Cost
(OT) ($)
Total Cost
(ML) ($)
Total Cost
(PE) ($)
Total Cost (ET)
($)
A A. Order
barcode labels - 1 3 6 3.17 4 100 1000 1,400.00 2,200.00 3,400.00 2,266.67
B
B. Shortlist
system for
COVI
- 1 2 4 2.17 4 200
800.00 1,600.00 3,200.00 1,733.33
C C. Customer
audits A 3 5 8 5.17 6 400 7,200.00 12,000.00 19,200.00 12,400.00
D
D. Purchase
new customer
systems
B 2 3 4 3.00 3 200 5000
6,200.00 6,800.00 7,400.00 6,800.00
E
E. Recruit
system
Operators
B 4 6 7 5.83 5 300
6,000.00 9,000.00 10,500.00 8,750.00
F
F. Install new
customer
system
D 3 4 8 4.50 3 400
3,600.00 4,800.00 9,600.00 5,400.00
G G. Train the
Operators E, F, S 1 3 6 3.17 3 100 300.00 900.00 1,800.00 950.00
H H. Enter data C, G 2 4 5 3.83 4 300 2,400.00 4,800.00 6,000.00 4,600.00
I I. UAT H 1 2 4 2.17 2 200 400.00 800.00 1,600.00 866.67
J J. Purchase new
server - 2 6 10 6.00 3 300 6000 7,800.00 11,400.00 15,000.00 11,400.00
K K. Configure
new server J 1 3 6 3.17 3 200 600.00 1,800.00 3,600.00 1,900.00
L L. Install
software K 2 3 4 3.00 2 400 1500 3,100.00 3,900.00 4,700.00 3,900.00
M M. Test Server L 1 2 3 2.00 3 200 600.00 1,200.00 1,800.00 1,200.00
N N. Check virus
guard K 2 3 5 3.17 2 200 800.00 1,200.00 2,000.00 1,266.67
O O. Go live I, M, N 0 0 0 0.00 0 0 - - - -
P P. Test live
system O 2 4 7 4.17 4 250 2,000.00 4,000.00 7,000.00 4,166.67
Q
Q. Manage
clients during
go live
O 2 3 5 3.17 4 300
2,400.00 3,600.00 6,000.00 3,800.00
R R. Feedback Q 1 2 3 2.00 2 200 400.00 800.00 1,200.00 800.00
S S. Barcode
arrives A 2 4 5 3.83 3 300 1,800.00 3,600.00 4,500.00 3,450.00
T T. Sign off
completion R,P 1 3 4 2.83 1 400 400.00 1,200.00 1,600.00 1,133.33
48,200.00 75,600.00 110,100.00 76,783.33
3,355.00 3,355.00 3,355.00 3,355.00
51,555.00 78,955.00 113,455.00 80,138.33
1,031.10 1,579.10 2,269.10 1,602.77
52,586.10 80,534.10 115,724.10 81,741.10
Total Activity Cost
PM Cost for 26.84 Weeks (per week salary $ 125)
Total Project Cost
Bonus
Total Project Cost including Bonus ($)
Annexes
Annex 1: Project Costing
Secure Best Marks with AI Grader
Need help grading? Try our AI Grader for instant feedback on your assignments.
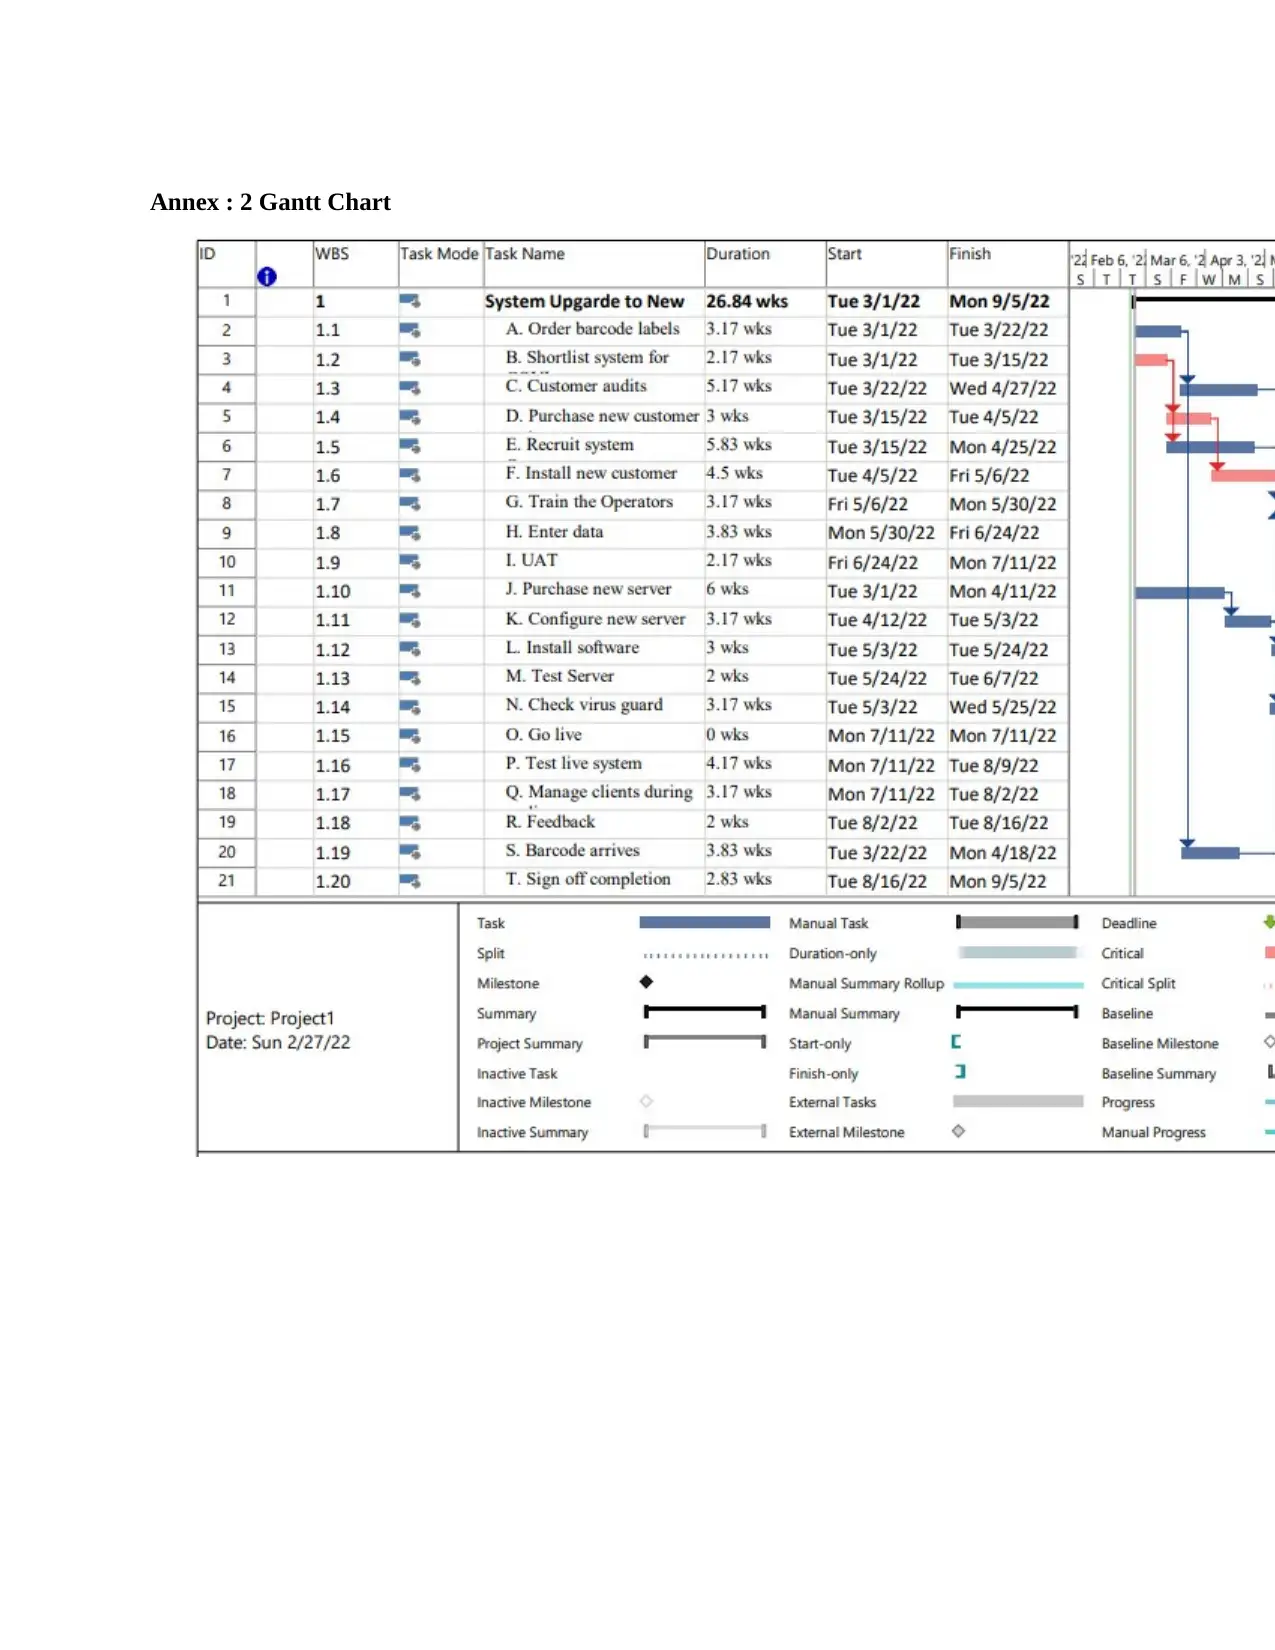
Annex : 2 Gantt Chart
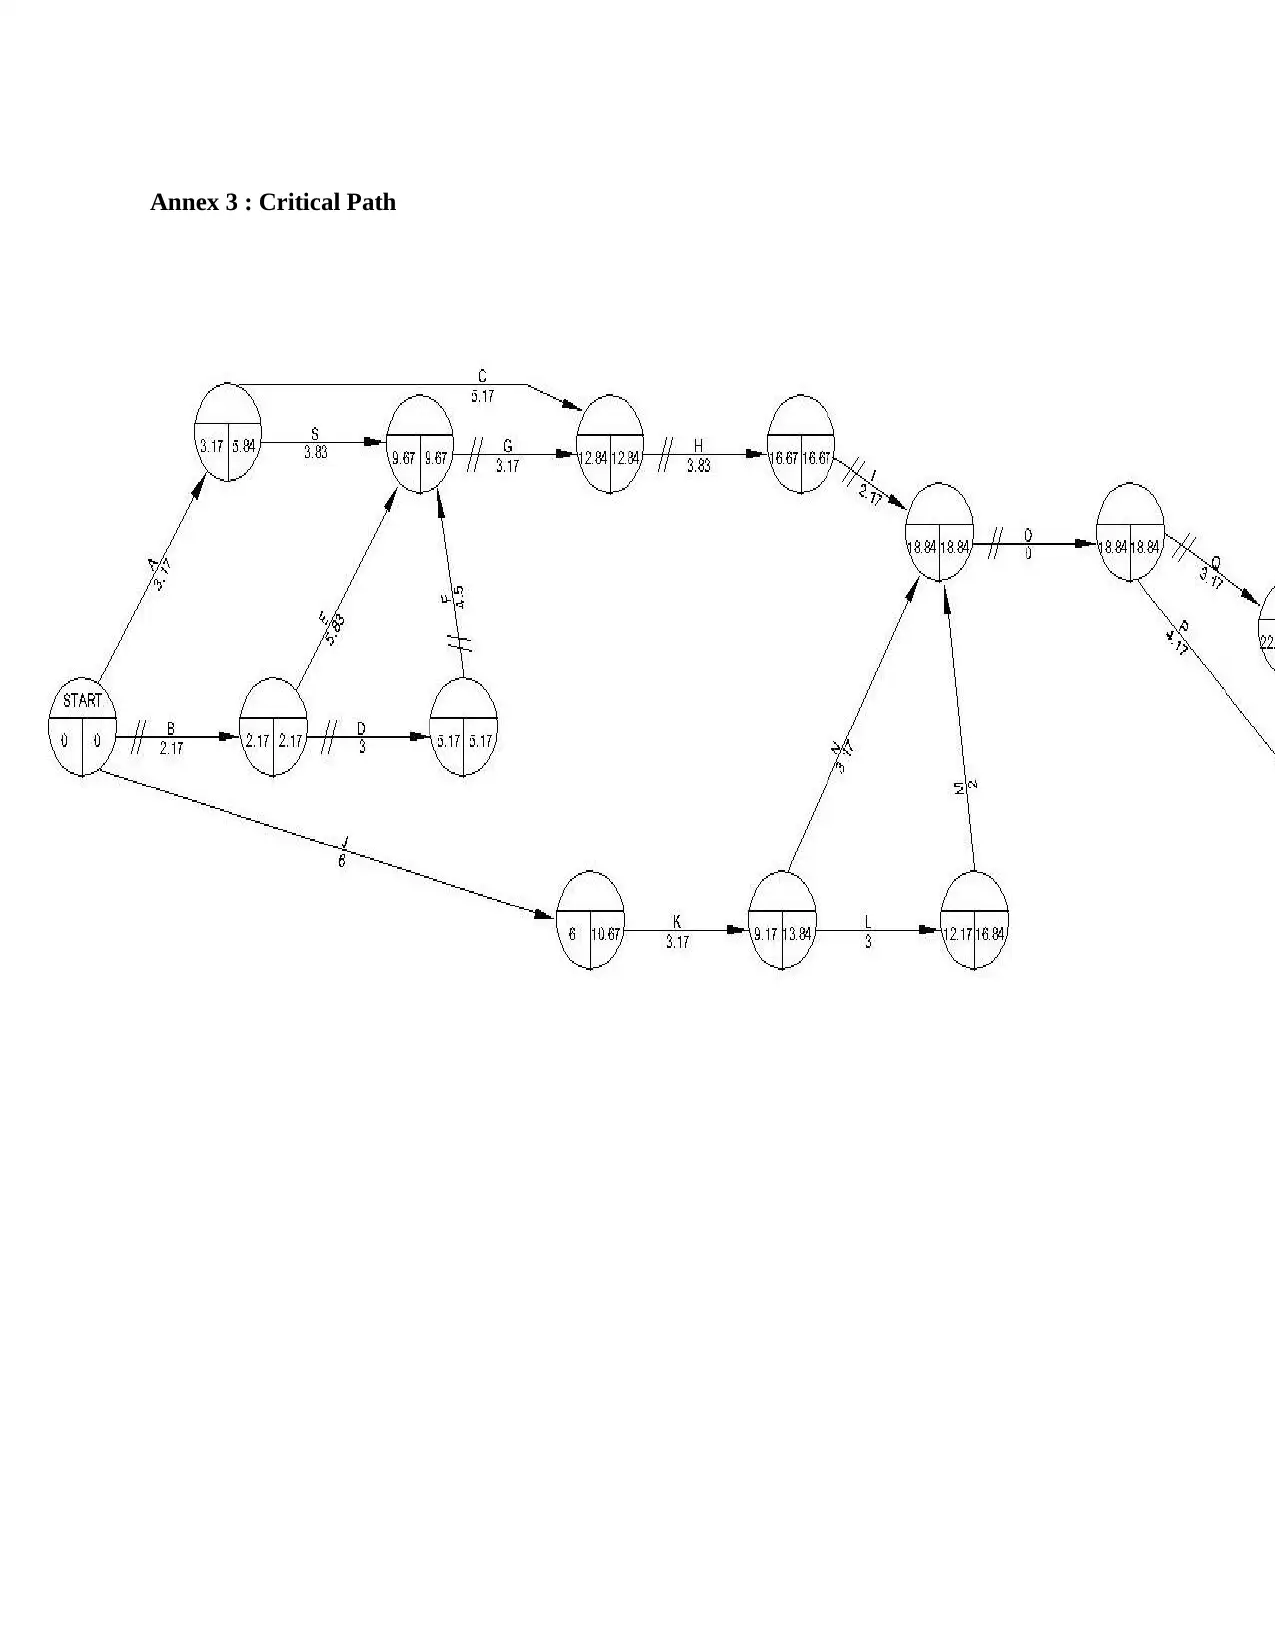
Annex 3 : Critical Path
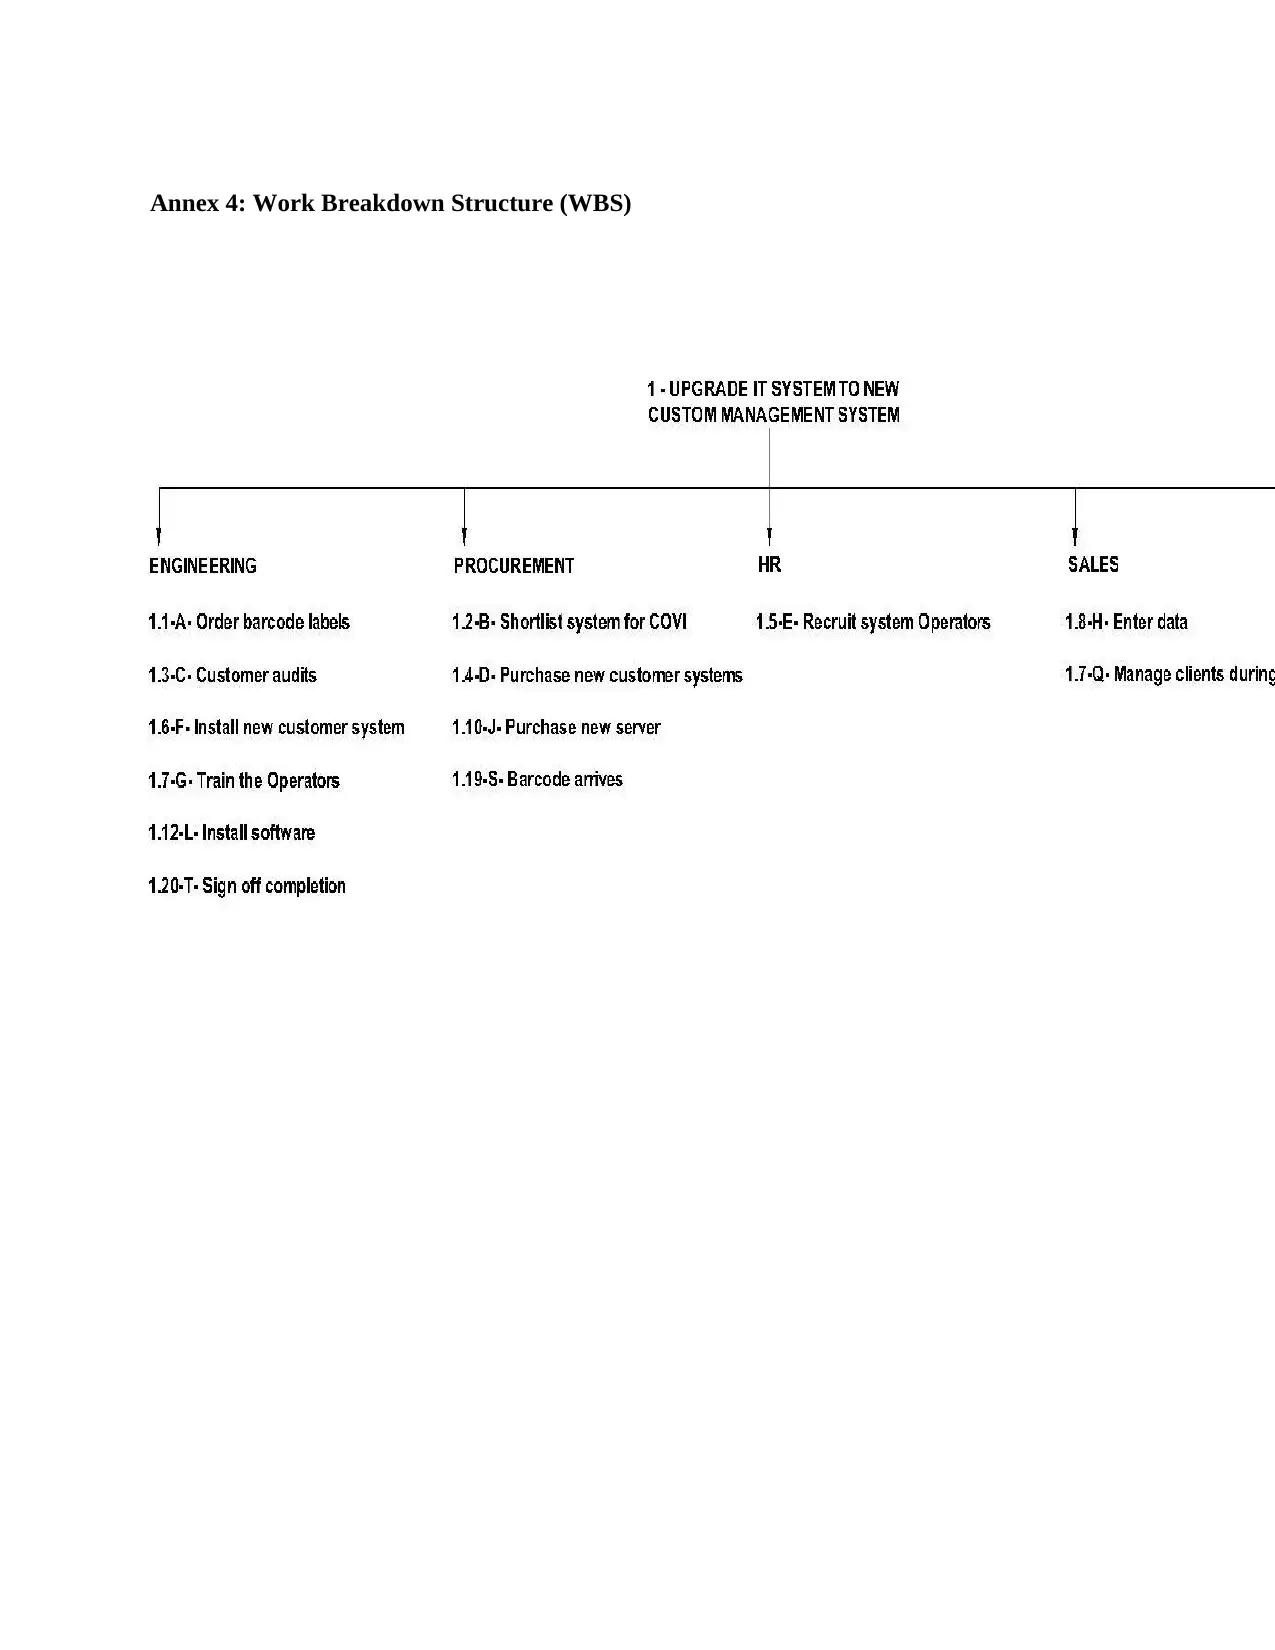
Annex 4: Work Breakdown Structure (WBS)
Paraphrase This Document
Need a fresh take? Get an instant paraphrase of this document with our AI Paraphraser
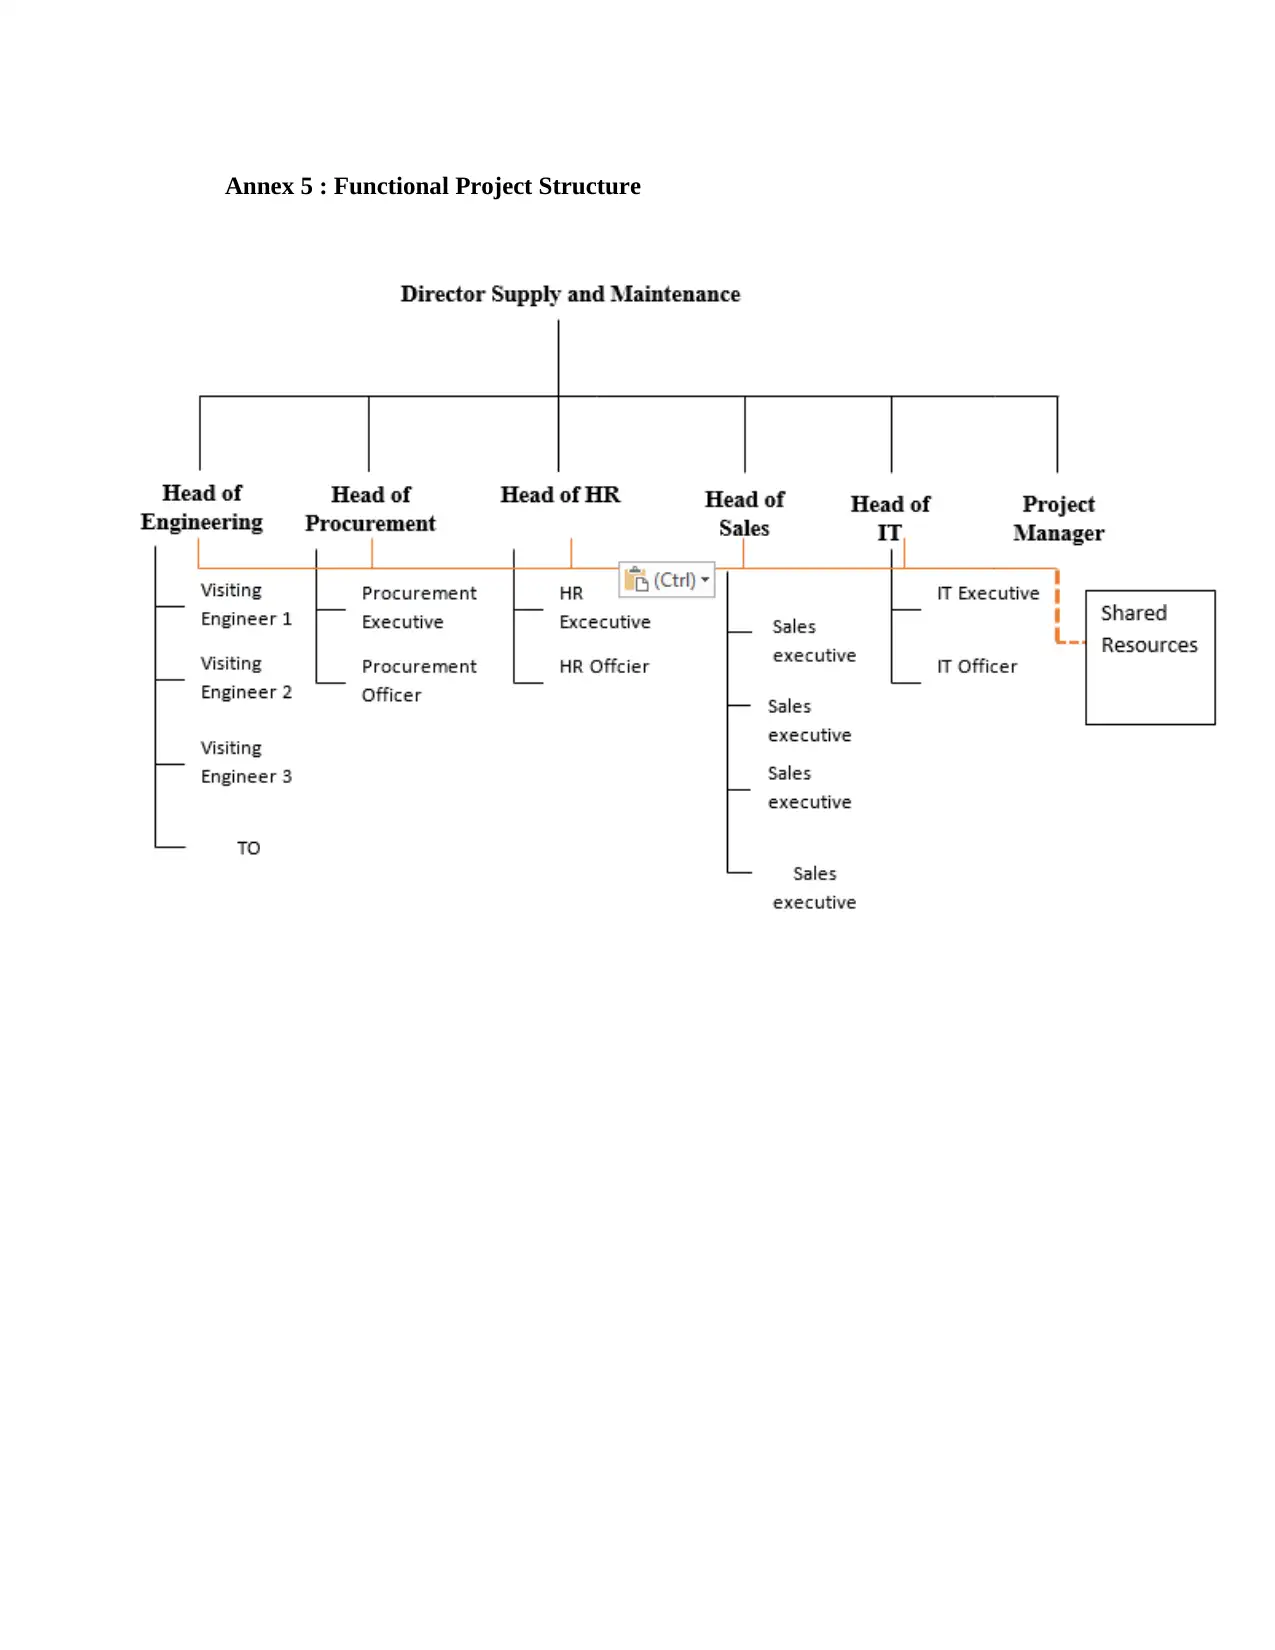
Annex 5 : Functional Project Structure
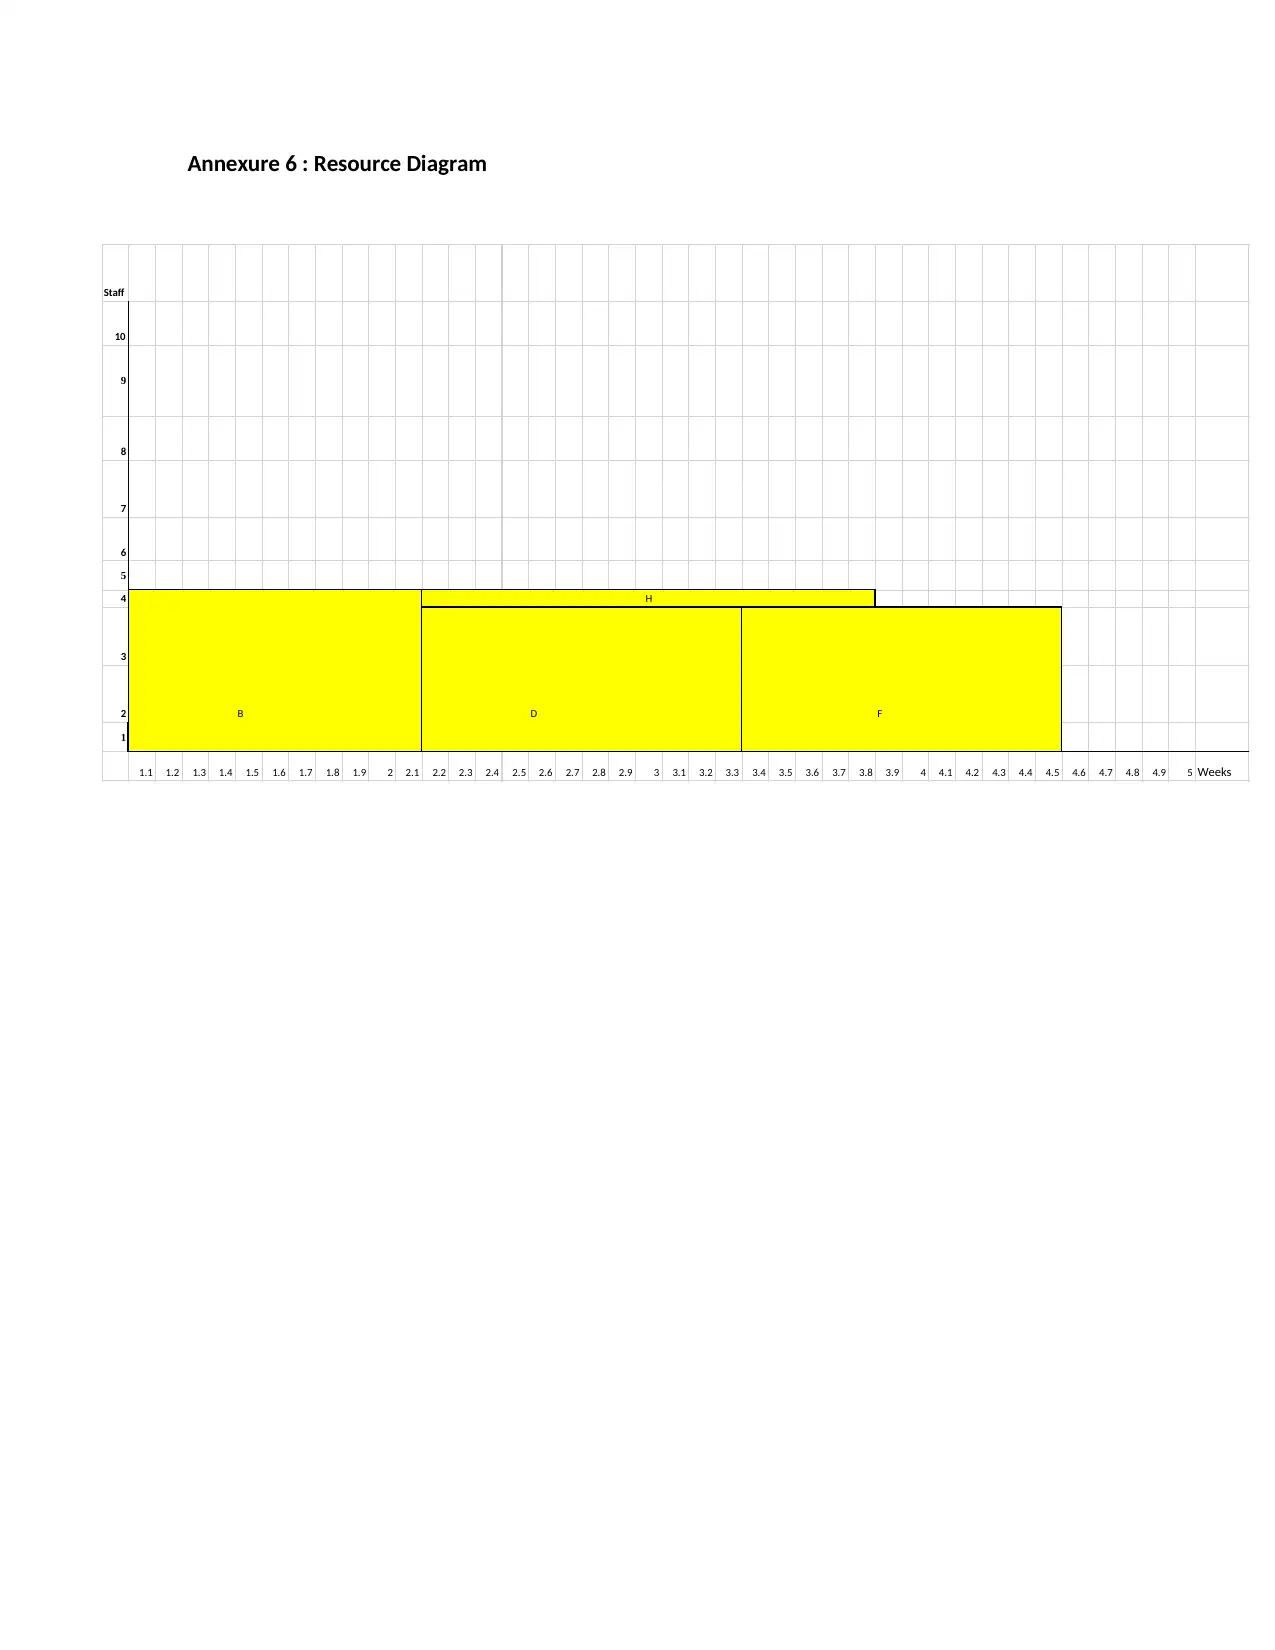
Annexure 6 : Resource Diagram
Staff
10
9
8
7
6
5
4
3
2 B D F
1
1.1 1.2 1.3 1.4 1.5 1.6 1.7 1.8 1.9 2 2.1 2.2 2.3 2.4 2.5 2.6 2.7 2.8 2.9 3 3.1 3.2 3.3 3.4 3.5 3.6 3.7 3.8 3.9 4 4.1 4.2 4.3 4.4 4.5 4.6 4.7 4.8 4.9 5 Weeks
H
Staff
10
9
8
7
6
5
4
3
2 B D F
1
1.1 1.2 1.3 1.4 1.5 1.6 1.7 1.8 1.9 2 2.1 2.2 2.3 2.4 2.5 2.6 2.7 2.8 2.9 3 3.1 3.2 3.3 3.4 3.5 3.6 3.7 3.8 3.9 4 4.1 4.2 4.3 4.4 4.5 4.6 4.7 4.8 4.9 5 Weeks
H
1 out of 21


Your All-in-One AI-Powered Toolkit for Academic Success.
+13062052269
info@desklib.com
Available 24*7 on WhatsApp / Email
![[object Object]](/_next/static/media/star-bottom.7253800d.svg)
Unlock your academic potential
© 2024 | Zucol Services PVT LTD | All rights reserved.