Data Analysis Report: Cambridge Humidity Levels and Forecasting
VerifiedAdded on 2023/01/17
|9
|1475
|23
Report
AI Summary
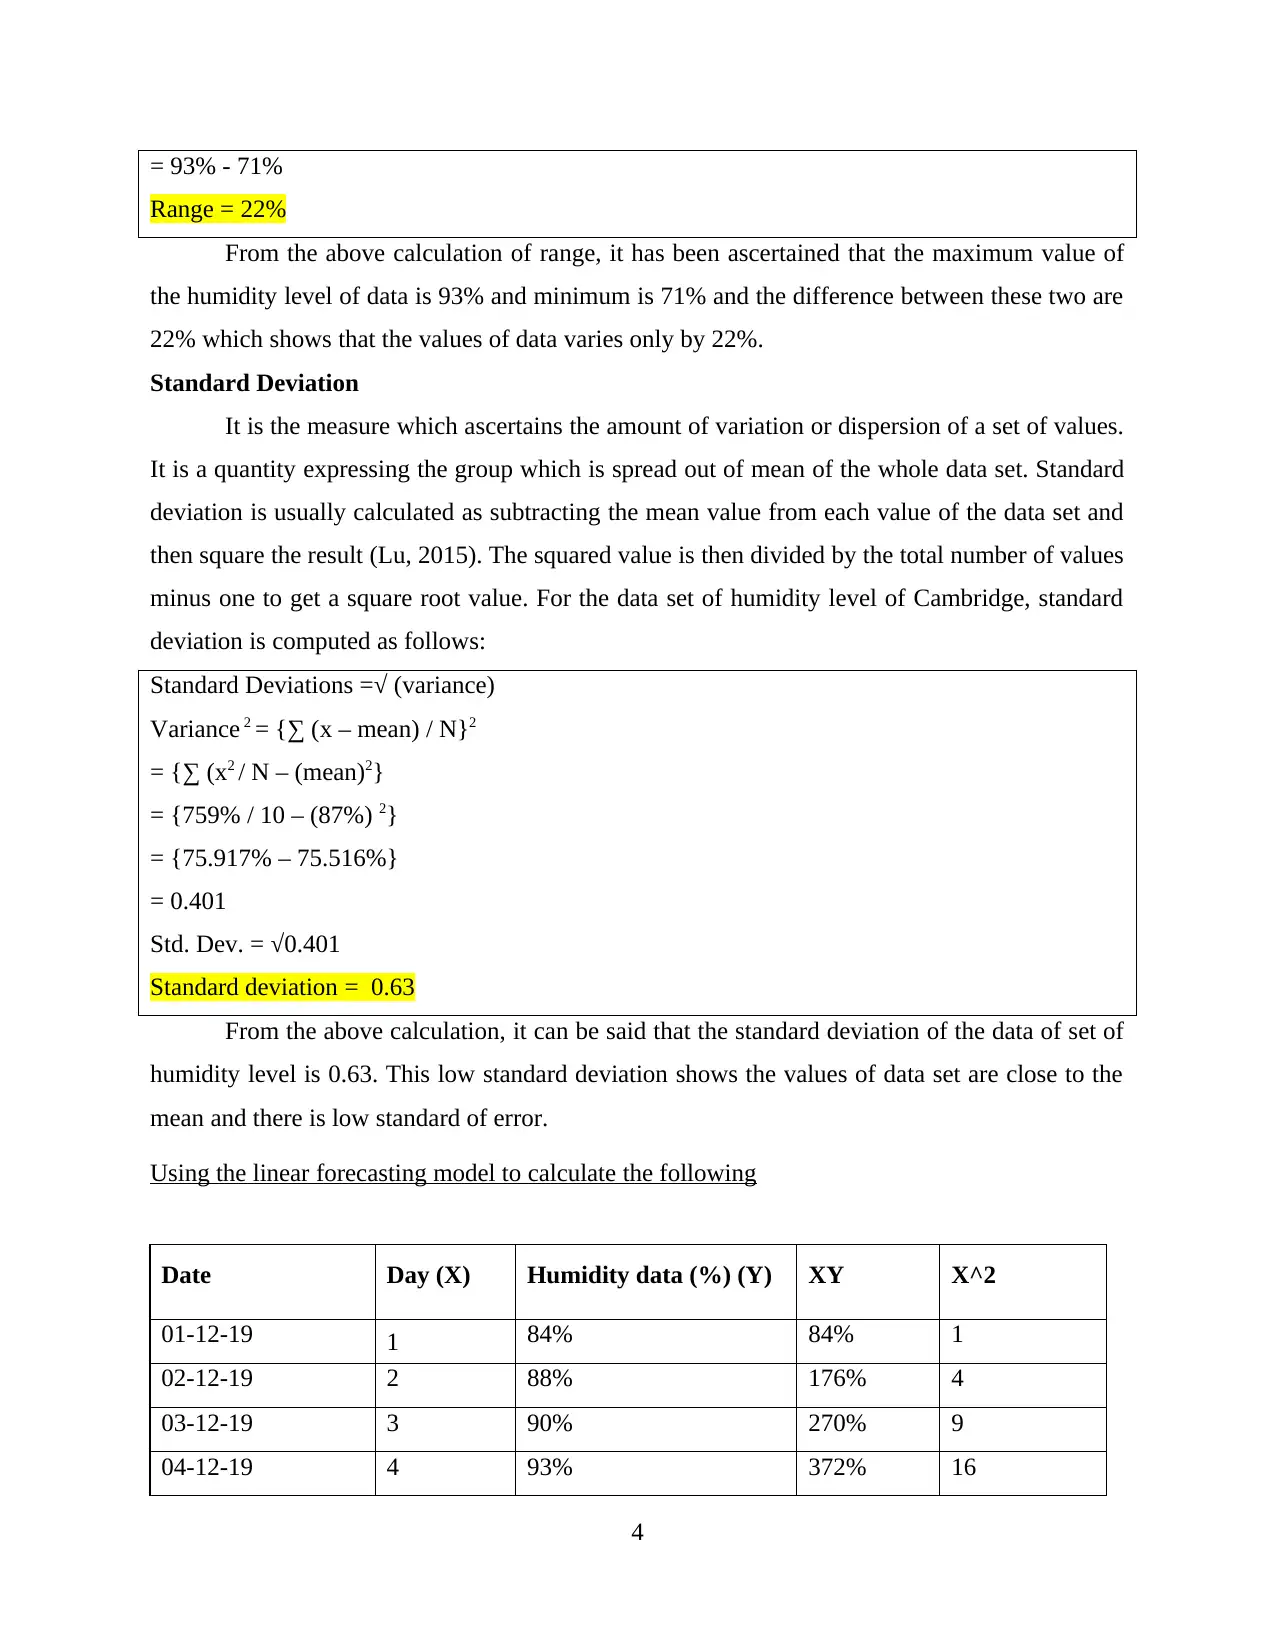
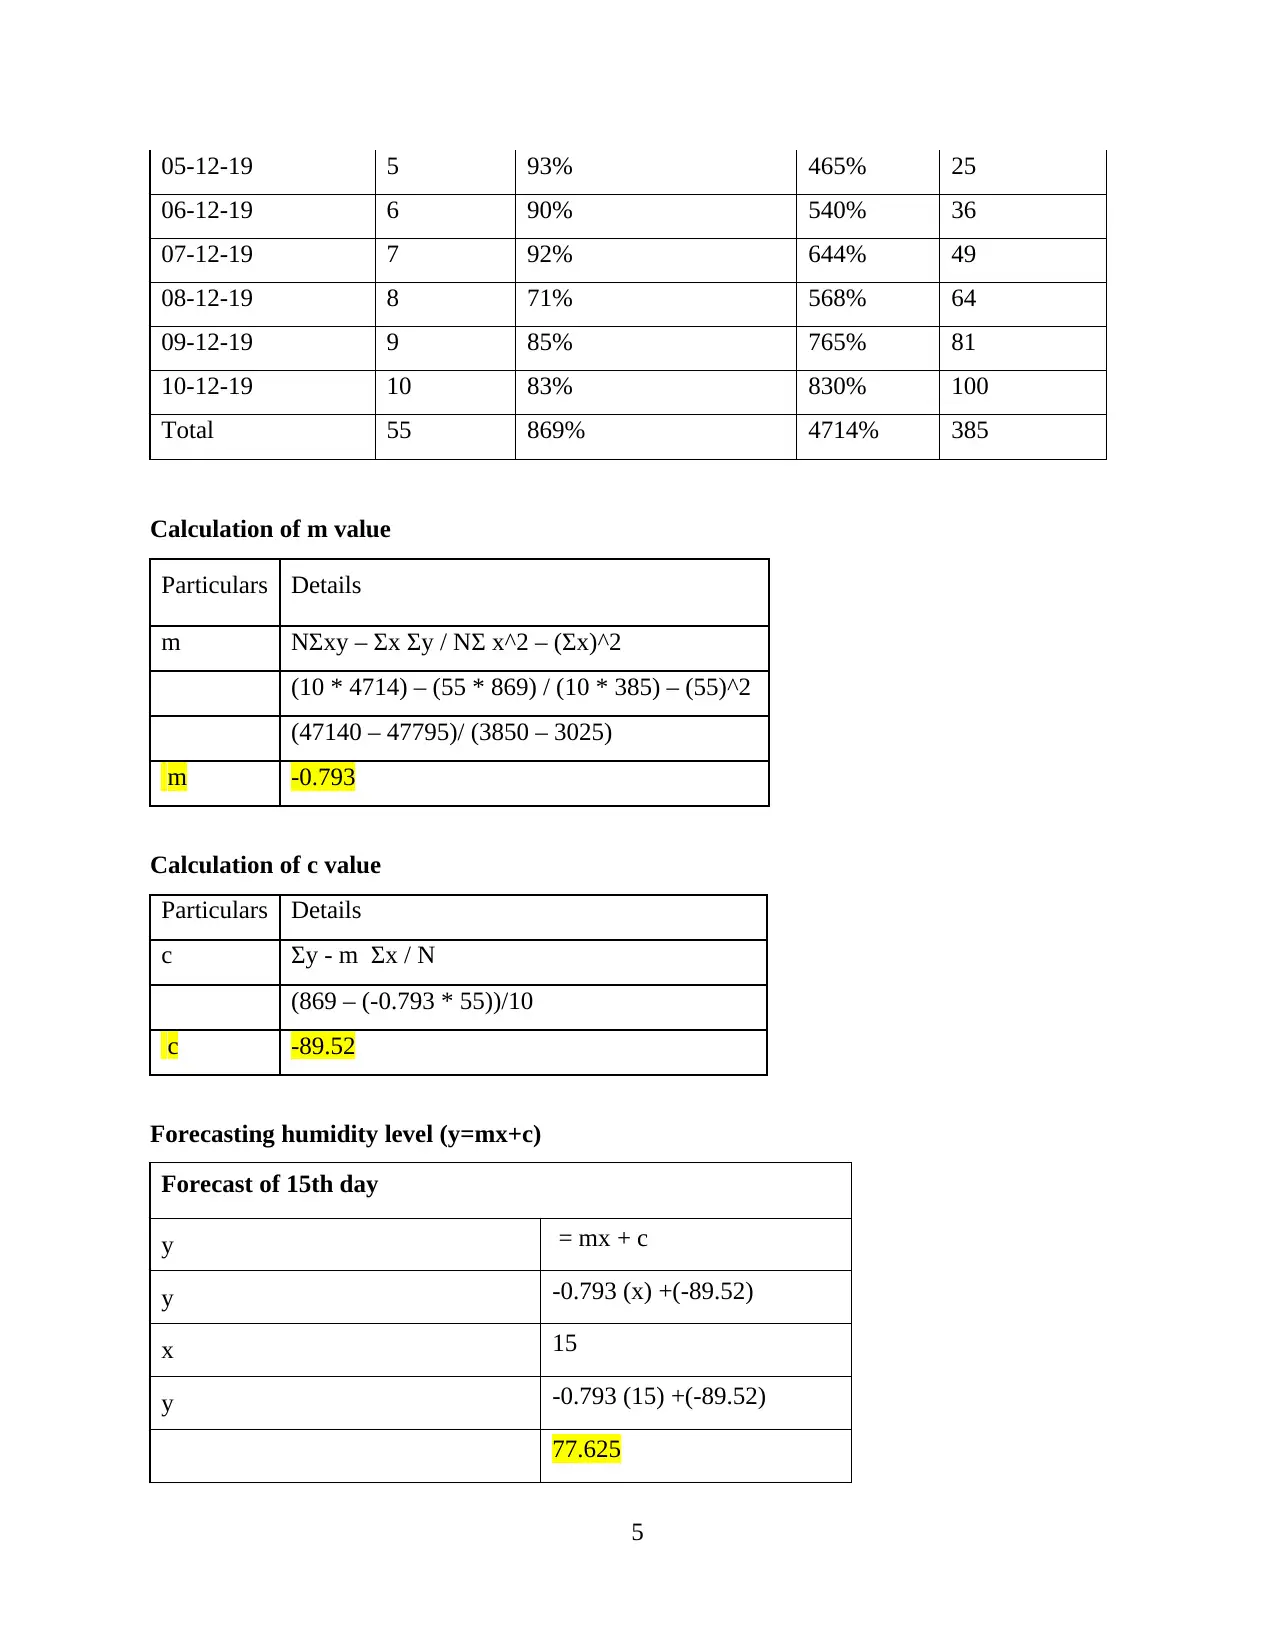
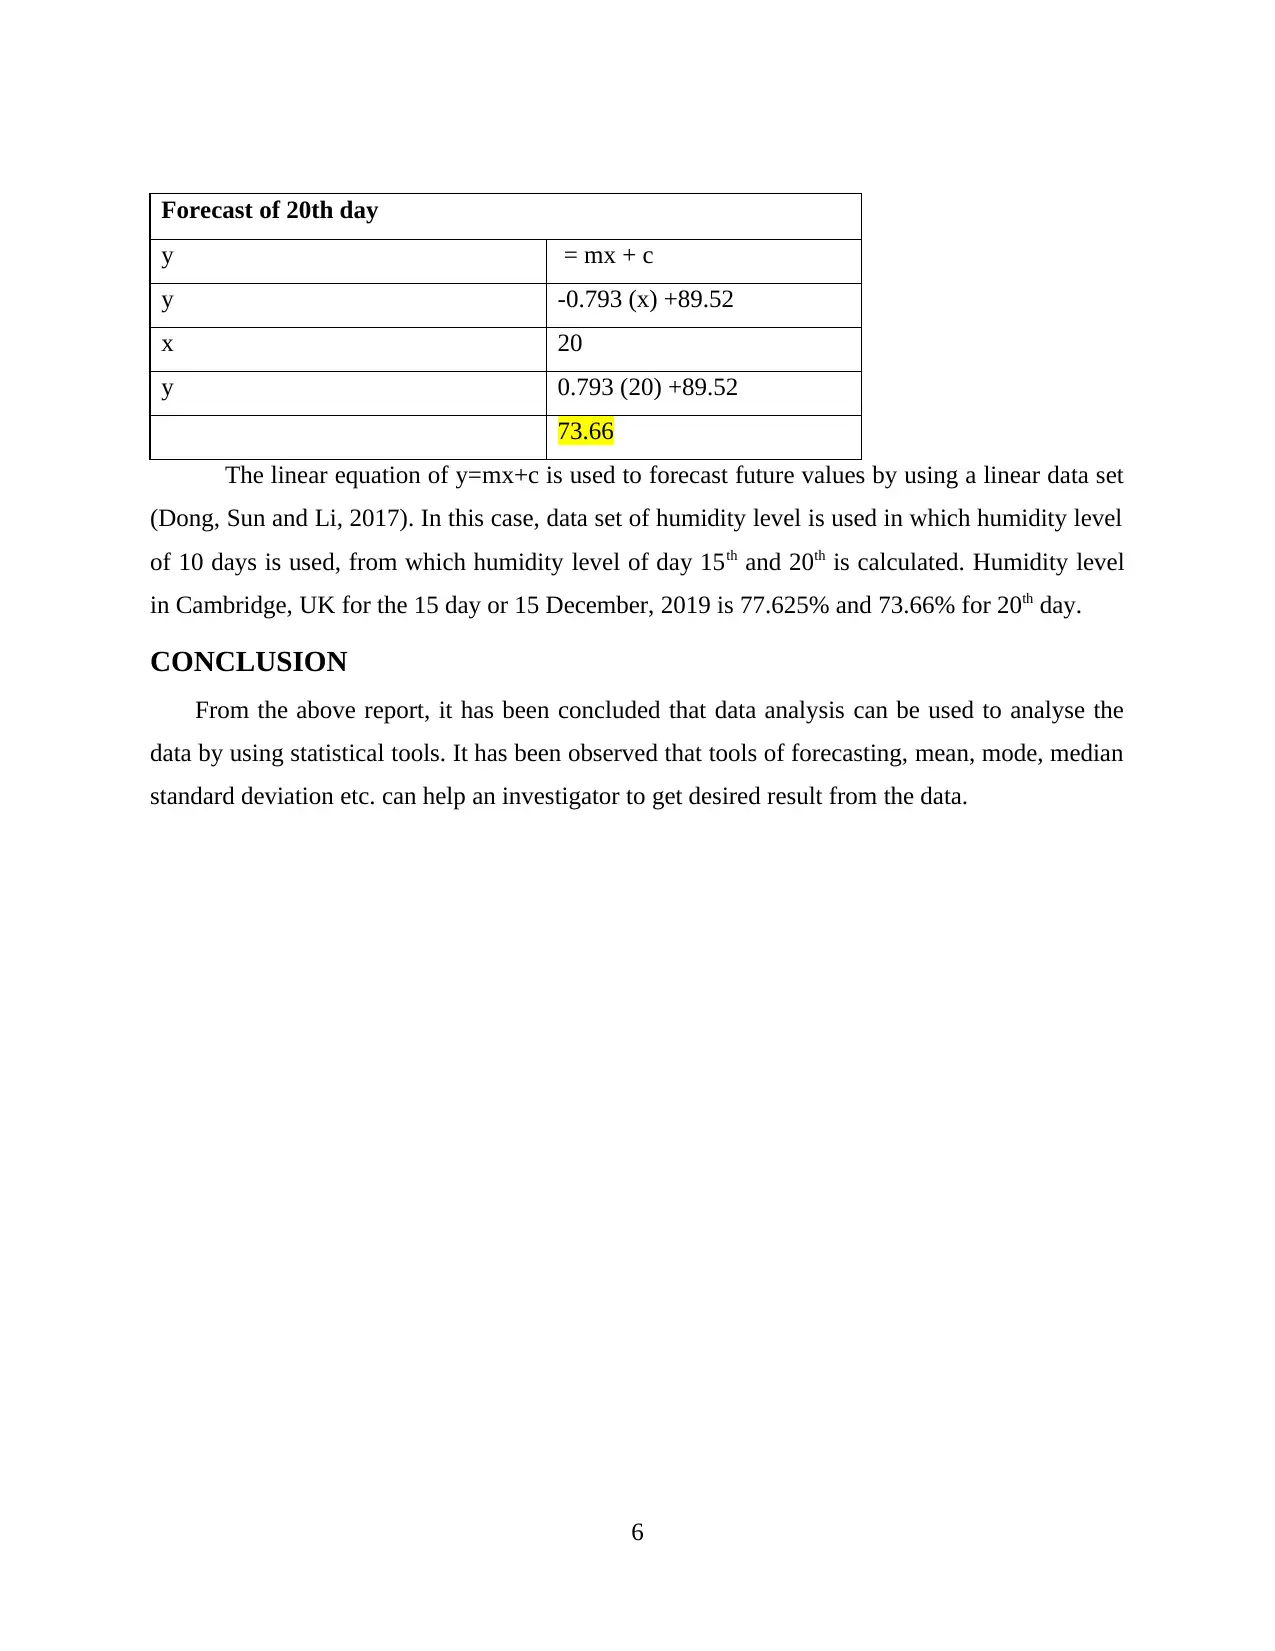
This report presents a comprehensive data analysis of humidity levels in Cambridge, United Kingdom, over a ten-day period in December 2019. The analysis begins with organizing the data in a tabular format, followed by graphical representations using column and line charts for visual clarity. Descriptive statistical tools, including mean, median, mode, range, and standard deviation, are calculated and discussed to provide insights into the central tendencies and variability of the data. Furthermore, the report employs a linear forecasting model to predict humidity levels for the 15th and 20th days, offering a predictive analysis based on the historical data. The conclusion summarizes the effectiveness of data analysis techniques in extracting meaningful results and making informed decisions. The report includes references to relevant academic sources.

1 out of 9
Related Documents


Your All-in-One AI-Powered Toolkit for Academic Success.
+13062052269
info@desklib.com
Available 24*7 on WhatsApp / Email
![[object Object]](/_next/static/media/star-bottom.7253800d.svg)
Copyright © 2020–2026 A2Z Services. All Rights Reserved. Developed and managed by ZUCOL.