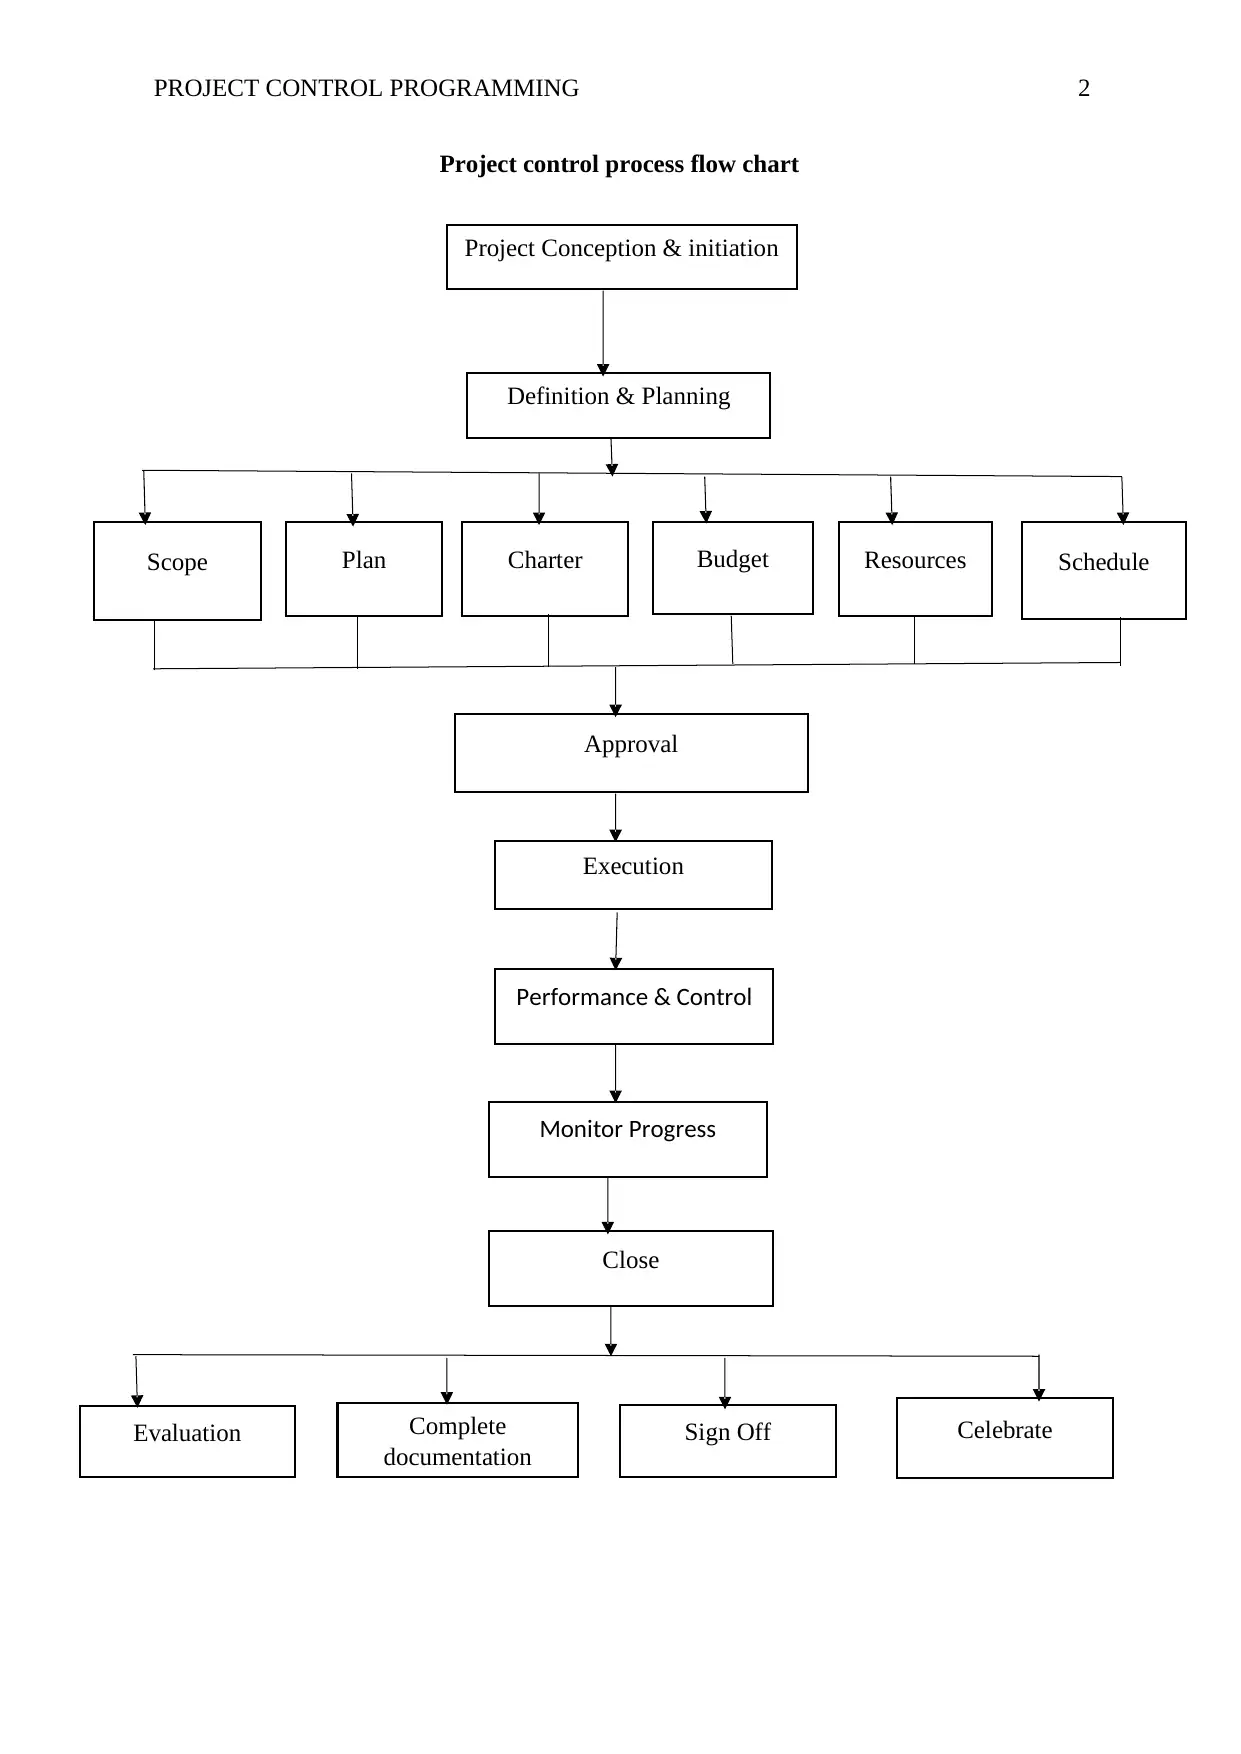
CME703: Project Control Programming for Construction Projects
VerifiedAdded on 2023/06/04
|11
|1447
|475
Homework Assignment
AI Summary
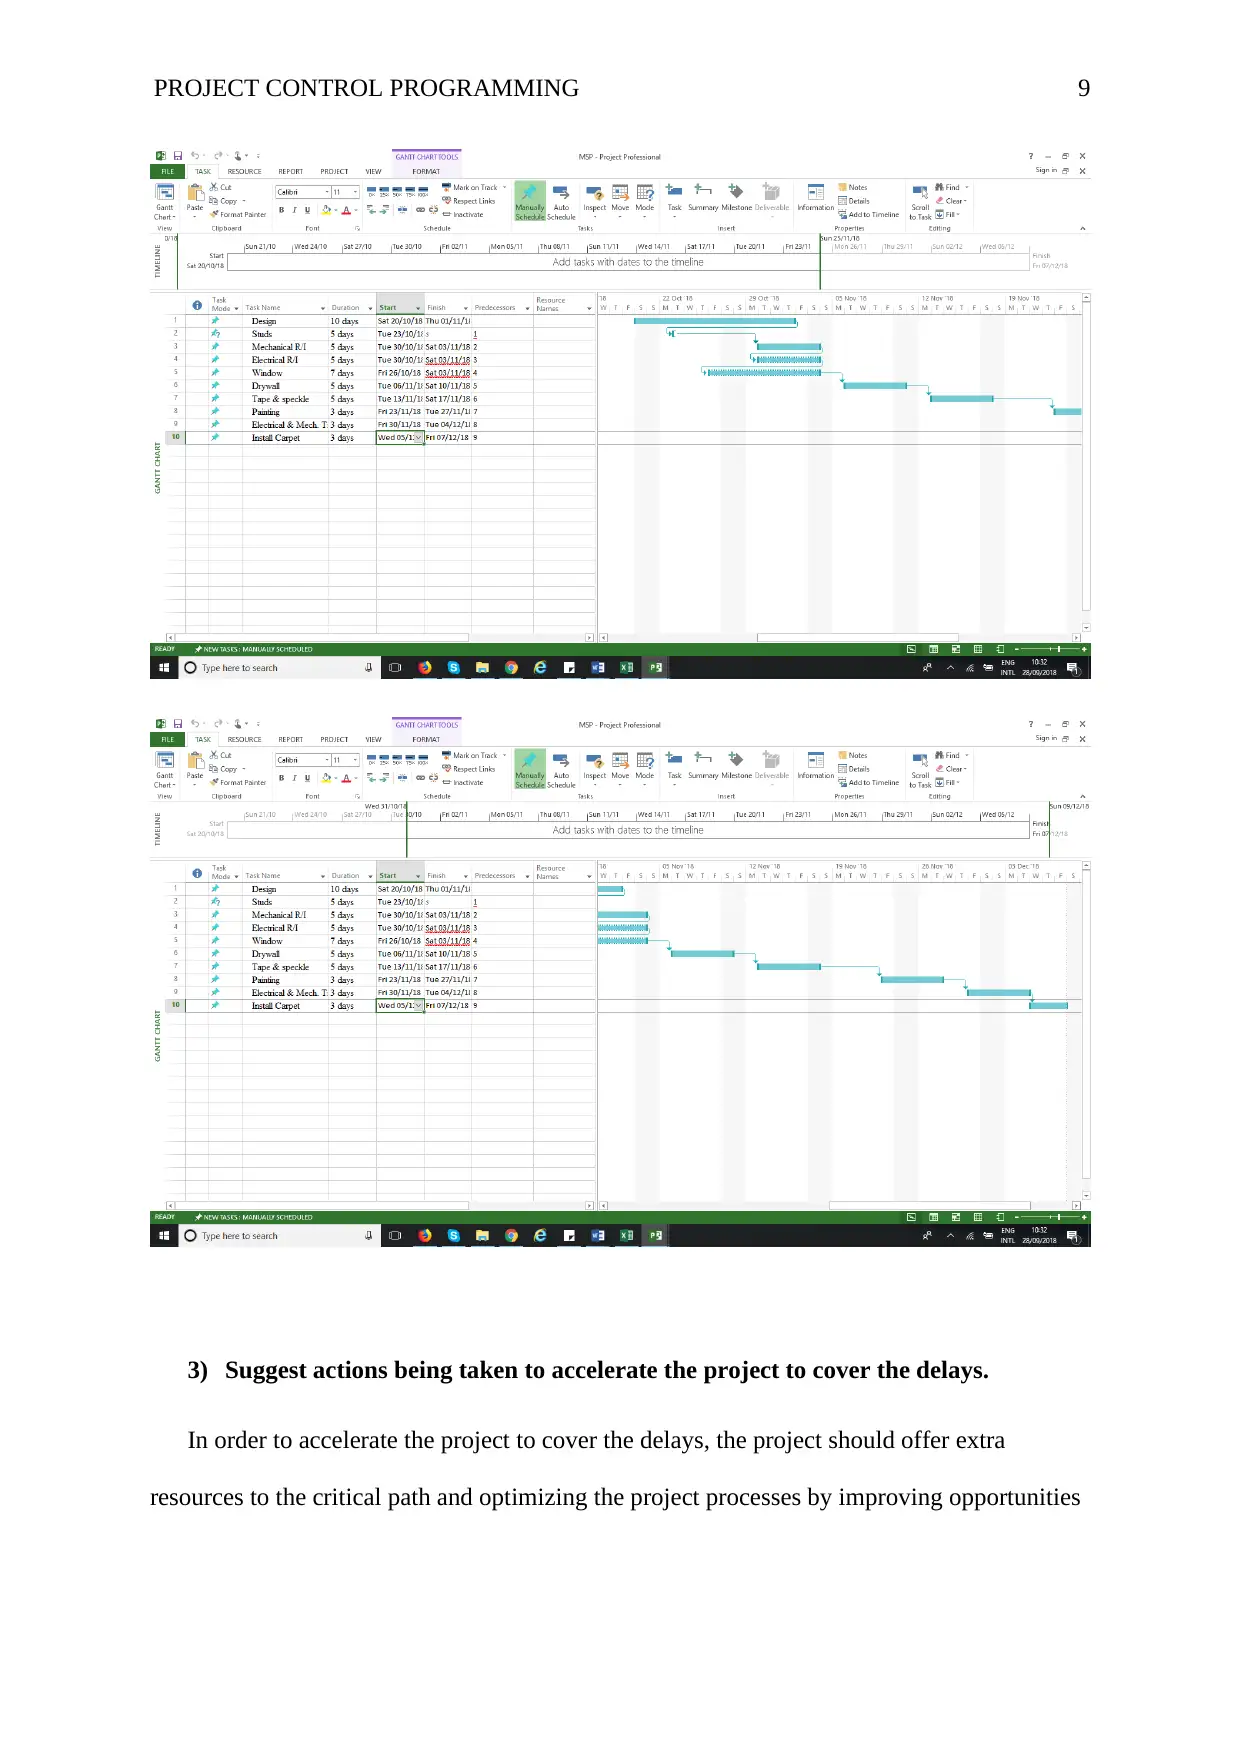
This assignment solution delves into project control programming, emphasizing its application in construction projects. It includes a general procedure flowchart combining time, money, and resource control, deemed useful for controlling construction projects in the United States. The solution also identifies key categories and details of information—such as time, cost, and scope—necessary for a construction project manager to evaluate potential overruns or subcontractor issues. Furthermore, it addresses a problem-solving task involving the use of MS Project to create bar charts based on provided data, reflecting project schedules and critical paths. The assignment also analyzes the project's current status, revises the project schedule to reflect any changes, suggests actions to accelerate the project to cover delays, and analyzes the potential impacts of those actions. Desklib offers a variety of resources including past papers and solved assignments to assist students.

1 out of 11
Related Documents


Your All-in-One AI-Powered Toolkit for Academic Success.
+13062052269
info@desklib.com
Available 24*7 on WhatsApp / Email
![[object Object]](/_next/static/media/star-bottom.7253800d.svg)
Copyright © 2020–2026 A2Z Services. All Rights Reserved. Developed and managed by ZUCOL.