Data Visualization Project: Course Code, Module Name, University
VerifiedAdded on 2019/09/13
|2
|395
|386
Project
AI Summary
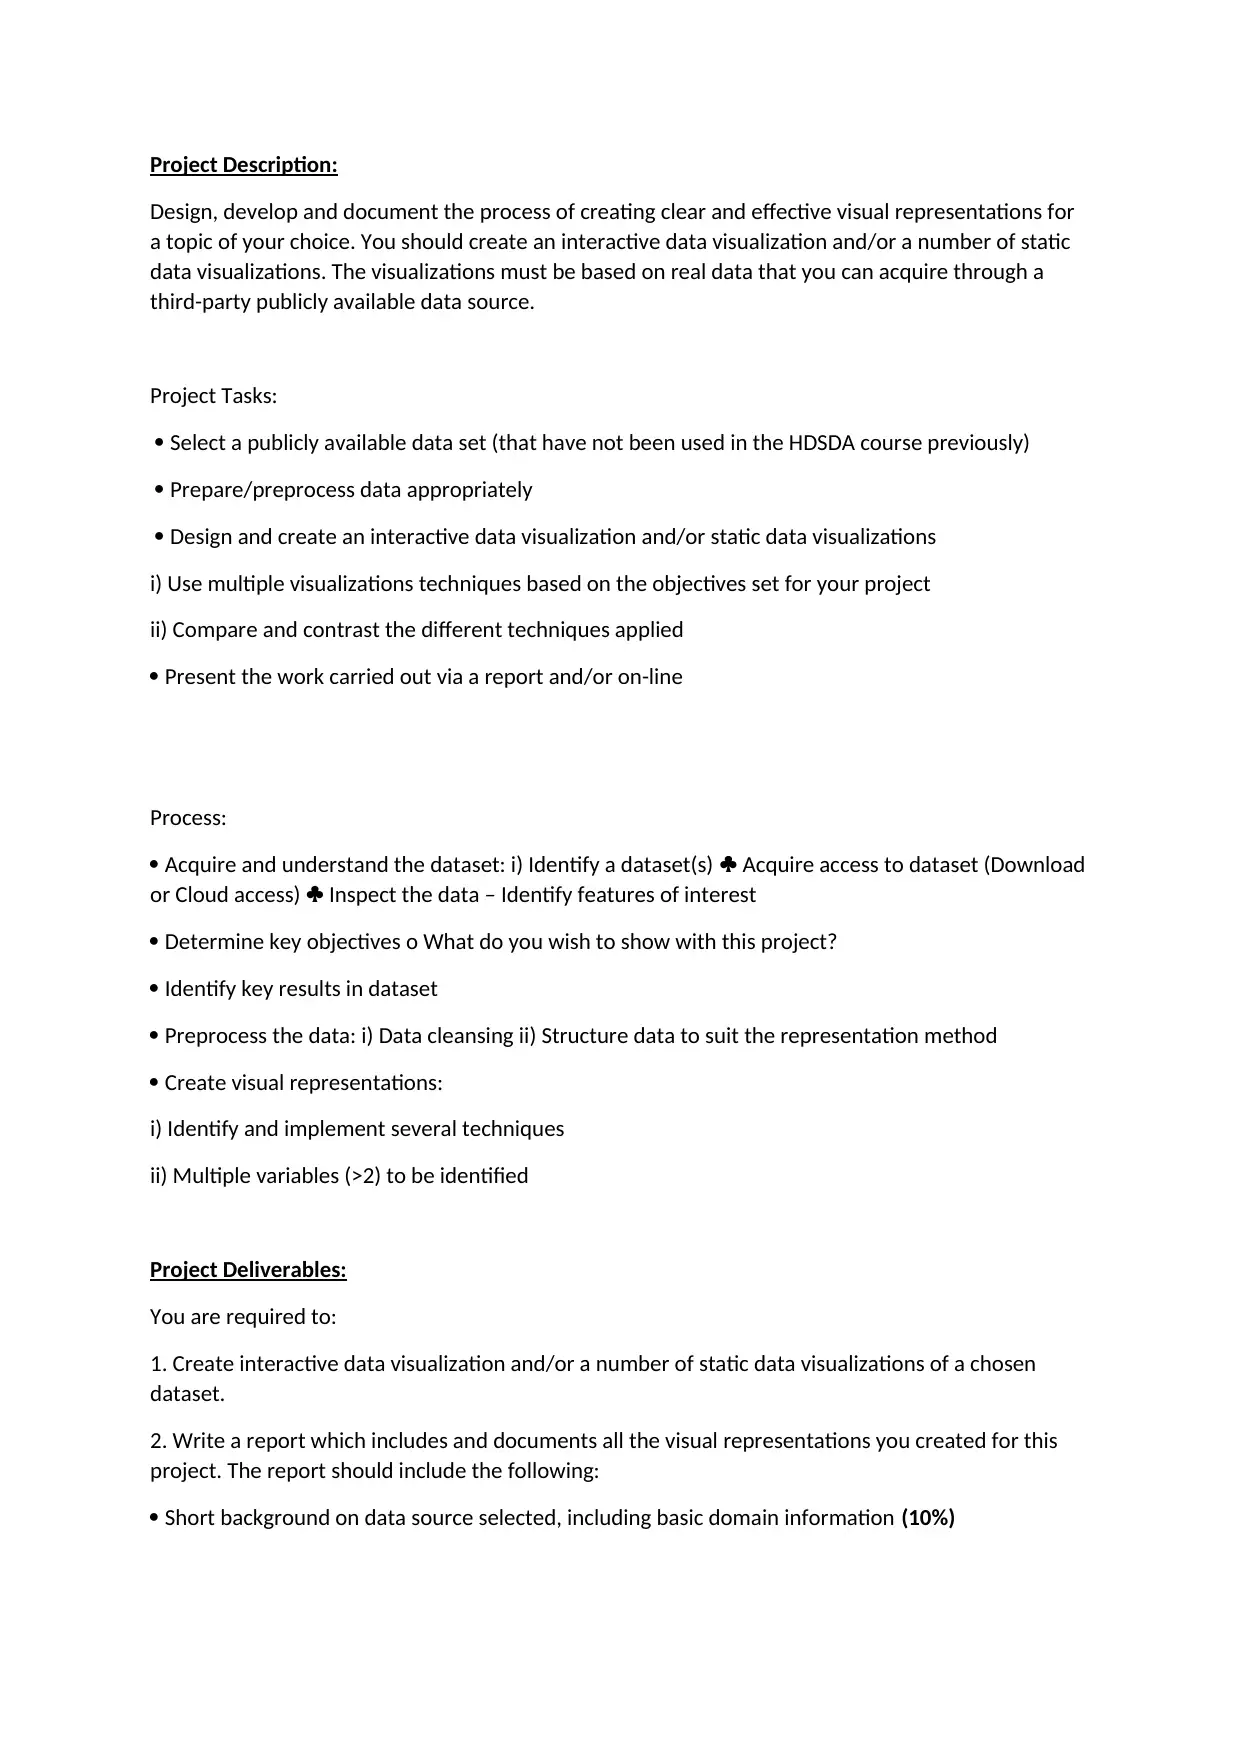
This project focuses on creating interactive and static data visualizations using a chosen publicly available dataset. The assignment requires students to preprocess the data, design and implement multiple visualization techniques, and write a comprehensive report. The report should include background information on the data source, project objectives, a detailed outline of the visual design process, justifications for the techniques used, and a discussion of the results. The project also includes a reflection on the challenges and successes of the project. The final deliverable is a report that documents all visualizations and findings, demonstrating the ability to analyze data, create effective visualizations, and communicate insights. This project is a practical application of data science principles, emphasizing the importance of visual communication in data analysis and interpretation. Students will use multiple visualization techniques to represent the data and compare and contrast their effectiveness. They will also be required to identify and implement several techniques and show multiple variables. This project aims to enhance students' understanding of data visualization, data preprocessing, and report writing skills.

1 out of 2
Related Documents


Your All-in-One AI-Powered Toolkit for Academic Success.
+13062052269
info@desklib.com
Available 24*7 on WhatsApp / Email
![[object Object]](/_next/static/media/star-bottom.7253800d.svg)
Copyright © 2020–2026 A2Z Services. All Rights Reserved. Developed and managed by ZUCOL.