Project Development and Optimisation: Sensitivity Analysis Project
VerifiedAdded on 2020/03/16
|16
|3728
|170
Project
AI Summary
This project development and optimization assignment focuses on evaluating a specific project using sensitivity analysis, a financial tool for assessing how independent variables affect dependent variables. The assignment analyzes a project for Woolworths, aiming to enhance employee effectiveness through training, performance assessment, and effective recruitment. It presents three cases: base, worst, and best, computing the present value of net benefits and equivalent annual benefits for each. The analysis considers varying interest and sales growth rates to determine project viability. The sensitivity analysis helps in modeling the risks associated with project development by viewing all the aspects of project and impact of such tool on overall objective of the project. The project viability is evaluated based on comparison of economic or financial opportunity cost of capital to the internal rate of return of project. The sensitivity analysis is conducted by computing initial data, sensitive margin of data, calculating critical points relating to project development and evaluating the impact of net present value on ranking of project indexes.

Running head: PROJECT DEVELOPMENT AND OPTIMISATION
Project Development and Optimisation
Name of the Student:
Name of the University:
Author’s Note:
Course ID:
Project Development and Optimisation
Name of the Student:
Name of the University:
Author’s Note:
Course ID:
Paraphrase This Document
Need a fresh take? Get an instant paraphrase of this document with our AI Paraphraser
1PROJECT DEVELOPMENT AND OPTIMISATION
Table of Contents
Introduction:....................................................................................................................................2
Explanation of sensitivity analysis:.................................................................................................2
Conclusion:......................................................................................................................................9
References:....................................................................................................................................10
2PROJECT DEVELOPMENT AND OPTIMISATION
Introduction:
The current assignment aims to focus on evaluating a specific project with the help of the
financial tool, which is sensitivity analysis method. As commented by Borgonovo and Plischke
(2016), sensitivity analysis is a method utilised for ascertaining the way the various values of an
independent variable influence a specific dependent variable under a provided set of
assumptions. It is considered as what-if or simulation analysis for anticipating the result of a
decision; however, the variable range needs to be provided. This assignment focuses on
presenting three different cases for the project and these cases include the base case, worst case
and best case for evaluating the viability of project of Woolworths. Woolworths is seeking to
increase the effectiveness of employees for which they intend to adopt effective program such as
training, performance assessment and effective recruitment. The analysis of three different
alternative of project is done by considering all the three cases that involves computation of
present value of net benefit and equivalent annual benefits. Based on the assumptions, the
equivalent annual rate has been computed to provide a comprehensive view of the project
outcomes to the concerned organisation.
Explanation of sensitivity analysis:
Sensitivity analysis is one of the methods that helps in modelling of risks associated with
project development. There are several risks that is associated with any project and analysis of
such risks to the project development is done by implementing the tool of sensitivity analysis by
viewing all the aspects of project and impact of such tool on overall objective of the project.
Management would be assisted by acquainting themselves with the level of impact several
elements and enabling them in setting priorities and achieving end result on prompt basis. The
⊘ This is a preview!⊘
Do you want full access?
Subscribe today to unlock all pages.
Trusted by 1+ million students worldwide
3PROJECT DEVELOPMENT AND OPTIMISATION
impact of each risks identified in the project development is quantified rather than relying on
qualitative description of such associated risks. Such tool helps in prompt discerning of the risks
that are worth talking by facilitating comparison between various elements of project. Risks that
have a considerable impact on objective attainment and concentrating on the efforts taken by
management to lower or reduce such risks. Risk reduction helps in seamless running of the
project (Zhang and Wallace 2015).
The project viability is evaluated based on comparison of economic or financial
opportunity cost of capital to the internal rate of return of project. Focus of sensitivity analysis is
to perform the analysis of changes in key variables impact on net present value or internal rate of
return of project. Main concern of sensitivity analysis is factors and other combination of factors
that would have unfavourable consequences. Identification of such factors is done as project
assumption or project risks. In event of non-occurrence of certain assumptions of project, tool of
sensitivity analysis helps in estimating the impact of such assumptions on achieving the project
objectives.
Organization is able to ascertain the most probable outcome for any project relating to the
quantitative assessment of associated risks and deal with the establishment of valid risk level. In
the initial parameter, if there is greater fluctuation range, then the risk associated with the project
is lower. The conduction of sensitivity analysis involves techniques such as computation of
initial data, computation of sensitive margin of data, calculating some of critical point relating to
project development. It should also involve evaluation of impact of net present value on ranking
of project indexes. Sensitivity analysis is regarded as illuminating and powerful methodology
despite is does not require undertaking of complex procedures of probability sampling and
results interpretation. For any projects, one of the most critical factor is individual parameters
Paraphrase This Document
Need a fresh take? Get an instant paraphrase of this document with our AI Paraphraser
4PROJECT DEVELOPMENT AND OPTIMISATION
and in relation to this particular requirement for evaluating any project, sensitivity analysis is
regarded as the best technique. When dealing with the cost side of project of any organisation,
some of major parameters that is considered under this particular analysis involves major inputs
prices and productivity coefficient. The economic worth of any project is determined by
explaining the significance of any particular input variable (Chittenden and Derregia 2015).
Application of sensitivity analysis is regarded as universal for project and the worth of project is
measured using this particular technique. Some sophisticated and detailed technique requires
information and resources. In this regard, sensitivity analysis are appointed by organisation as it
does not seek enough resources, time and information.
Sensitivity analysis purpose:
Base case is regarded as the most probable outcome scenario and sensitivity analysis is a
financial technique that is used for investigating the changes in such base case resulting from
changes in project variables. The purpose of sensitivity analysis is to inspect the impact of any
adverse changes in key variables. Identification of key variables that impacts the project streams
and project cost is done by such analysis. Assessment of decision of projects resulting from such
changes is done by sensitivity tool.
` As laid out by Gan et al. (2014), sensitivity analysis is formed to gain an insight of the
effect of a variable range on a provided outcome. The realization of sensitivity analysis should be
done in a systematic manner and certain steps are required to be taken for achieving the purpose
of sensitivity analysis. There are certain steps followed in conducting sensitivity analysis and
these steps are depicted briefly as follows:
5PROJECT DEVELOPMENT AND OPTIMISATION
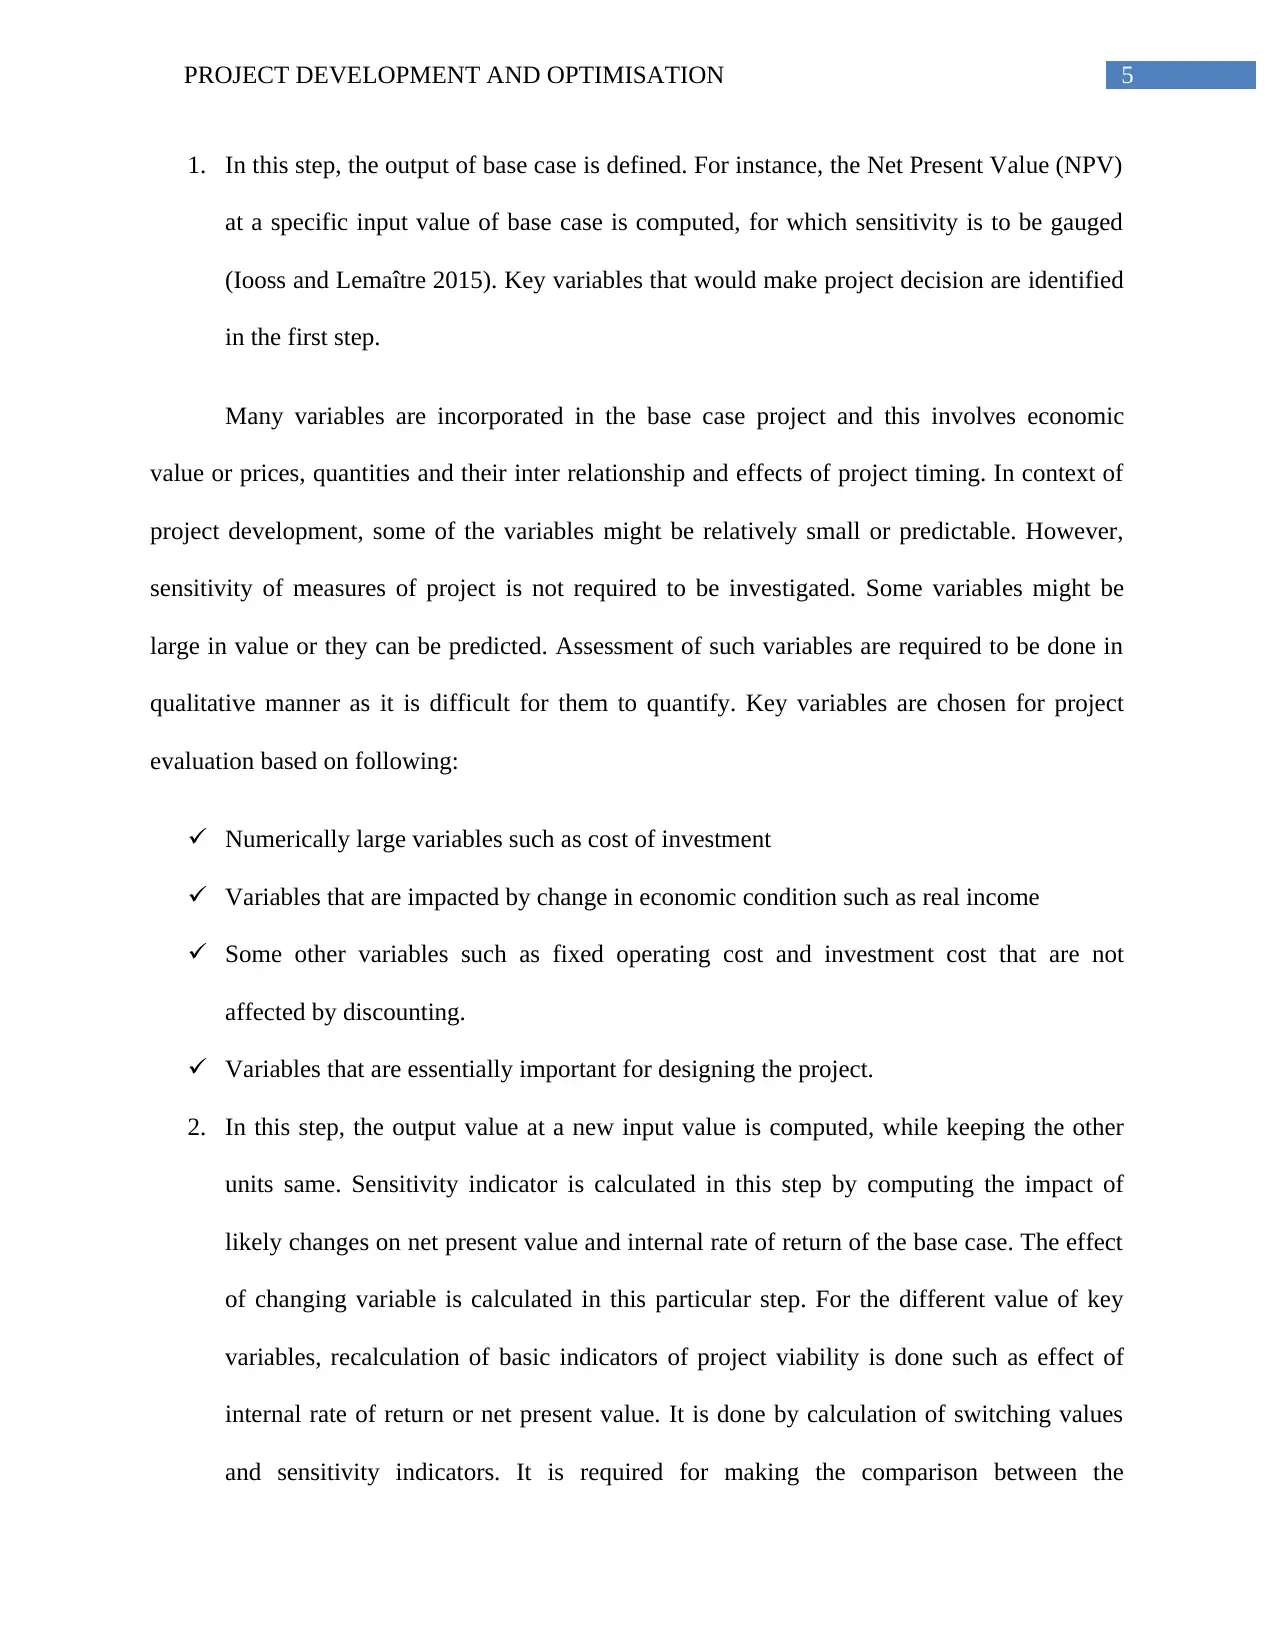
1. In this step, the output of base case is defined. For instance, the Net Present Value (NPV)
at a specific input value of base case is computed, for which sensitivity is to be gauged
(Iooss and Lemaître 2015). Key variables that would make project decision are identified
in the first step.
Many variables are incorporated in the base case project and this involves economic
value or prices, quantities and their inter relationship and effects of project timing. In context of
project development, some of the variables might be relatively small or predictable. However,
sensitivity of measures of project is not required to be investigated. Some variables might be
large in value or they can be predicted. Assessment of such variables are required to be done in
qualitative manner as it is difficult for them to quantify. Key variables are chosen for project
evaluation based on following:
Numerically large variables such as cost of investment
Variables that are impacted by change in economic condition such as real income
Some other variables such as fixed operating cost and investment cost that are not
affected by discounting.
Variables that are essentially important for designing the project.
2. In this step, the output value at a new input value is computed, while keeping the other
units same. Sensitivity indicator is calculated in this step by computing the impact of
likely changes on net present value and internal rate of return of the base case. The effect
of changing variable is calculated in this particular step. For the different value of key
variables, recalculation of basic indicators of project viability is done such as effect of
internal rate of return or net present value. It is done by calculation of switching values
and sensitivity indicators. It is required for making the comparison between the
⊘ This is a preview!⊘
Do you want full access?
Subscribe today to unlock all pages.
Trusted by 1+ million students worldwide
6PROJECT DEVELOPMENT AND OPTIMISATION
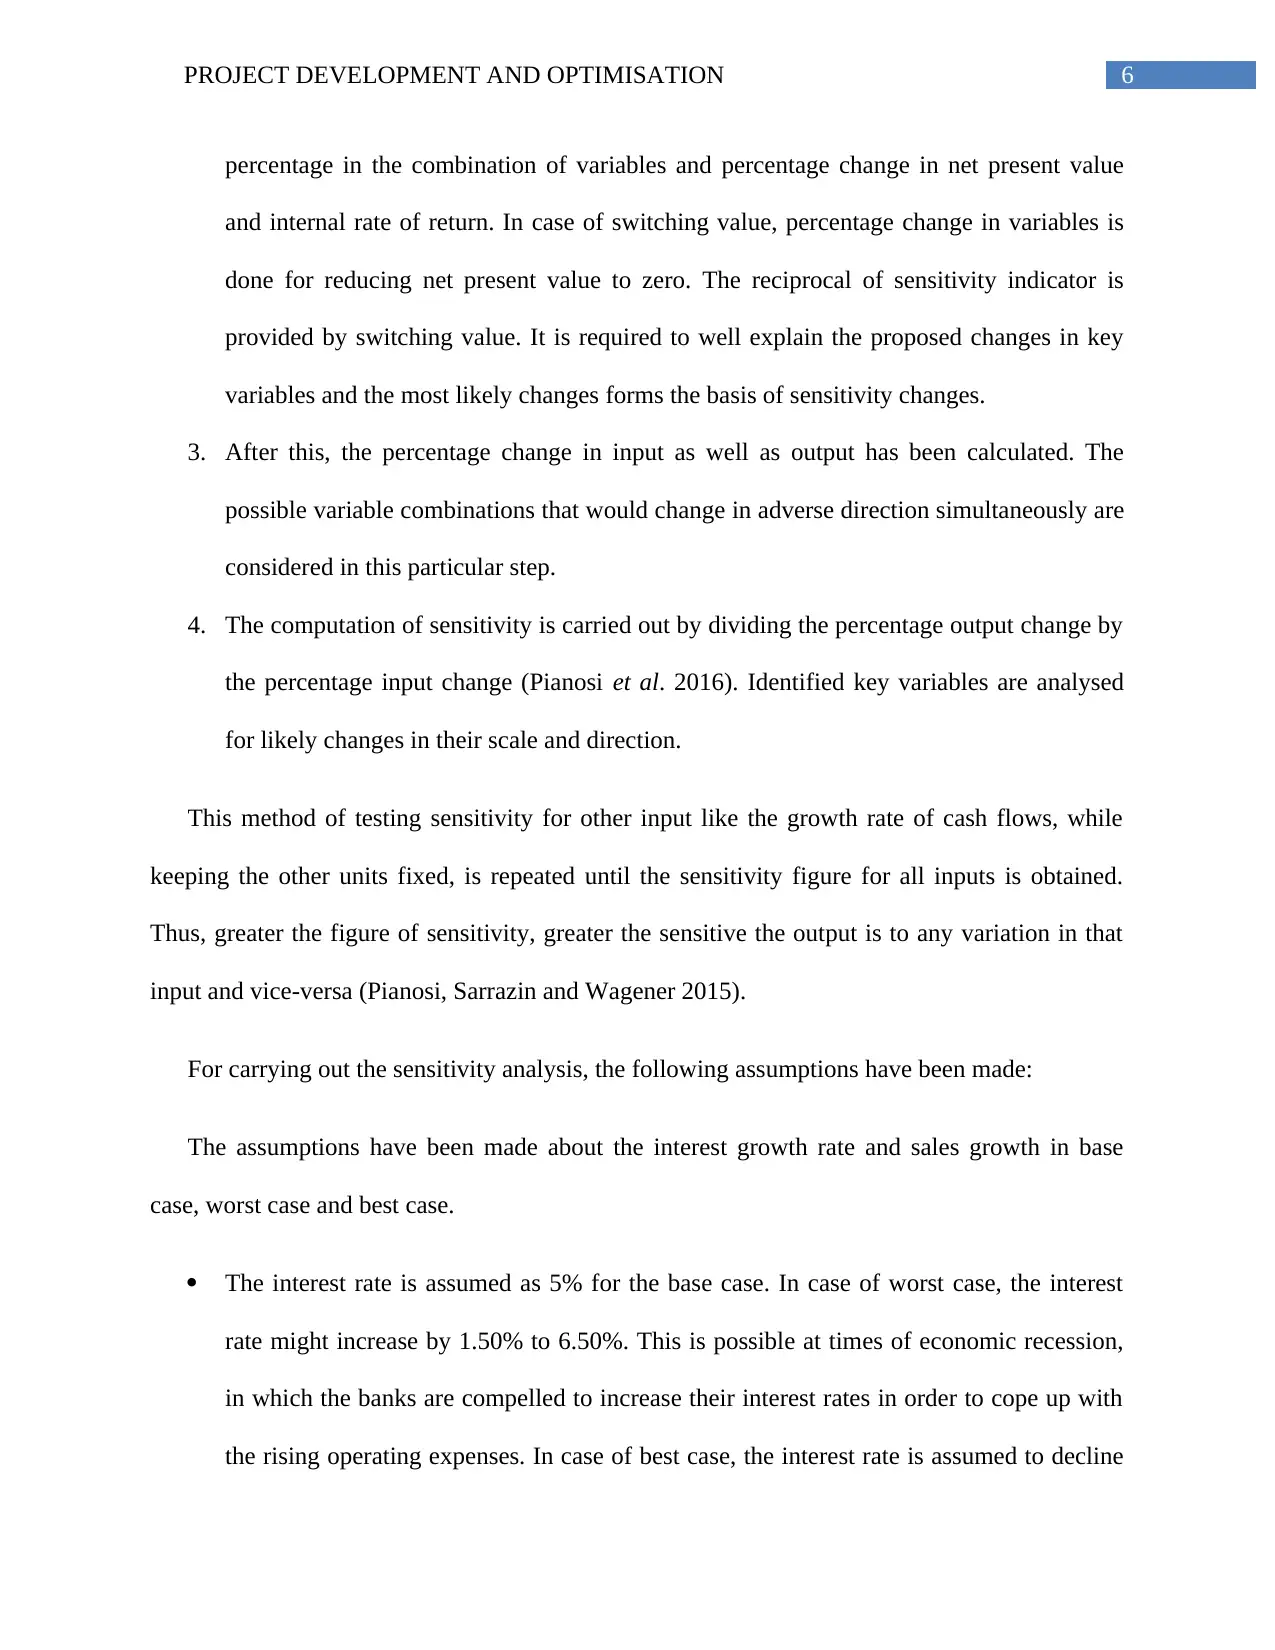
percentage in the combination of variables and percentage change in net present value
and internal rate of return. In case of switching value, percentage change in variables is
done for reducing net present value to zero. The reciprocal of sensitivity indicator is
provided by switching value. It is required to well explain the proposed changes in key
variables and the most likely changes forms the basis of sensitivity changes.
3. After this, the percentage change in input as well as output has been calculated. The
possible variable combinations that would change in adverse direction simultaneously are
considered in this particular step.
4. The computation of sensitivity is carried out by dividing the percentage output change by
the percentage input change (Pianosi et al. 2016). Identified key variables are analysed
for likely changes in their scale and direction.
This method of testing sensitivity for other input like the growth rate of cash flows, while
keeping the other units fixed, is repeated until the sensitivity figure for all inputs is obtained.
Thus, greater the figure of sensitivity, greater the sensitive the output is to any variation in that
input and vice-versa (Pianosi, Sarrazin and Wagener 2015).
For carrying out the sensitivity analysis, the following assumptions have been made:
The assumptions have been made about the interest growth rate and sales growth in base
case, worst case and best case.
The interest rate is assumed as 5% for the base case. In case of worst case, the interest
rate might increase by 1.50% to 6.50%. This is possible at times of economic recession,
in which the banks are compelled to increase their interest rates in order to cope up with
the rising operating expenses. In case of best case, the interest rate is assumed to decline
Paraphrase This Document
Need a fresh take? Get an instant paraphrase of this document with our AI Paraphraser
7PROJECT DEVELOPMENT AND OPTIMISATION
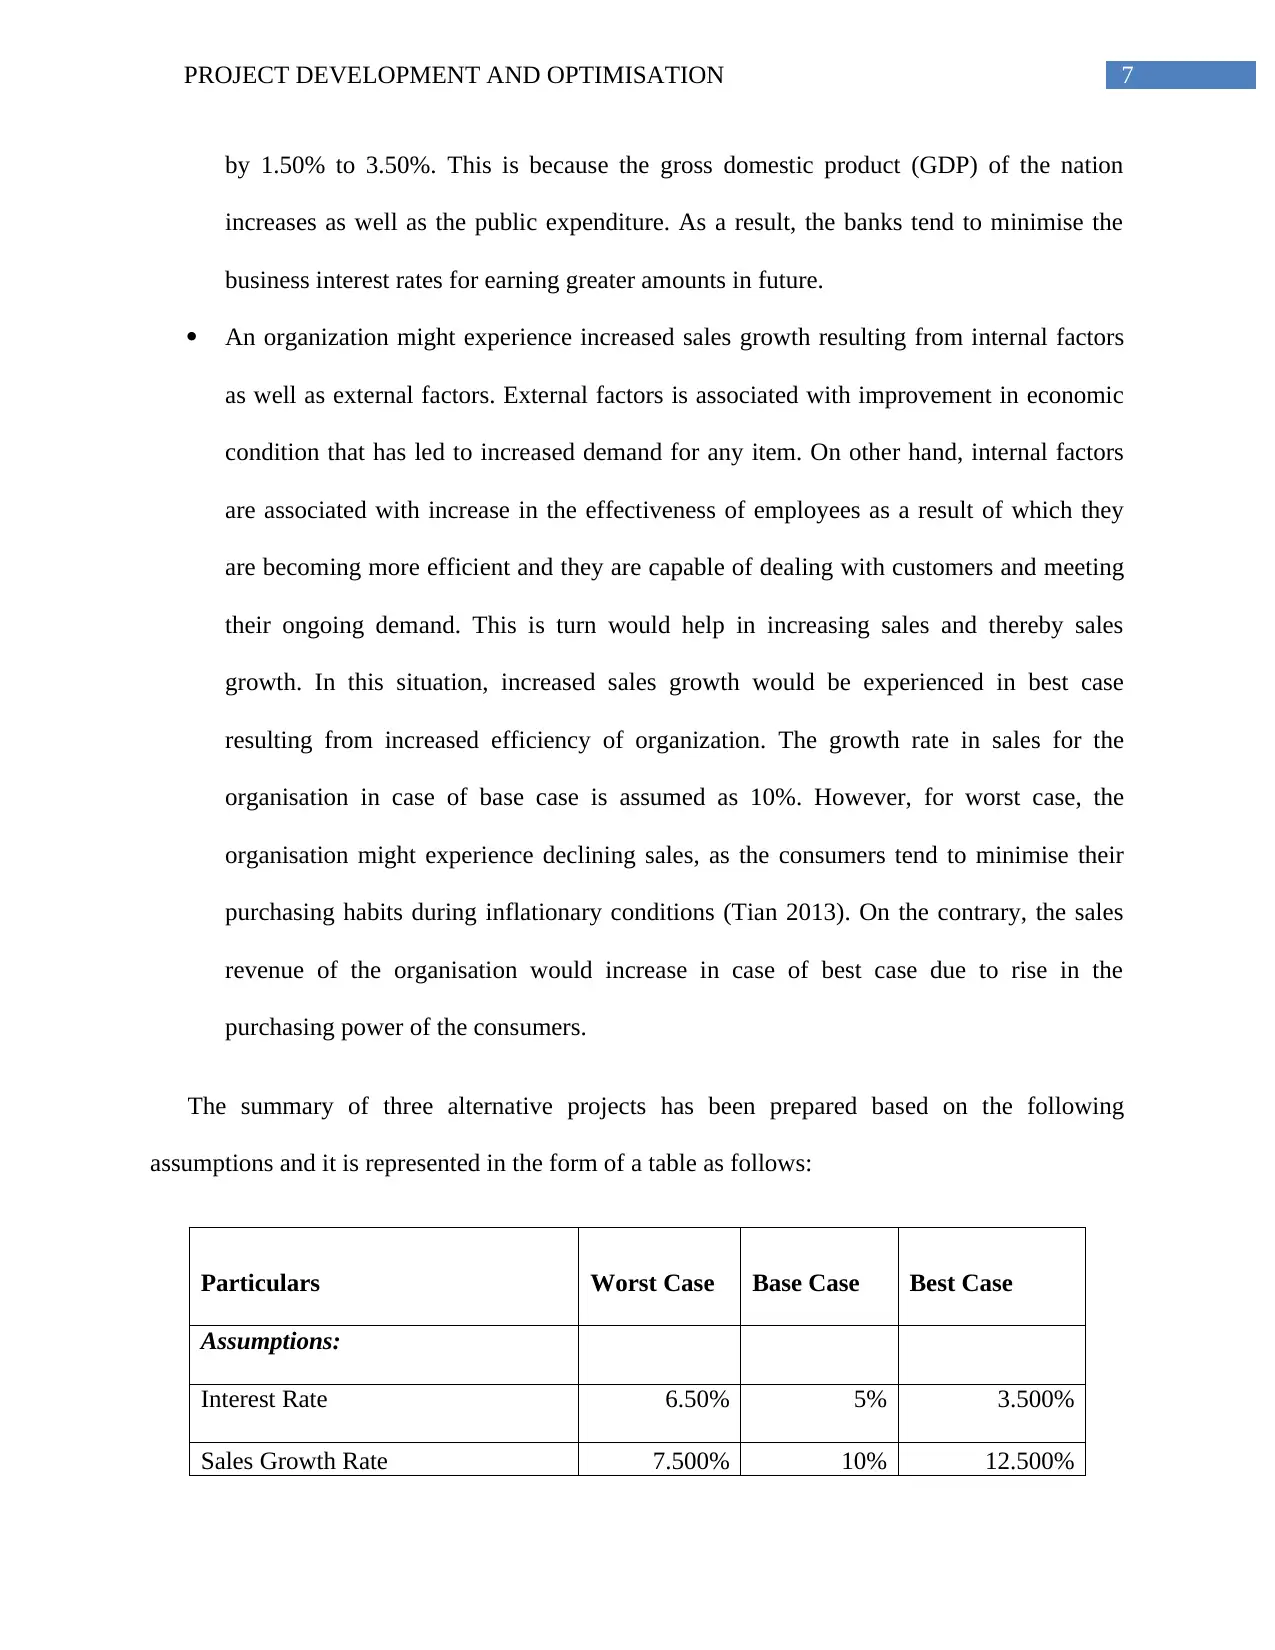
by 1.50% to 3.50%. This is because the gross domestic product (GDP) of the nation
increases as well as the public expenditure. As a result, the banks tend to minimise the
business interest rates for earning greater amounts in future.
An organization might experience increased sales growth resulting from internal factors
as well as external factors. External factors is associated with improvement in economic
condition that has led to increased demand for any item. On other hand, internal factors
are associated with increase in the effectiveness of employees as a result of which they
are becoming more efficient and they are capable of dealing with customers and meeting
their ongoing demand. This is turn would help in increasing sales and thereby sales
growth. In this situation, increased sales growth would be experienced in best case
resulting from increased efficiency of organization. The growth rate in sales for the
organisation in case of base case is assumed as 10%. However, for worst case, the
organisation might experience declining sales, as the consumers tend to minimise their
purchasing habits during inflationary conditions (Tian 2013). On the contrary, the sales
revenue of the organisation would increase in case of best case due to rise in the
purchasing power of the consumers.
The summary of three alternative projects has been prepared based on the following
assumptions and it is represented in the form of a table as follows:
Particulars Worst Case Base Case Best Case
Assumptions:
Interest Rate 6.50% 5% 3.500%
Sales Growth Rate 7.500% 10% 12.500%
8PROJECT DEVELOPMENT AND OPTIMISATION
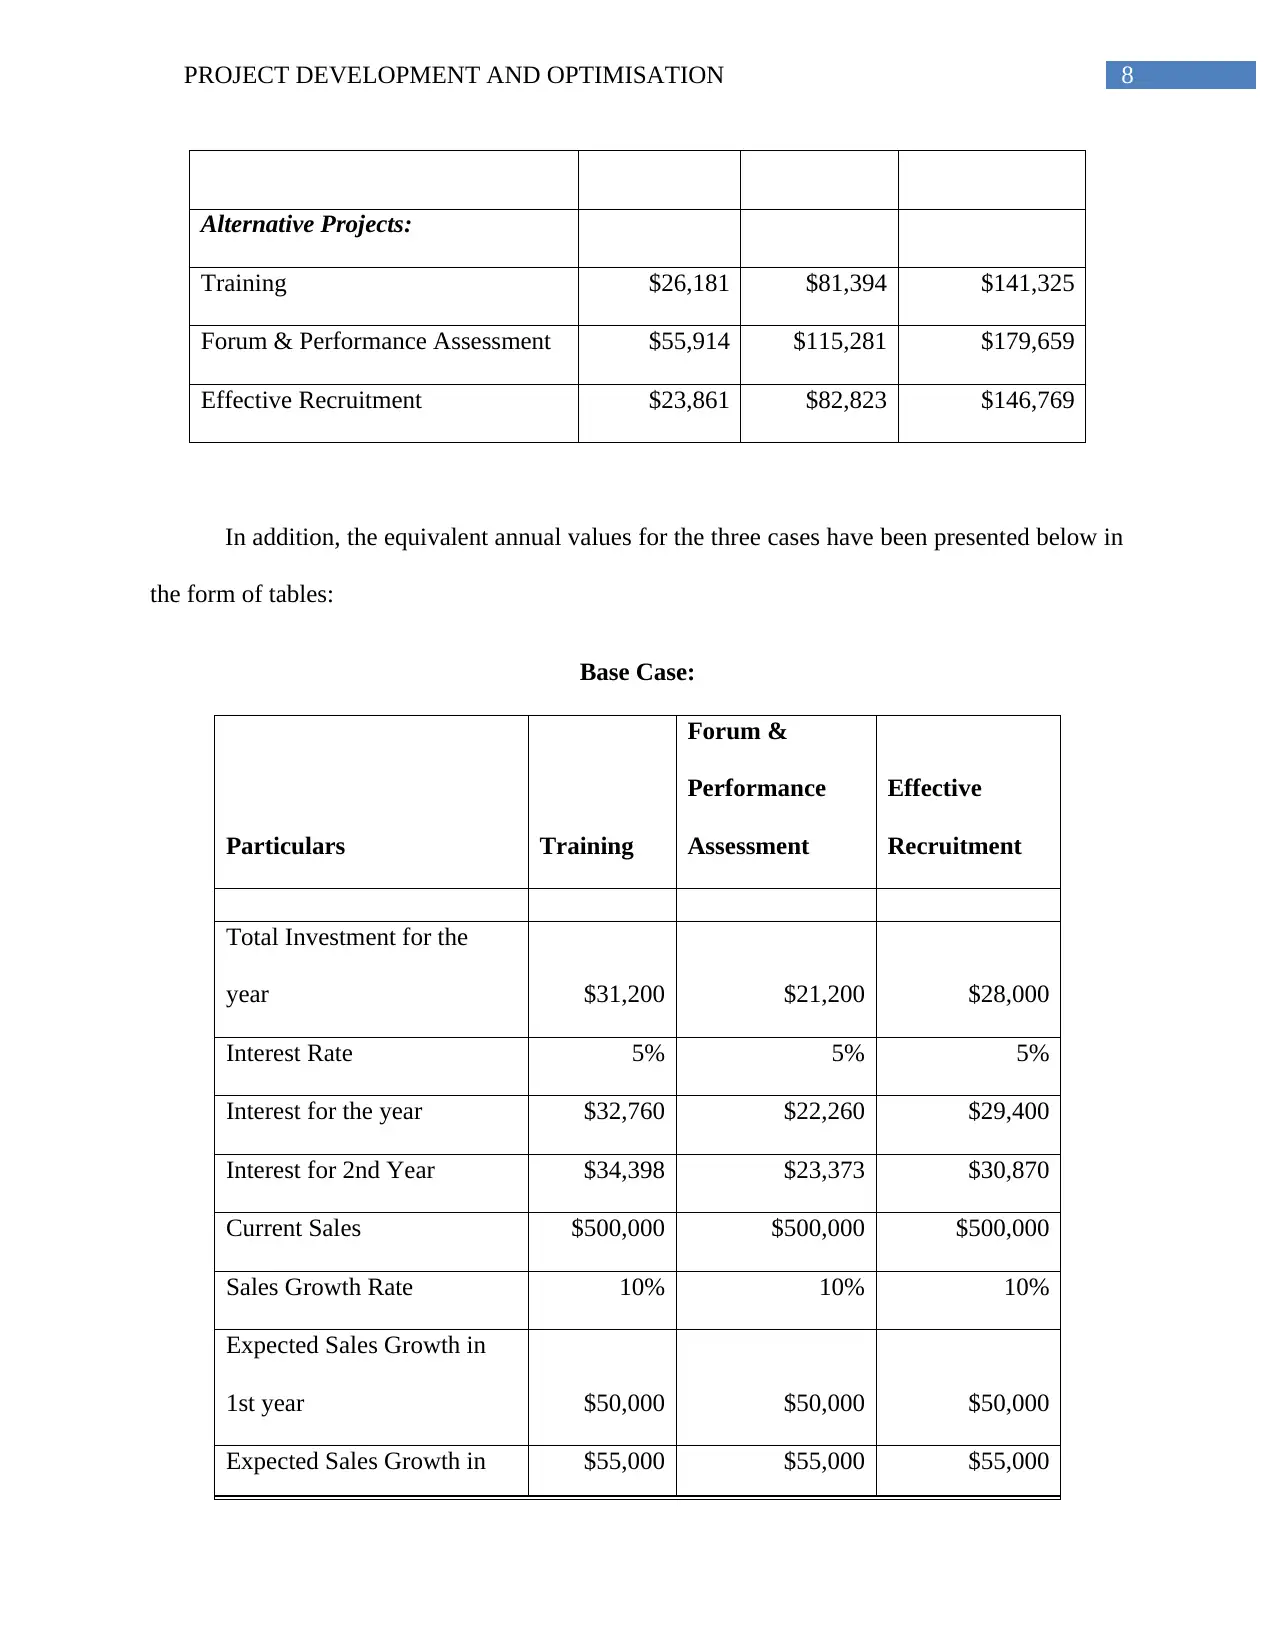
Alternative Projects:
Training $26,181 $81,394 $141,325
Forum & Performance Assessment $55,914 $115,281 $179,659
Effective Recruitment $23,861 $82,823 $146,769
In addition, the equivalent annual values for the three cases have been presented below in
the form of tables:
Base Case:
Particulars Training
Forum &
Performance
Assessment
Effective
Recruitment
Total Investment for the
year $31,200 $21,200 $28,000
Interest Rate 5% 5% 5%
Interest for the year $32,760 $22,260 $29,400
Interest for 2nd Year $34,398 $23,373 $30,870
Current Sales $500,000 $500,000 $500,000
Sales Growth Rate 10% 10% 10%
Expected Sales Growth in
1st year $50,000 $50,000 $50,000
Expected Sales Growth in $55,000 $55,000 $55,000
⊘ This is a preview!⊘
Do you want full access?
Subscribe today to unlock all pages.
Trusted by 1+ million students worldwide
9PROJECT DEVELOPMENT AND OPTIMISATION
2nd year
Net Benefit in 1st year $18,800 $26,627 $19,130
PV of Net Benefit after 1st
yr. $17,905 $25,359 $18,219
PV of Net Benefit after 2nd
yr. $17,052 $24,151 $17,351
PV of Net Benefit after 3rd
yr. $16,240 $23,001 $16,525
PV of Net Benefit after 4th
yr. $15,467 $21,906 $15,738
PV of Net Benefit after 5th
yr. $14,730 $20,863 $14,989
Total PV of Net Benefit $81,394 $115,281 $82,823
Capital Recovery Factor 1.0000257 1.0000257 1.0000257
Equivalent Annual Value $81,396.25 $115,283.94 $82,825.02
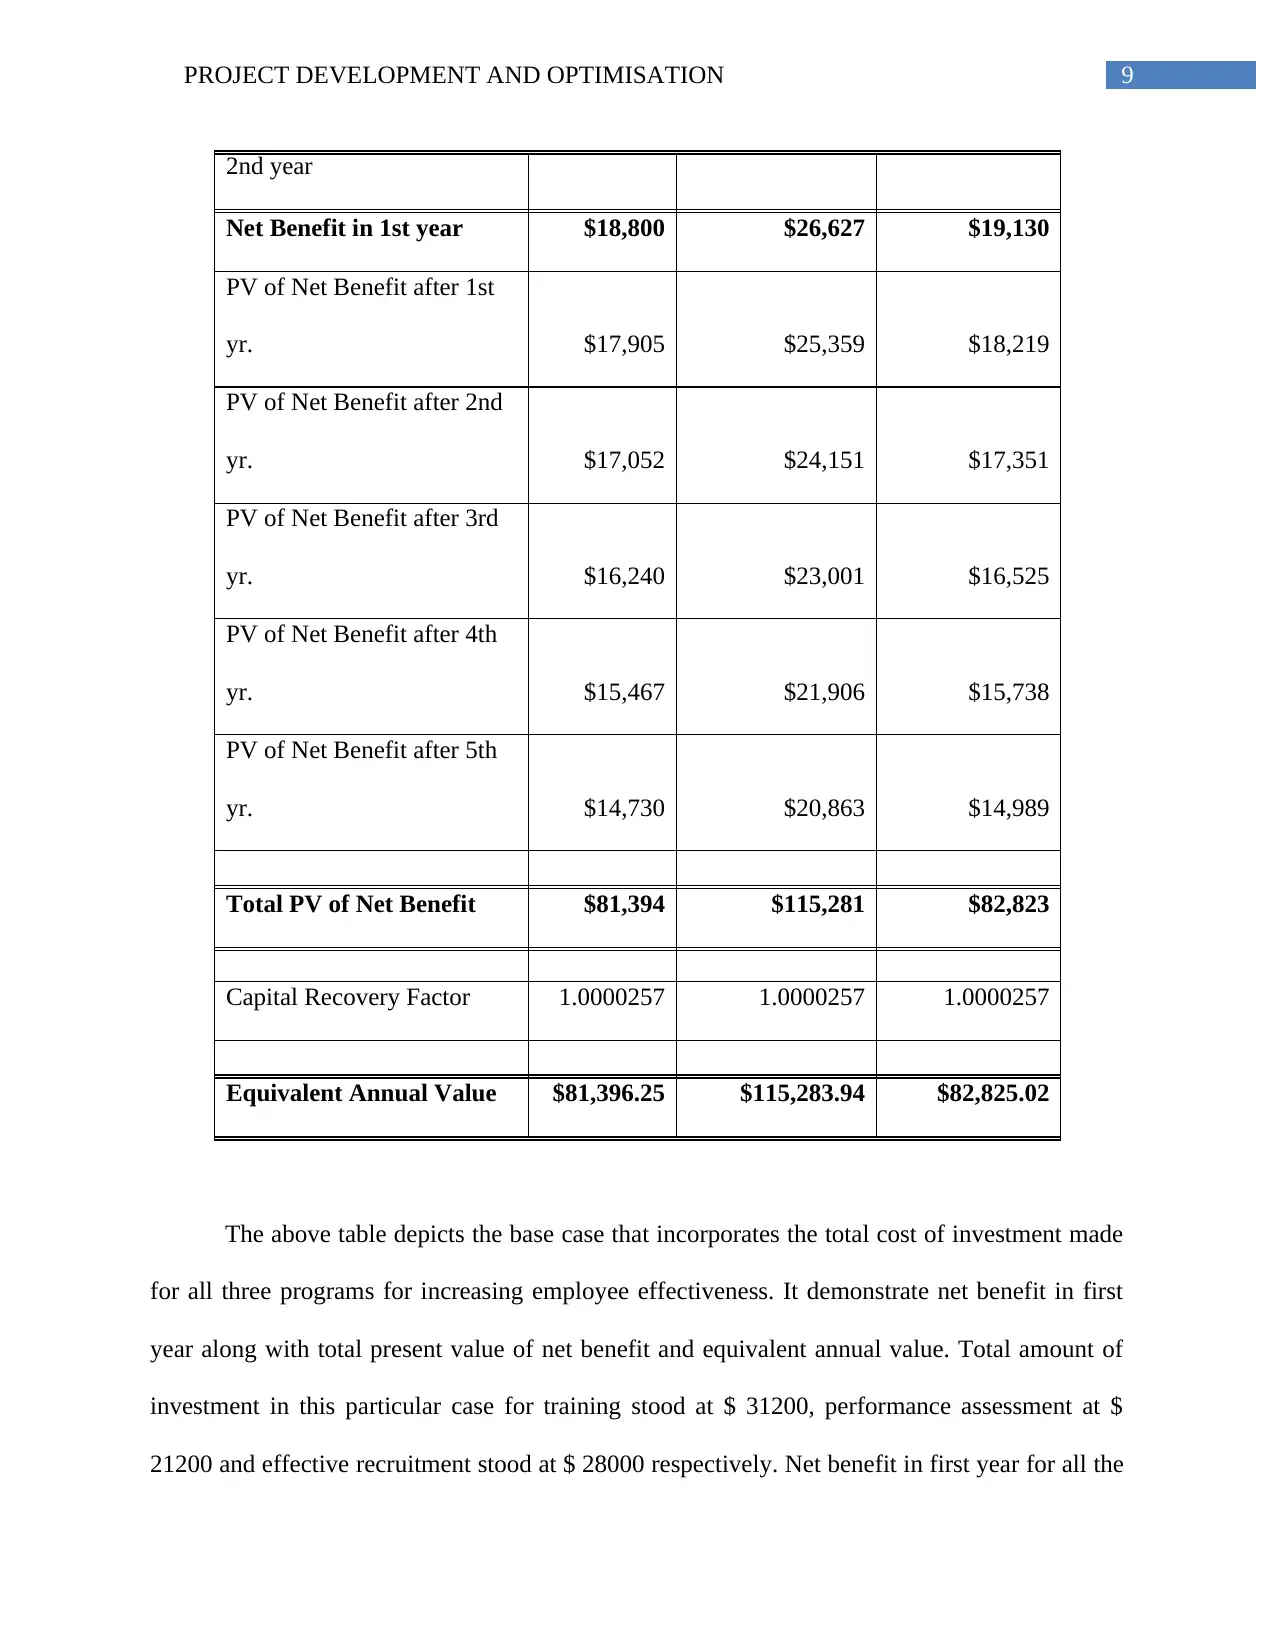
The above table depicts the base case that incorporates the total cost of investment made
for all three programs for increasing employee effectiveness. It demonstrate net benefit in first
year along with total present value of net benefit and equivalent annual value. Total amount of
investment in this particular case for training stood at $ 31200, performance assessment at $
21200 and effective recruitment stood at $ 28000 respectively. Net benefit in first year for all the
2nd year
Net Benefit in 1st year $18,800 $26,627 $19,130
PV of Net Benefit after 1st
yr. $17,905 $25,359 $18,219
PV of Net Benefit after 2nd
yr. $17,052 $24,151 $17,351
PV of Net Benefit after 3rd
yr. $16,240 $23,001 $16,525
PV of Net Benefit after 4th
yr. $15,467 $21,906 $15,738
PV of Net Benefit after 5th
yr. $14,730 $20,863 $14,989
Total PV of Net Benefit $81,394 $115,281 $82,823
Capital Recovery Factor 1.0000257 1.0000257 1.0000257
Equivalent Annual Value $81,396.25 $115,283.94 $82,825.02
The above table depicts the base case that incorporates the total cost of investment made
for all three programs for increasing employee effectiveness. It demonstrate net benefit in first
year along with total present value of net benefit and equivalent annual value. Total amount of
investment in this particular case for training stood at $ 31200, performance assessment at $
21200 and effective recruitment stood at $ 28000 respectively. Net benefit in first year for all the
Paraphrase This Document
Need a fresh take? Get an instant paraphrase of this document with our AI Paraphraser
10PROJECT DEVELOPMENT AND OPTIMISATION
three programs stood at $ 18800, $ 26627 and $ 19130 respectively. Net benefit derived from
performance assessment is comparatively higher than effective recruitment and training. Total
present value of net benefits for all three programs stood at $ 81394, $ 115281 and $ 82823
respectively. Lowest equivalent annual value is generated from project of undertaking training
for improving employee effectiveness. From the above analysis of figures, it is concluded that
present value of net benefits of third program that is performance assessment is higher as against
other programs.
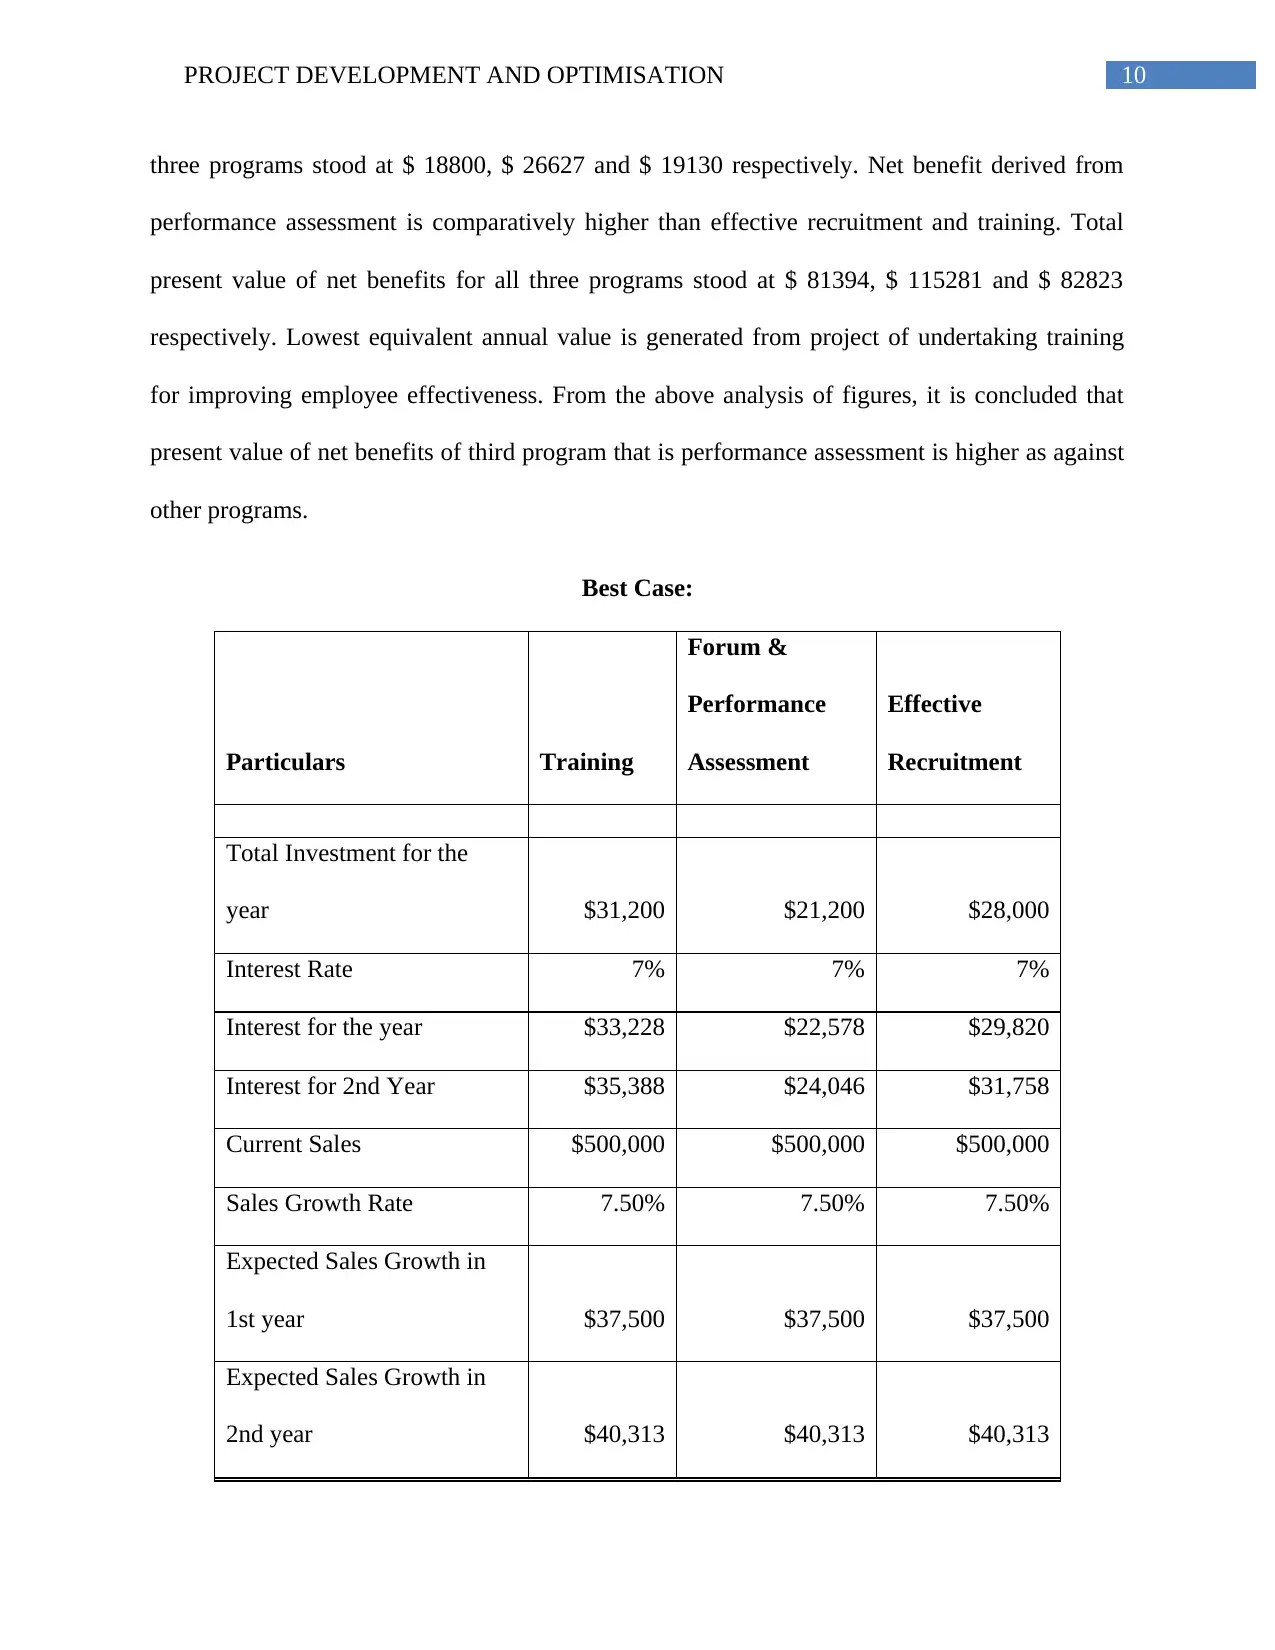
Best Case:
Particulars Training
Forum &
Performance
Assessment
Effective
Recruitment
Total Investment for the
year $31,200 $21,200 $28,000
Interest Rate 7% 7% 7%
Interest for the year $33,228 $22,578 $29,820
Interest for 2nd Year $35,388 $24,046 $31,758
Current Sales $500,000 $500,000 $500,000
Sales Growth Rate 7.50% 7.50% 7.50%
Expected Sales Growth in
1st year $37,500 $37,500 $37,500
Expected Sales Growth in
2nd year $40,313 $40,313 $40,313
three programs stood at $ 18800, $ 26627 and $ 19130 respectively. Net benefit derived from
performance assessment is comparatively higher than effective recruitment and training. Total
present value of net benefits for all three programs stood at $ 81394, $ 115281 and $ 82823
respectively. Lowest equivalent annual value is generated from project of undertaking training
for improving employee effectiveness. From the above analysis of figures, it is concluded that
present value of net benefits of third program that is performance assessment is higher as against
other programs.
Best Case:
Particulars Training
Forum &
Performance
Assessment
Effective
Recruitment
Total Investment for the
year $31,200 $21,200 $28,000
Interest Rate 7% 7% 7%
Interest for the year $33,228 $22,578 $29,820
Interest for 2nd Year $35,388 $24,046 $31,758
Current Sales $500,000 $500,000 $500,000
Sales Growth Rate 7.50% 7.50% 7.50%
Expected Sales Growth in
1st year $37,500 $37,500 $37,500
Expected Sales Growth in
2nd year $40,313 $40,313 $40,313
11PROJECT DEVELOPMENT AND OPTIMISATION
Net Benefit in 1st year $6,300 $13,454 $5,742
PV of Net Benefit after 1st
yr. $5,915 $12,633 $5,391
PV of Net Benefit after 2nd
yr. $5,554 $11,862 $5,062
PV of Net Benefit after 3rd
yr. $5,215 $11,138 $4,753
PV of Net Benefit after 4th
yr. $4,897 $10,458 $4,463
PV of Net Benefit after 5th
yr. $4,598 $9,820 $4,191
Total PV of Net Benefit $26,181 $55,912 $23,861
Capital Recovery Factor 1.0000257 1.0000257 1.0000257
Equivalent Annual Value $26,181.45 $55,913.74 $23,861.28
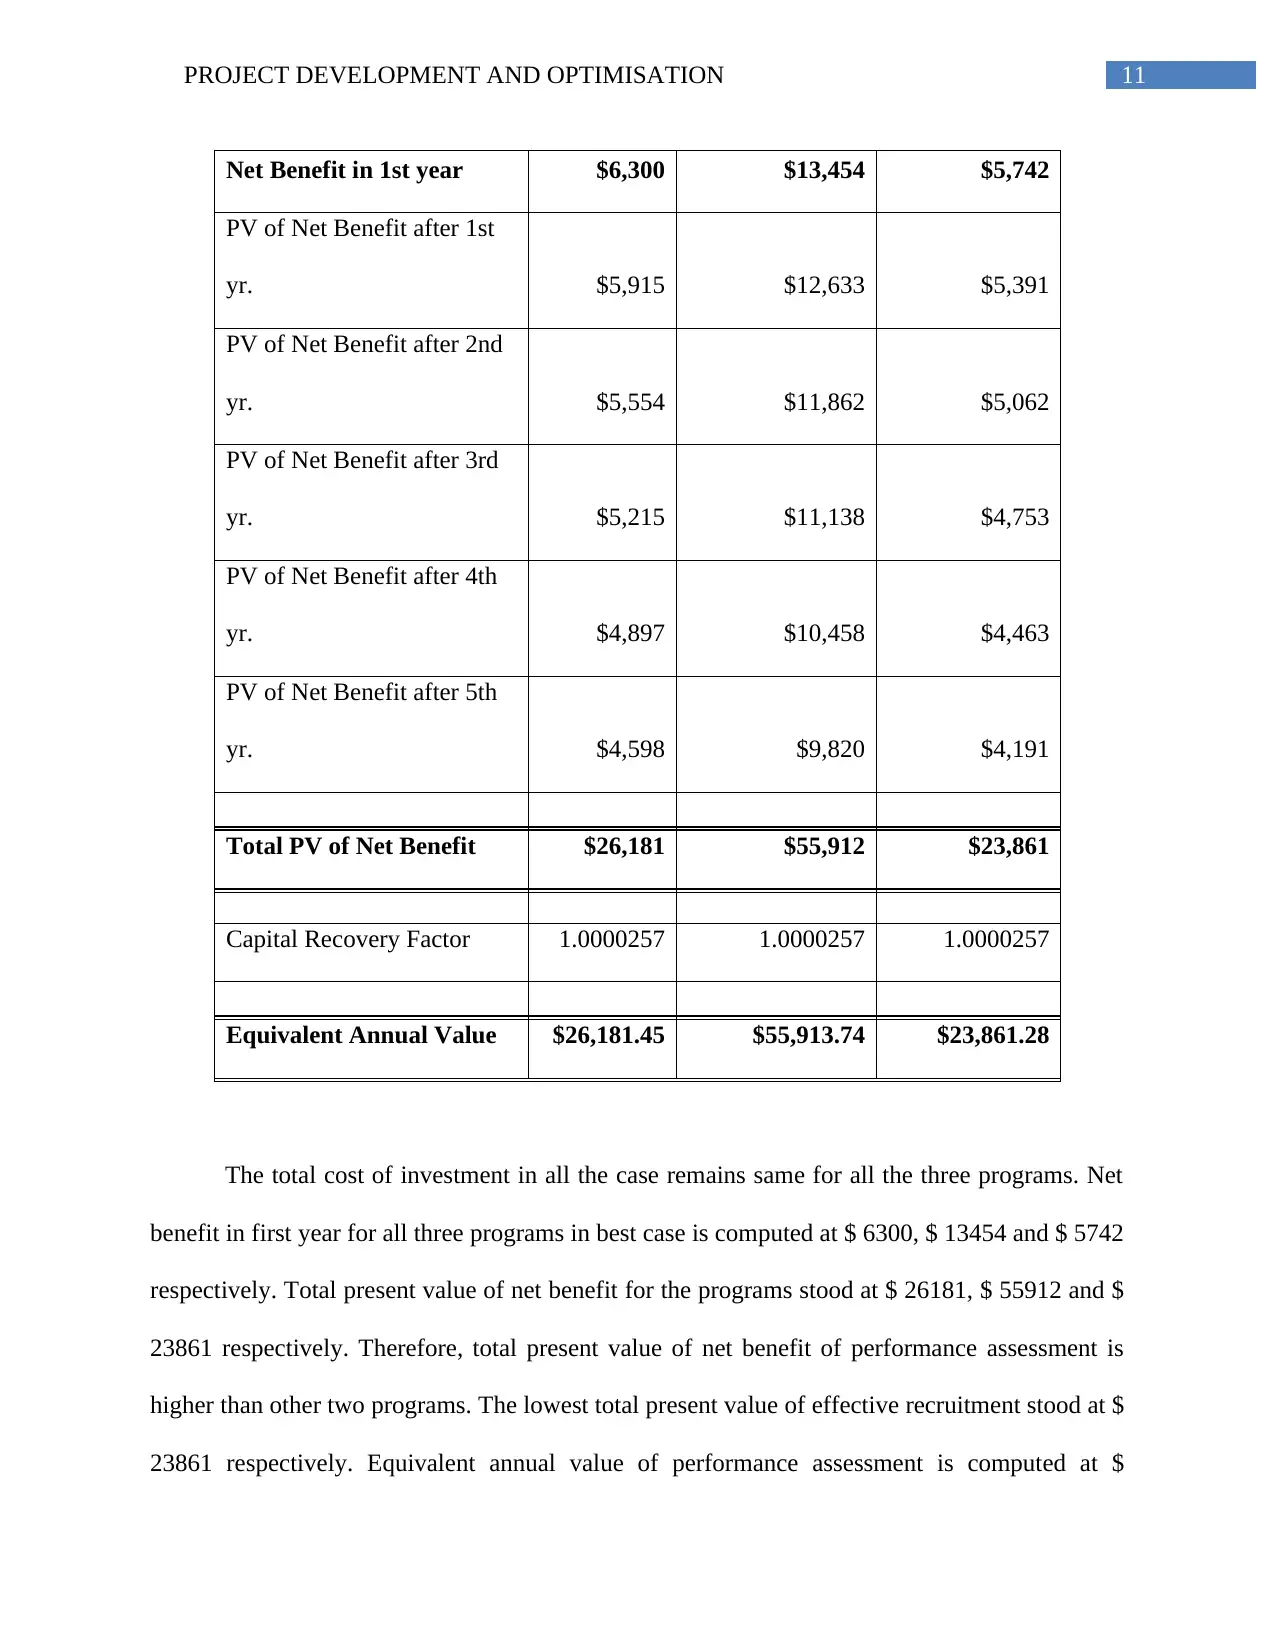
The total cost of investment in all the case remains same for all the three programs. Net
benefit in first year for all three programs in best case is computed at $ 6300, $ 13454 and $ 5742
respectively. Total present value of net benefit for the programs stood at $ 26181, $ 55912 and $
23861 respectively. Therefore, total present value of net benefit of performance assessment is
higher than other two programs. The lowest total present value of effective recruitment stood at $
23861 respectively. Equivalent annual value of performance assessment is computed at $
Net Benefit in 1st year $6,300 $13,454 $5,742
PV of Net Benefit after 1st
yr. $5,915 $12,633 $5,391
PV of Net Benefit after 2nd
yr. $5,554 $11,862 $5,062
PV of Net Benefit after 3rd
yr. $5,215 $11,138 $4,753
PV of Net Benefit after 4th
yr. $4,897 $10,458 $4,463
PV of Net Benefit after 5th
yr. $4,598 $9,820 $4,191
Total PV of Net Benefit $26,181 $55,912 $23,861
Capital Recovery Factor 1.0000257 1.0000257 1.0000257
Equivalent Annual Value $26,181.45 $55,913.74 $23,861.28
The total cost of investment in all the case remains same for all the three programs. Net
benefit in first year for all three programs in best case is computed at $ 6300, $ 13454 and $ 5742
respectively. Total present value of net benefit for the programs stood at $ 26181, $ 55912 and $
23861 respectively. Therefore, total present value of net benefit of performance assessment is
higher than other two programs. The lowest total present value of effective recruitment stood at $
23861 respectively. Equivalent annual value of performance assessment is computed at $
⊘ This is a preview!⊘
Do you want full access?
Subscribe today to unlock all pages.
Trusted by 1+ million students worldwide
1 out of 16
Related Documents


Your All-in-One AI-Powered Toolkit for Academic Success.
+13062052269
info@desklib.com
Available 24*7 on WhatsApp / Email
![[object Object]](/_next/static/media/star-bottom.7253800d.svg)
Unlock your academic potential
Copyright © 2020–2026 A2Z Services. All Rights Reserved. Developed and managed by ZUCOL.