Statistics Assignment: Data Analysis, Forecasting, and Computation
VerifiedAdded on 2023/01/07
|10
|1553
|29
Homework Assignment
AI Summary
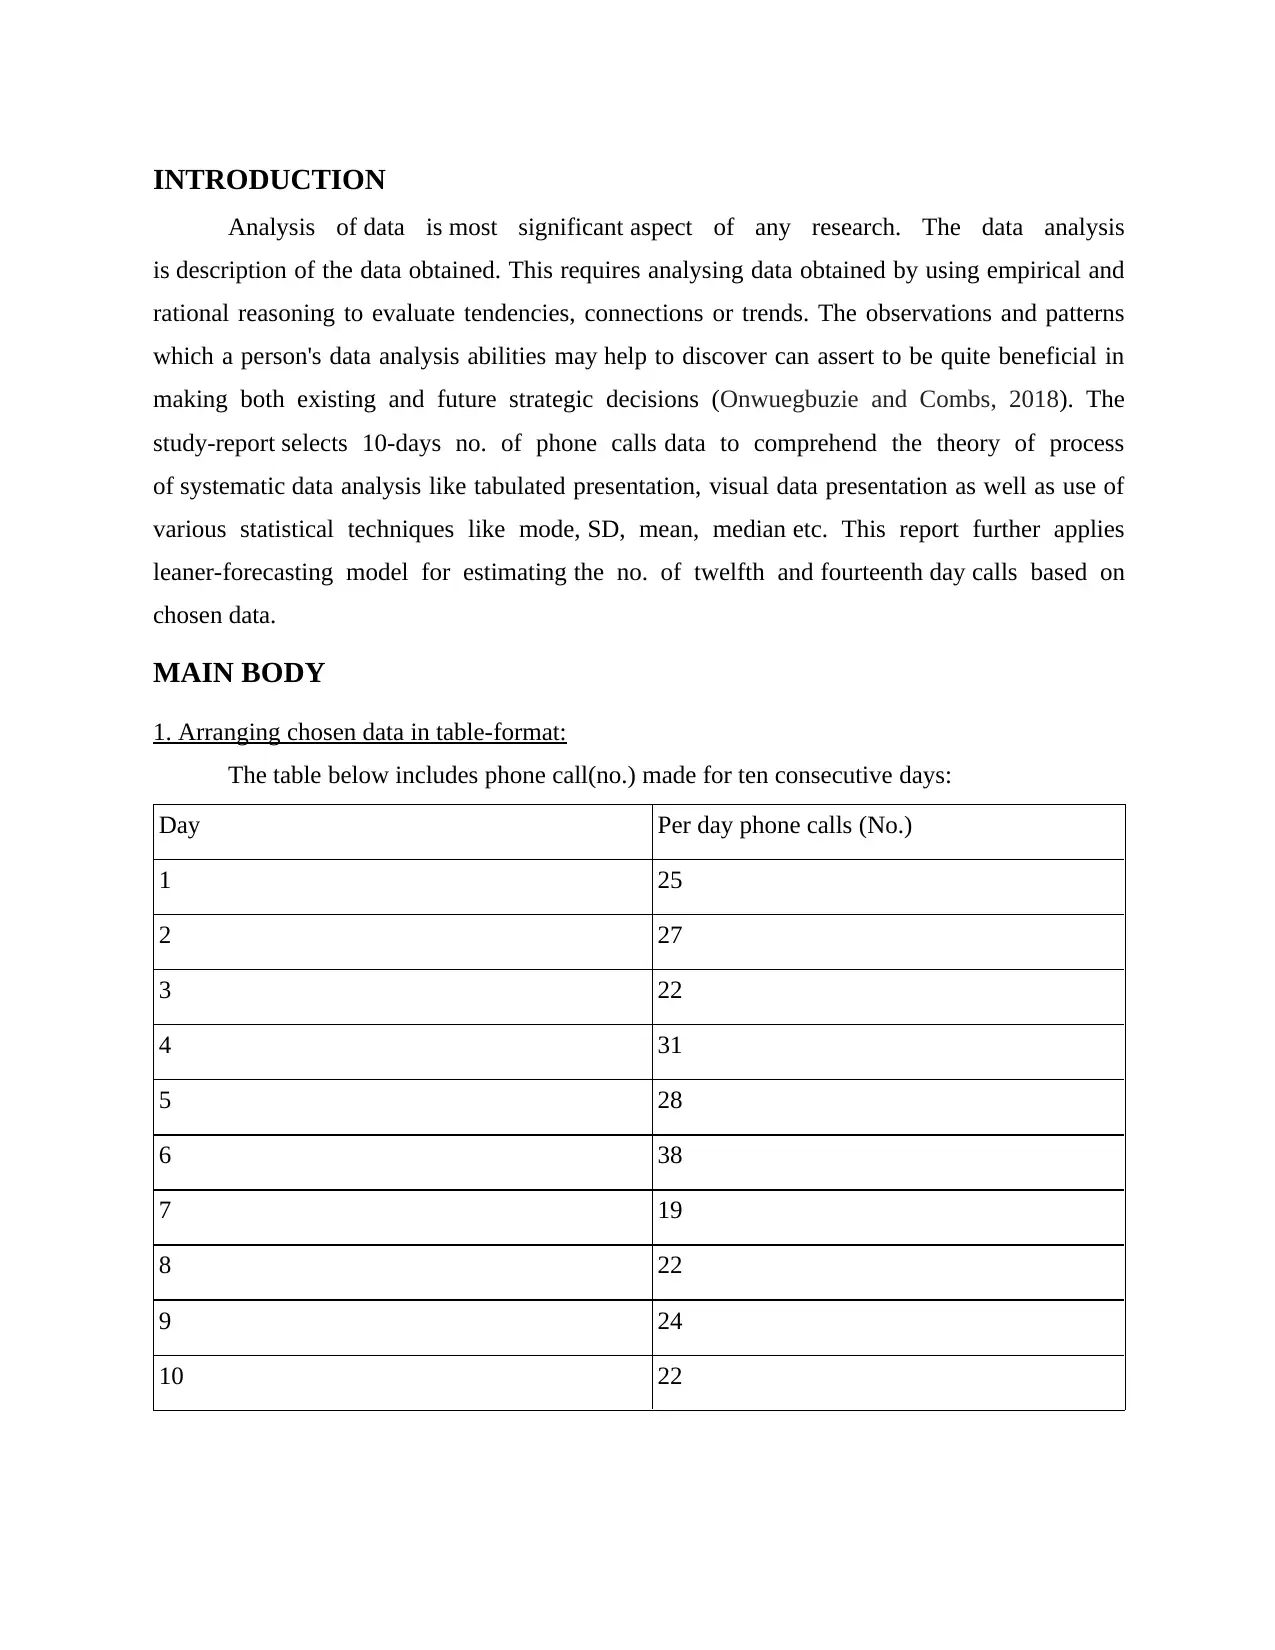
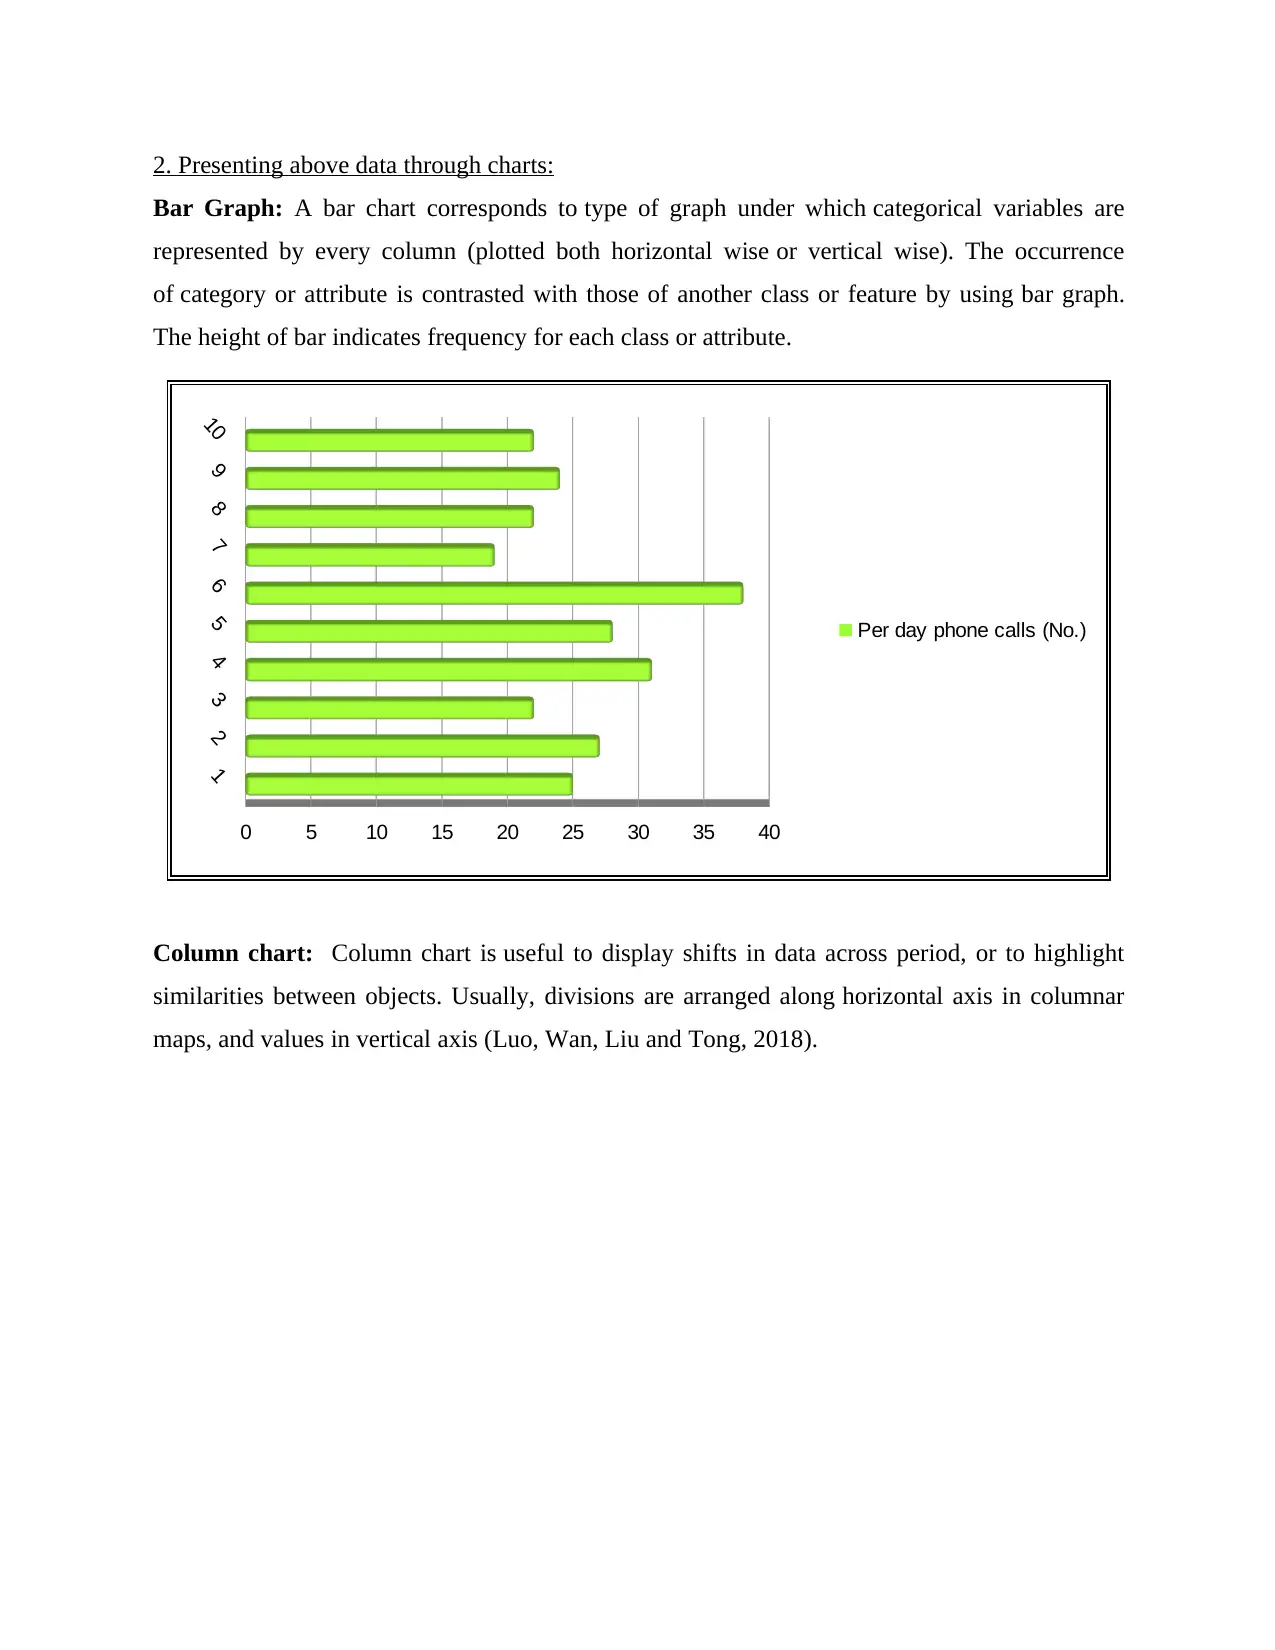
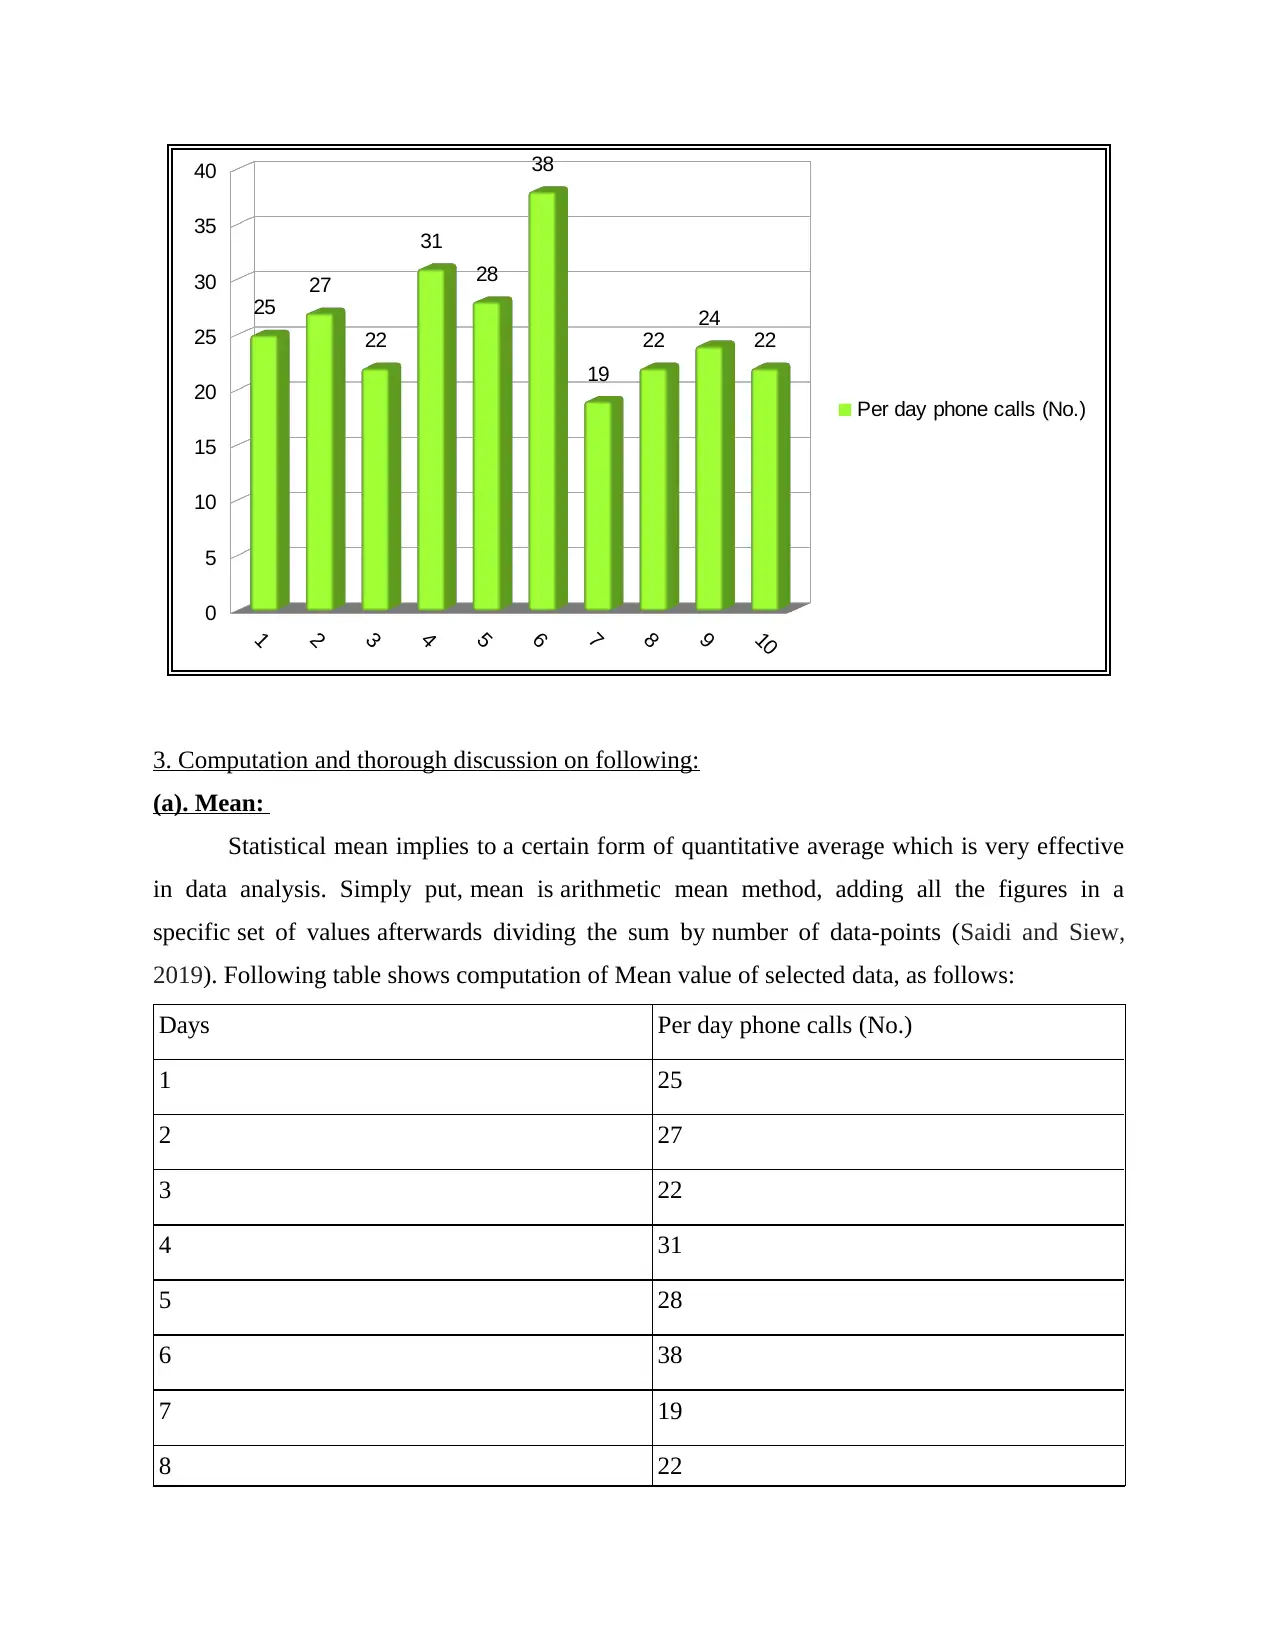
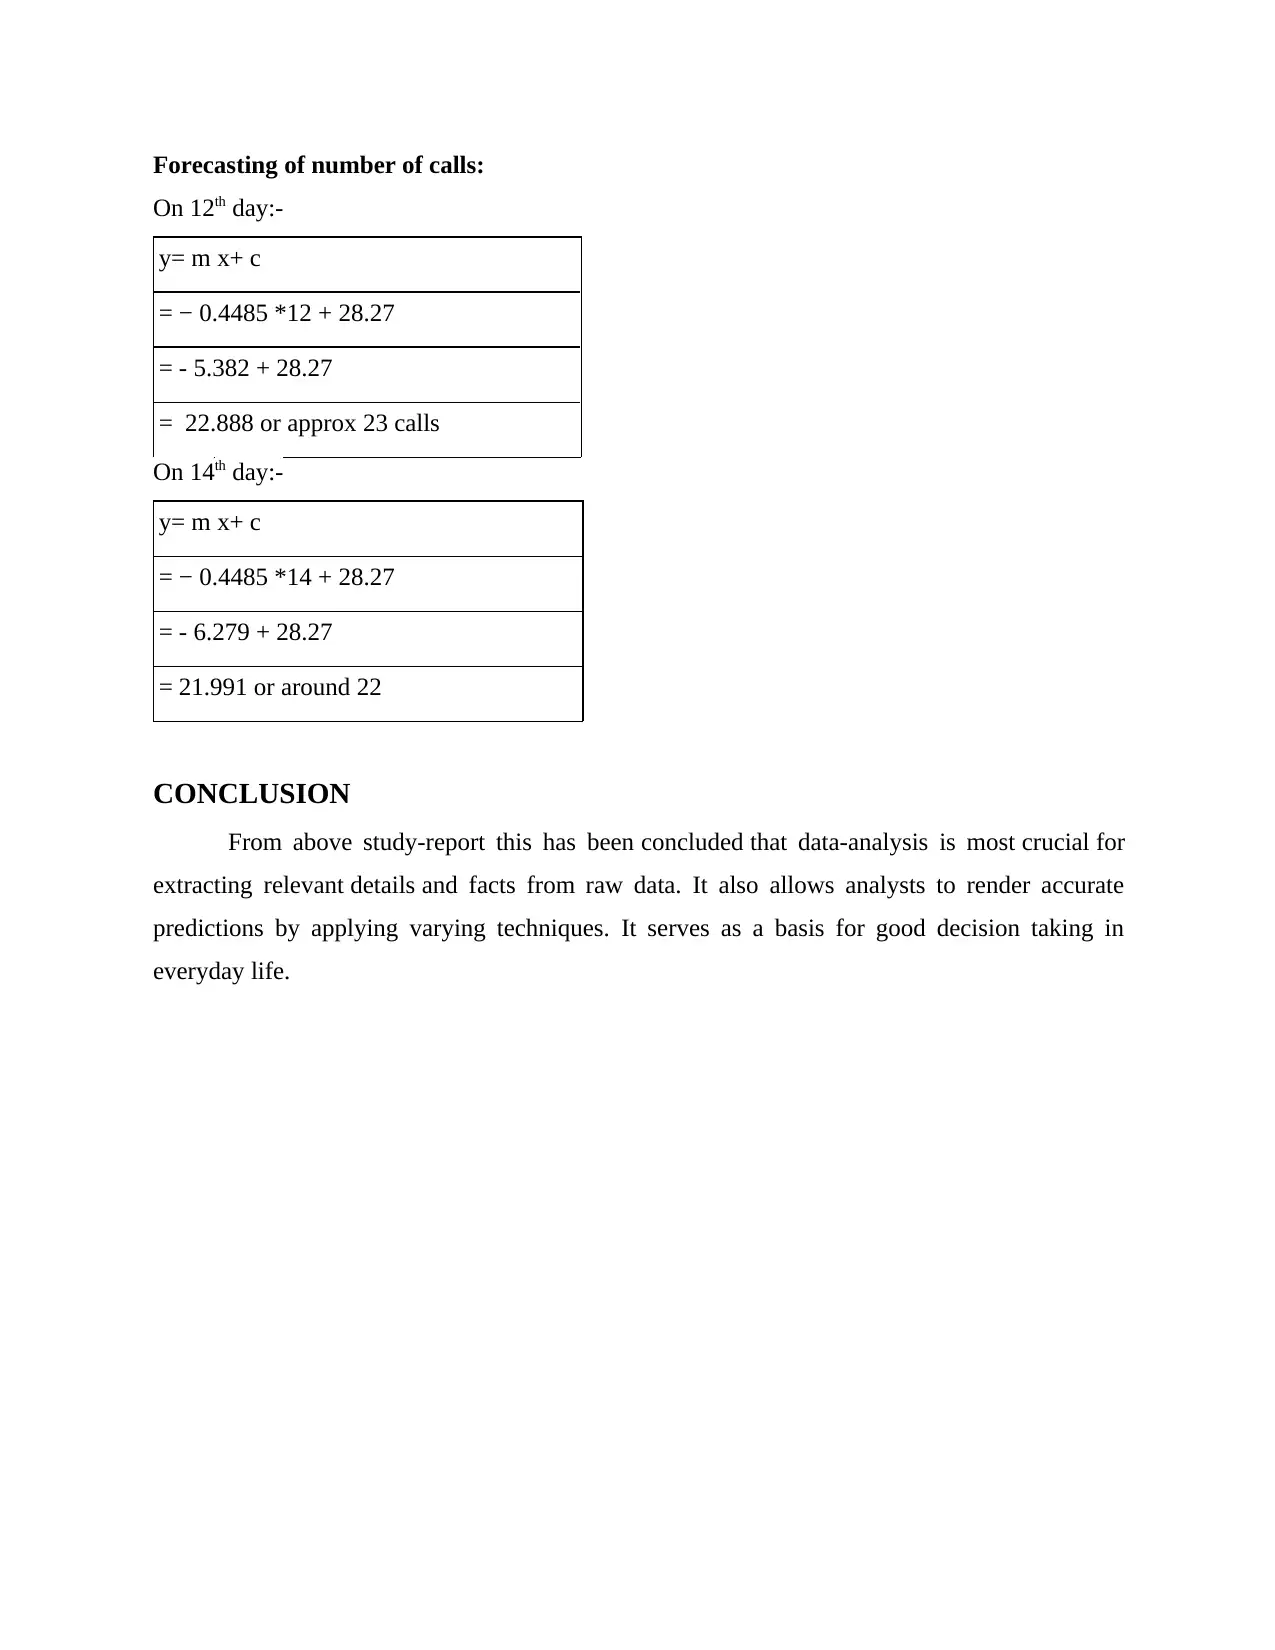
This assignment analyzes a dataset of phone calls over ten days using various statistical techniques. The report begins with arranging the data in a table format and presenting it through bar and column charts. It then computes and discusses the mean, median, mode, range, and standard deviation of the data. The core of the assignment involves using a linear forecasting model (y = mx + c) to predict the number of phone calls on the twelfth and fourteenth days. The calculations for 'm' and 'c' are shown, and the predicted values for the specified days are provided. The conclusion emphasizes the importance of data analysis in extracting insights from raw data and its role in decision-making. The assignment includes references to relevant books and journals.
1 out of 10
Related Documents


Your All-in-One AI-Powered Toolkit for Academic Success.
+13062052269
info@desklib.com
Available 24*7 on WhatsApp / Email
![[object Object]](/_next/static/media/star-bottom.7253800d.svg)
Copyright © 2020–2026 A2Z Services. All Rights Reserved. Developed and managed by ZUCOL.