Detailed Analysis and Project Report on Cost and Control Job Costing

Verified

Added on  2020/04/01

|17
|1831
|37
Project
AI Summary
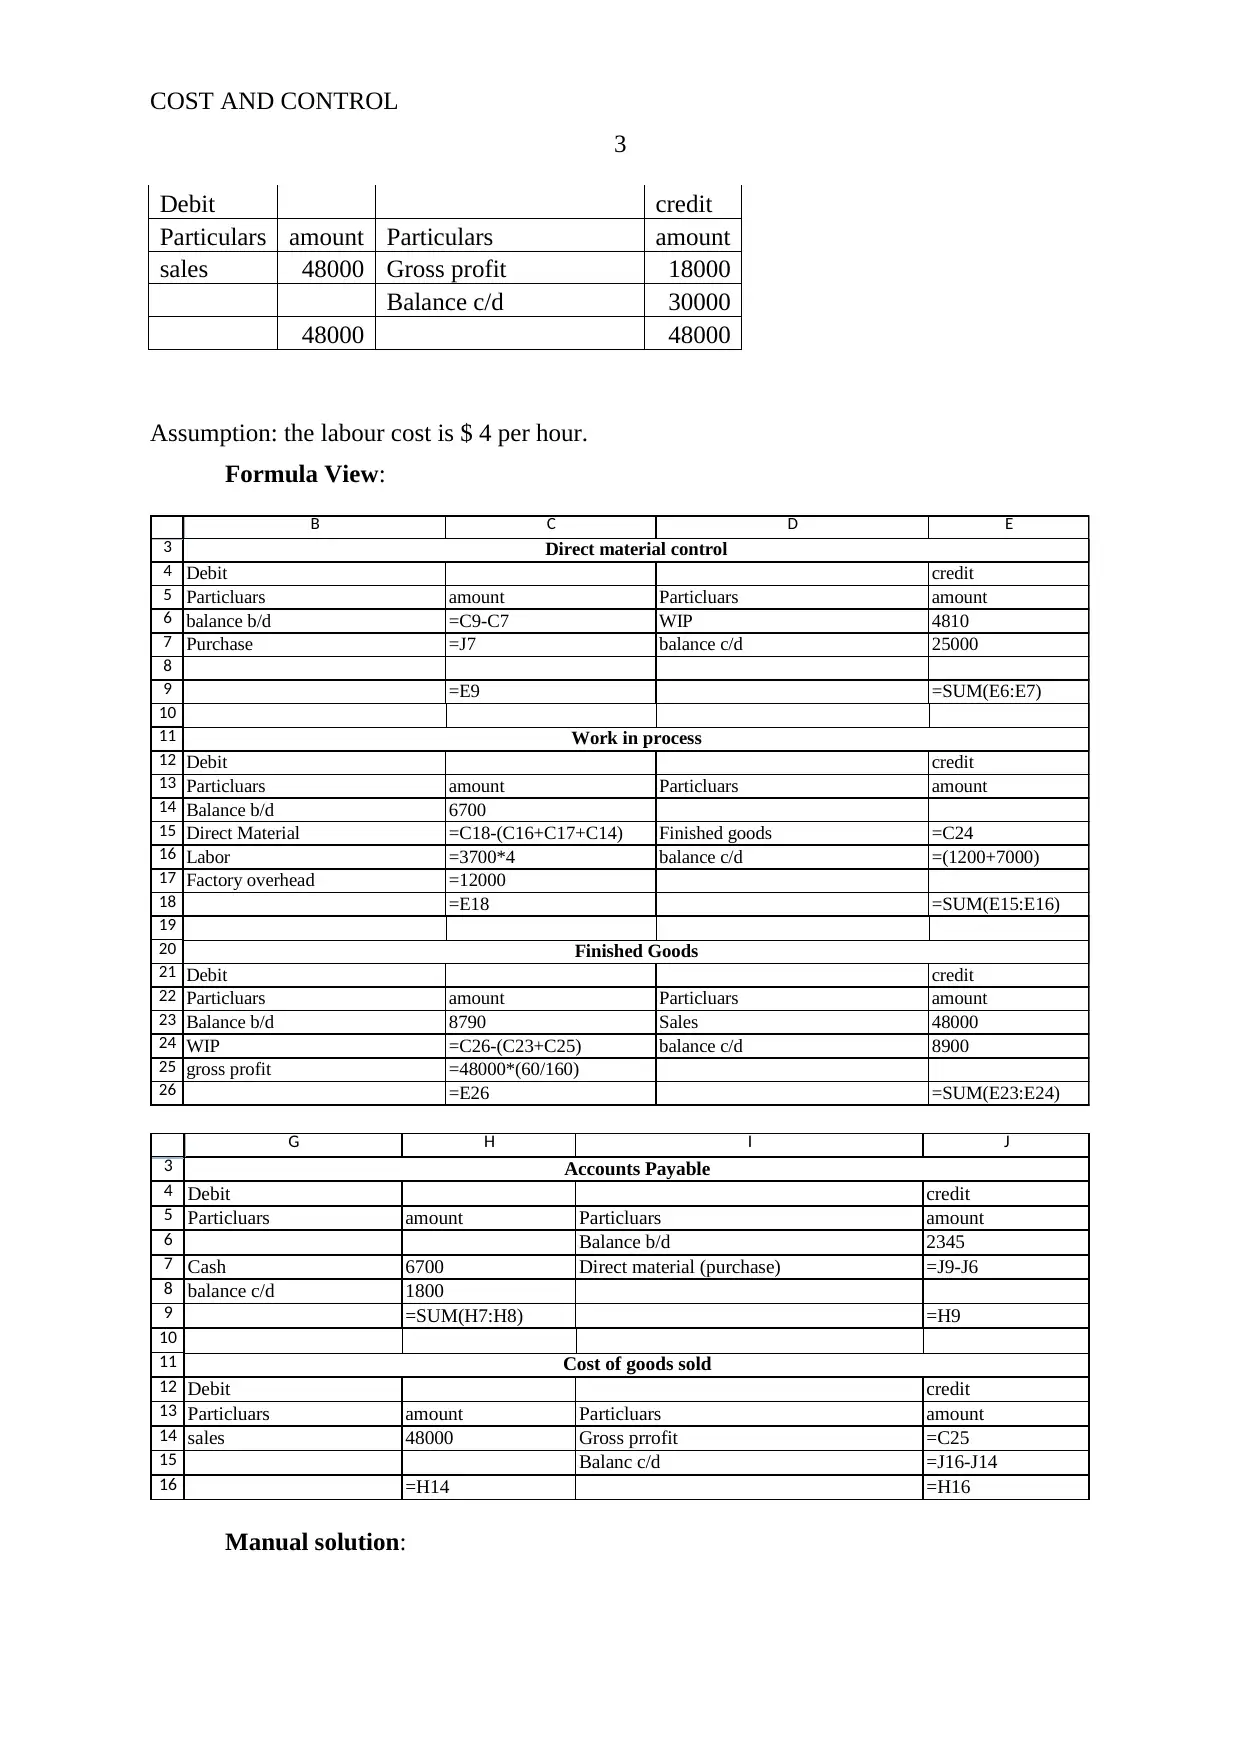
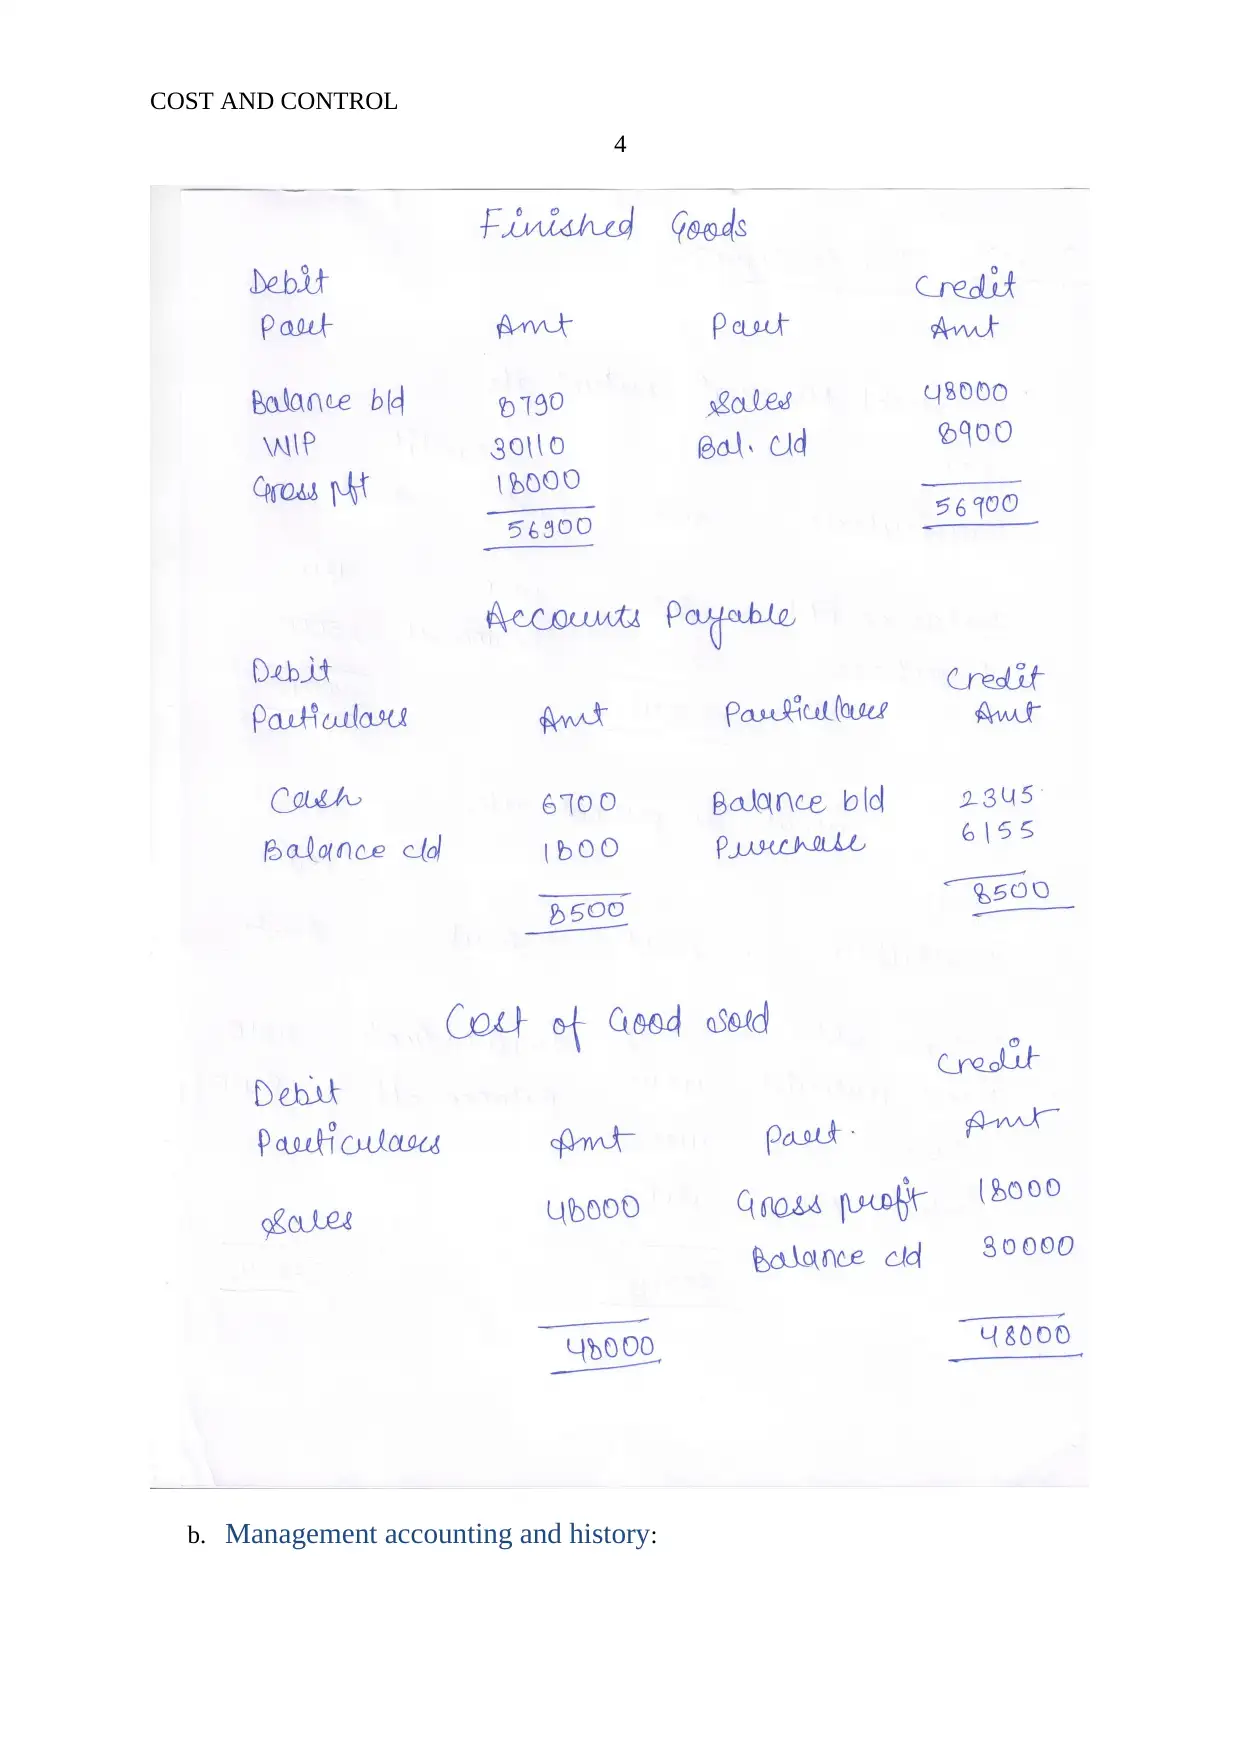
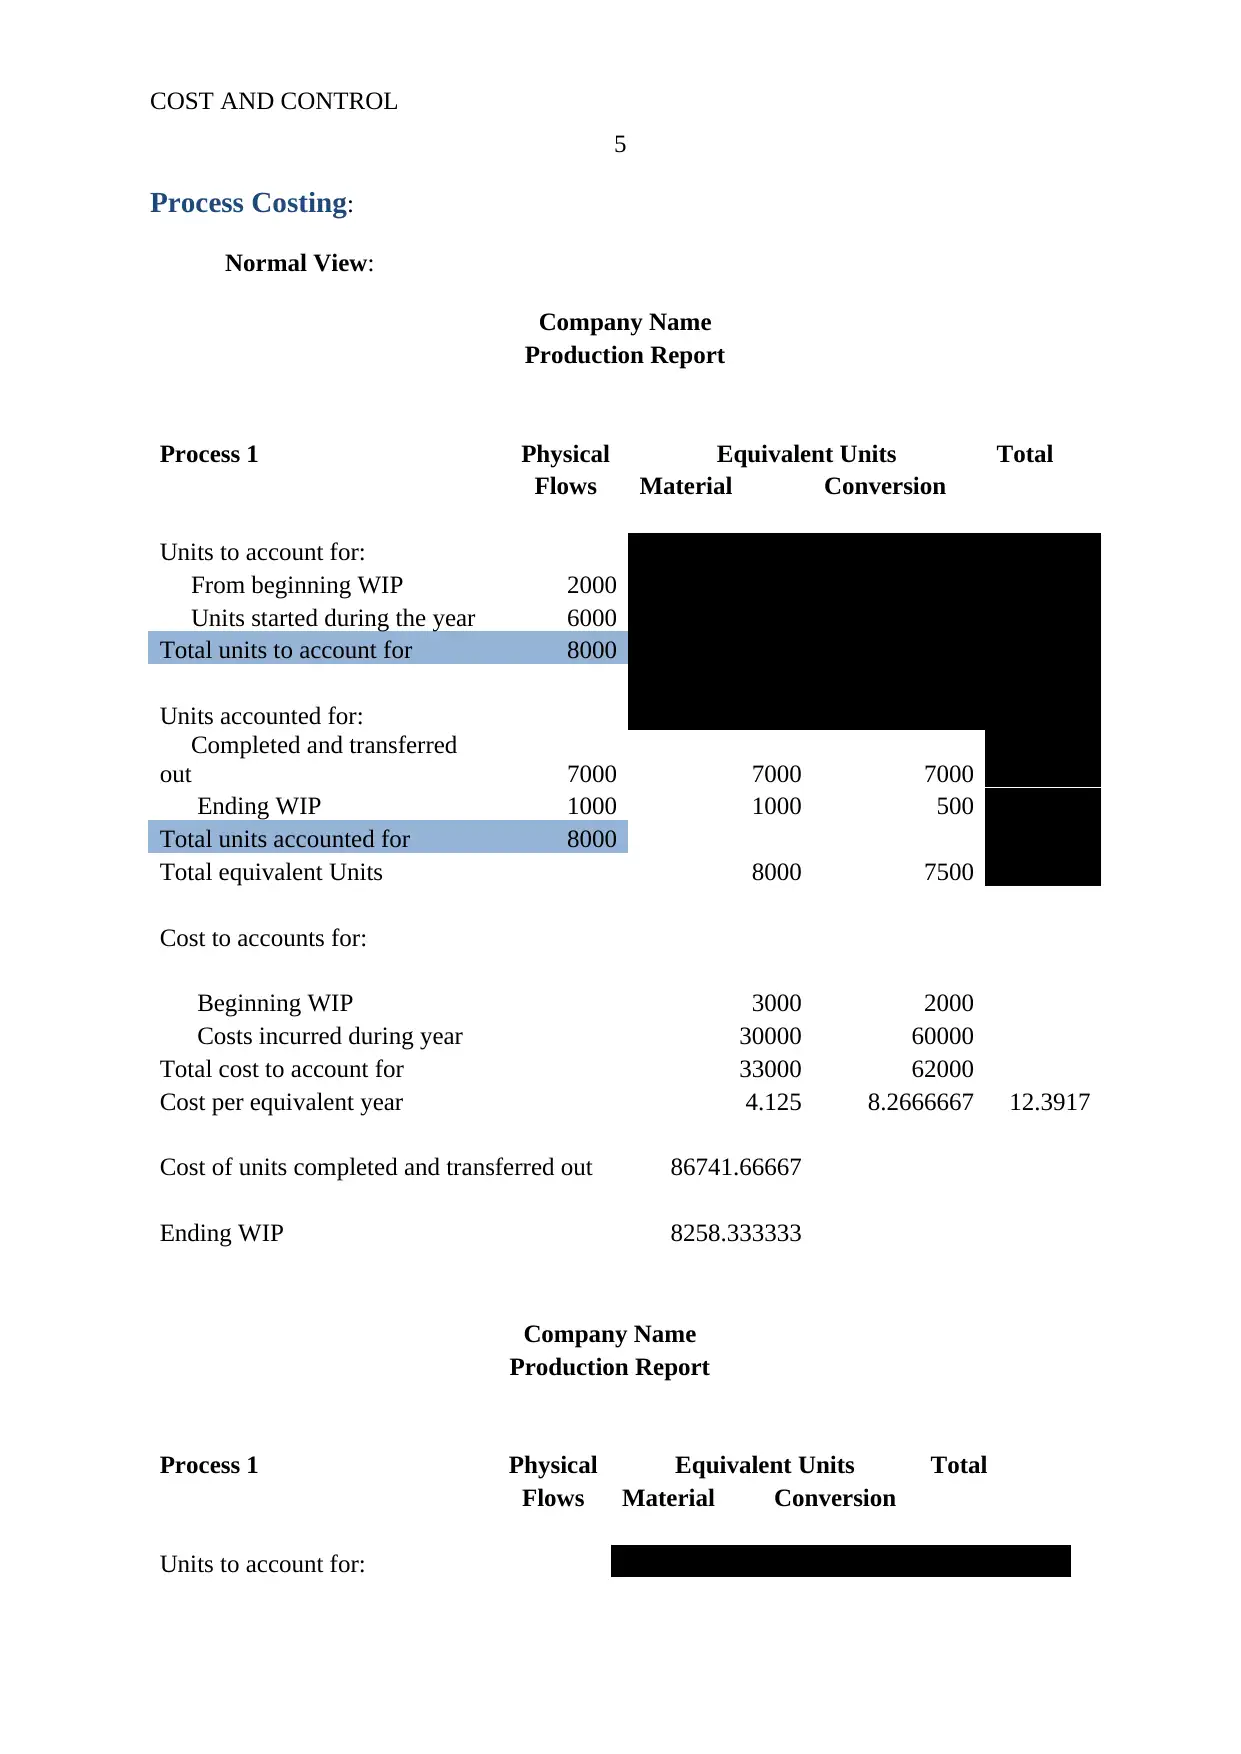
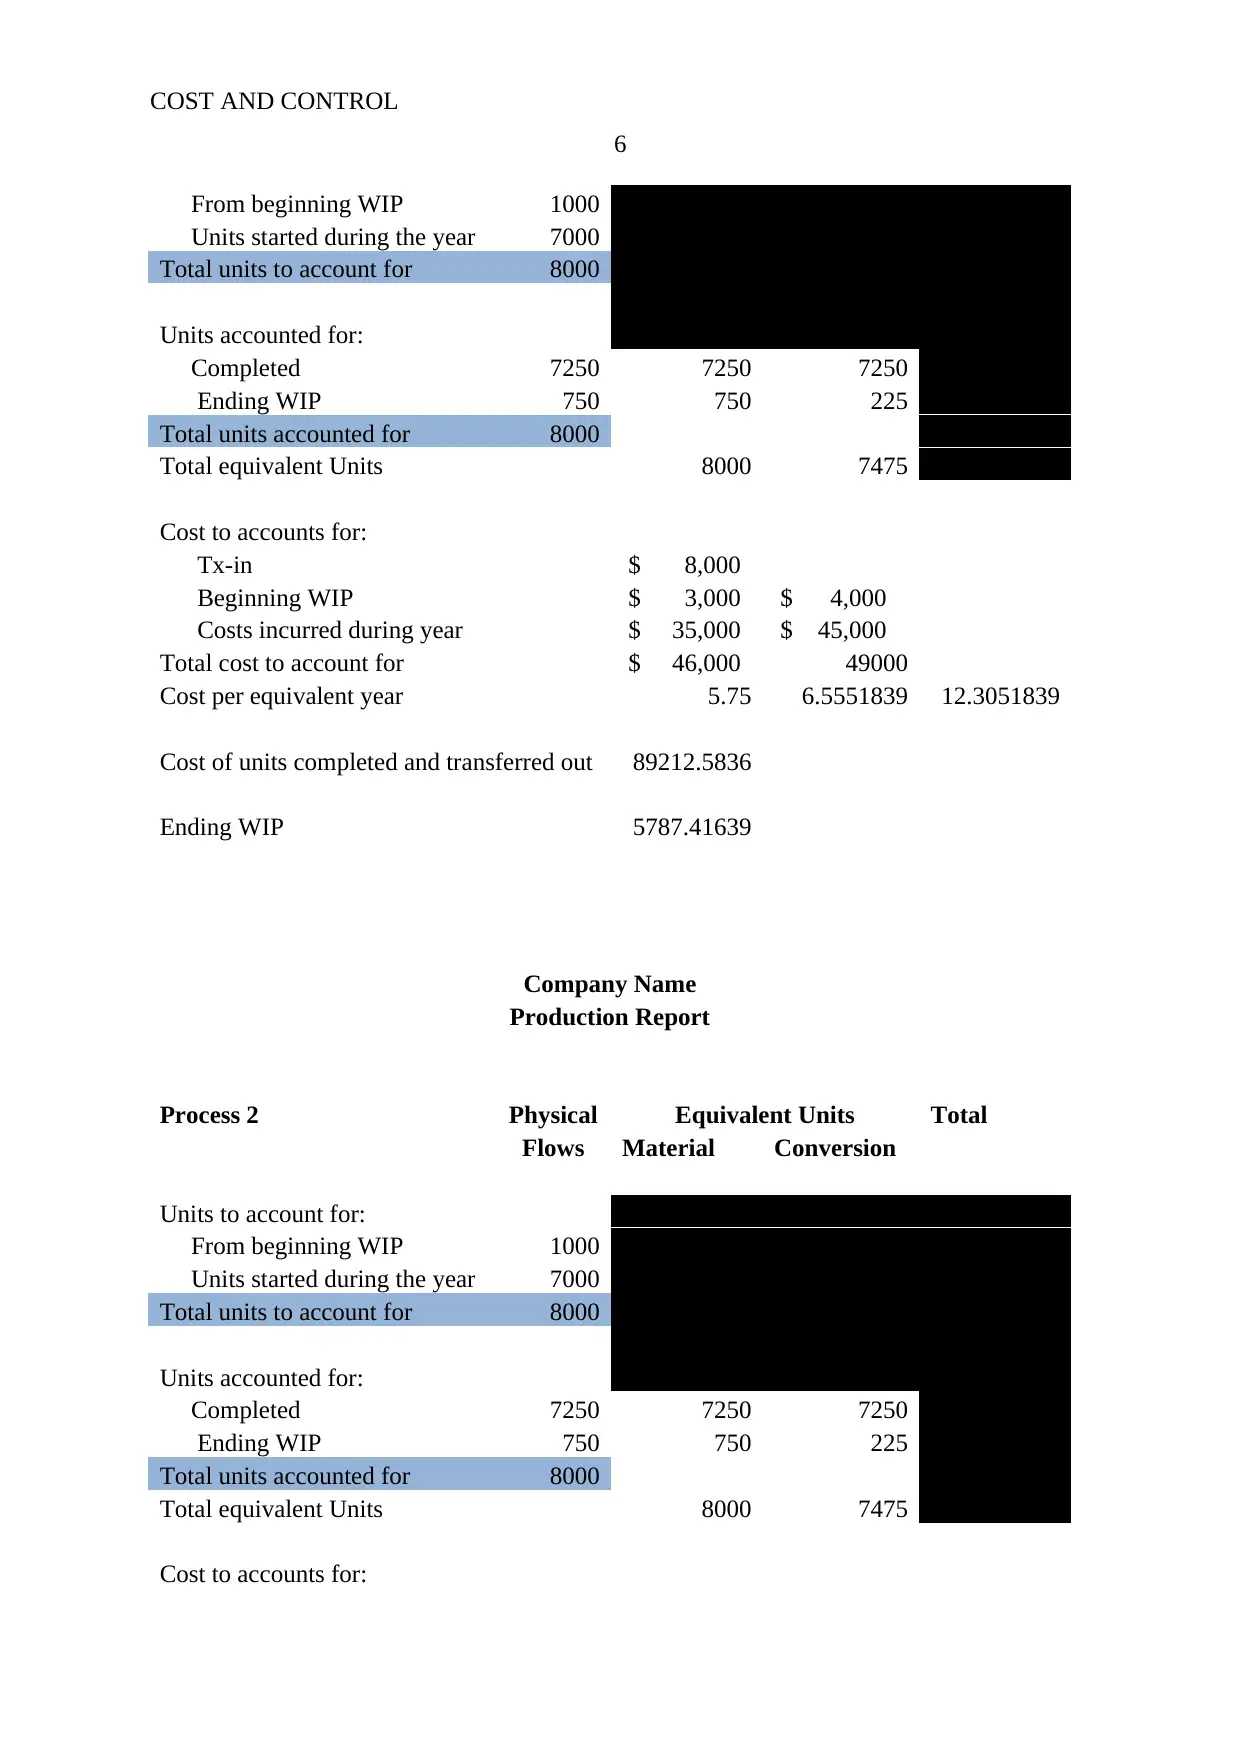
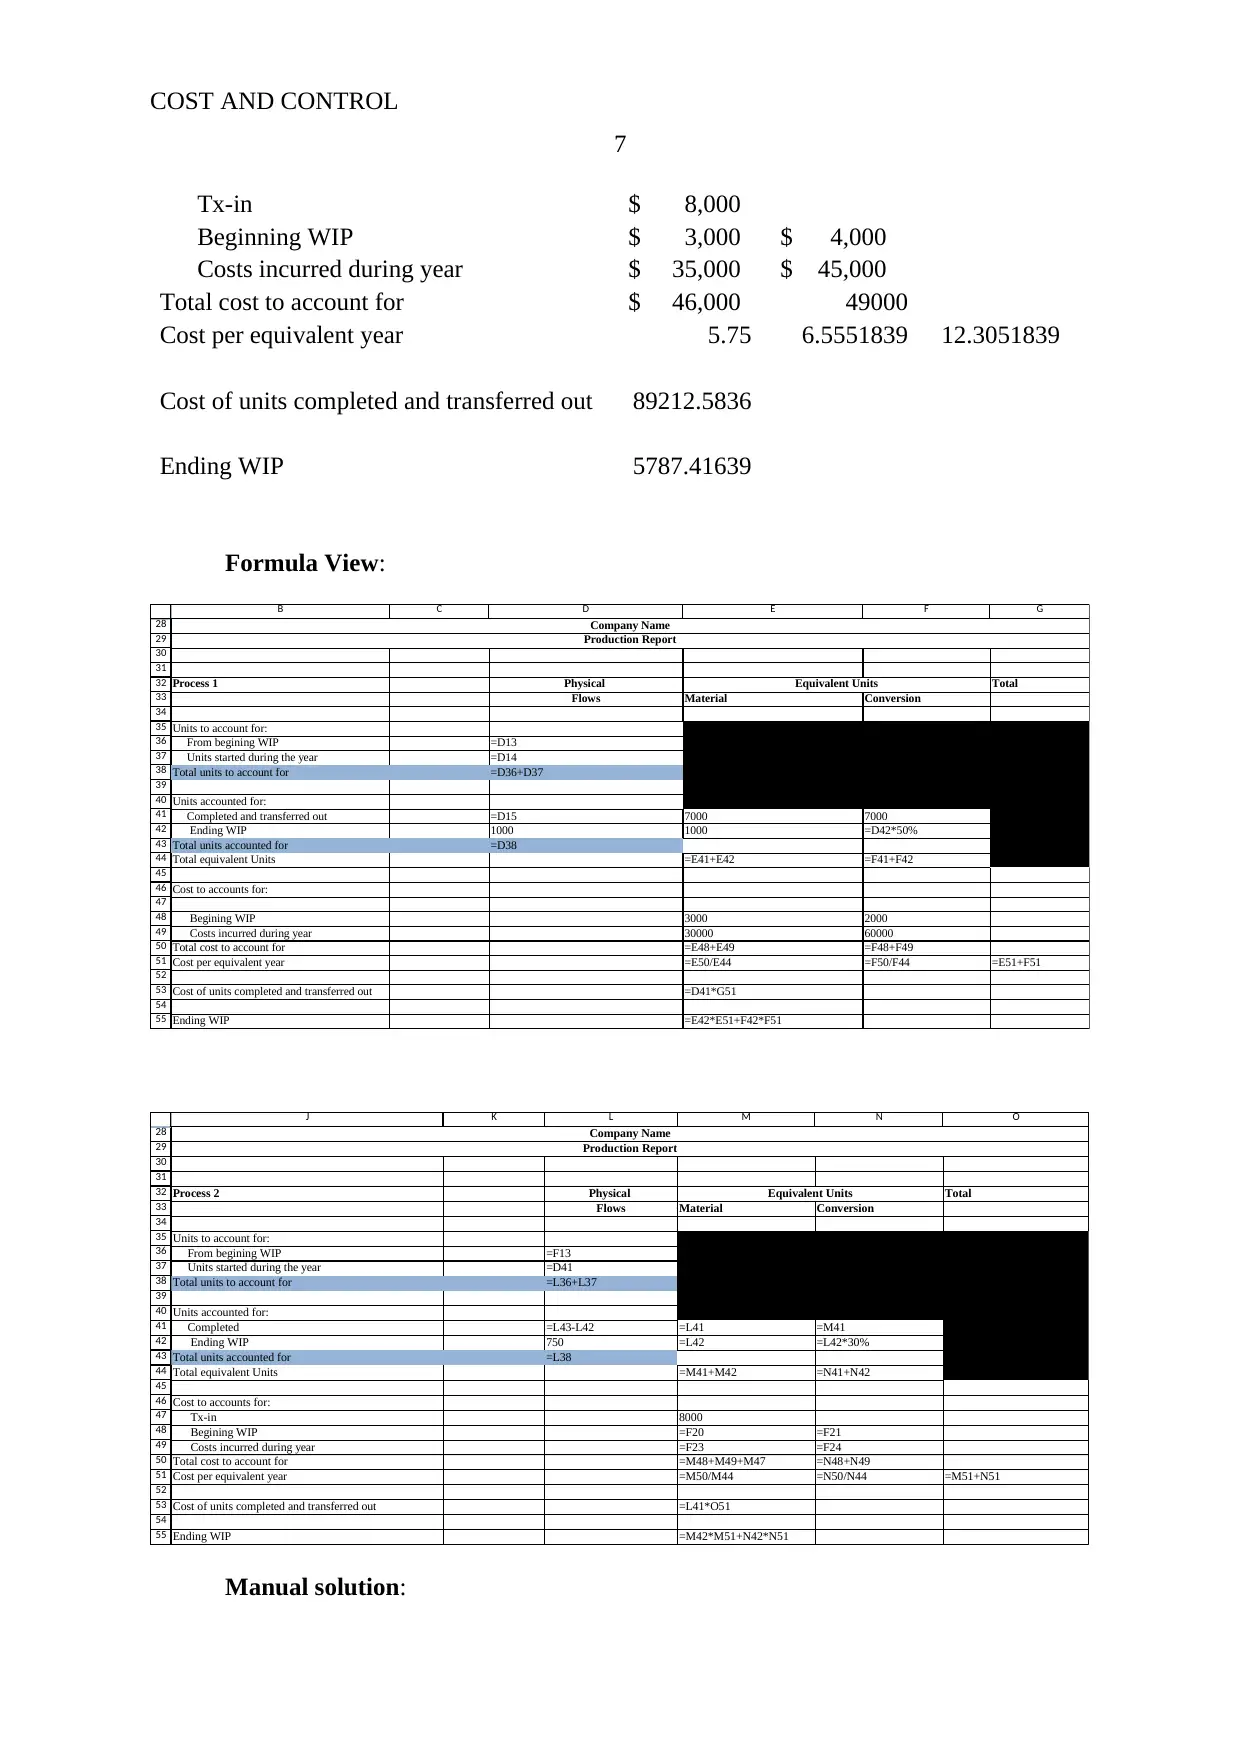
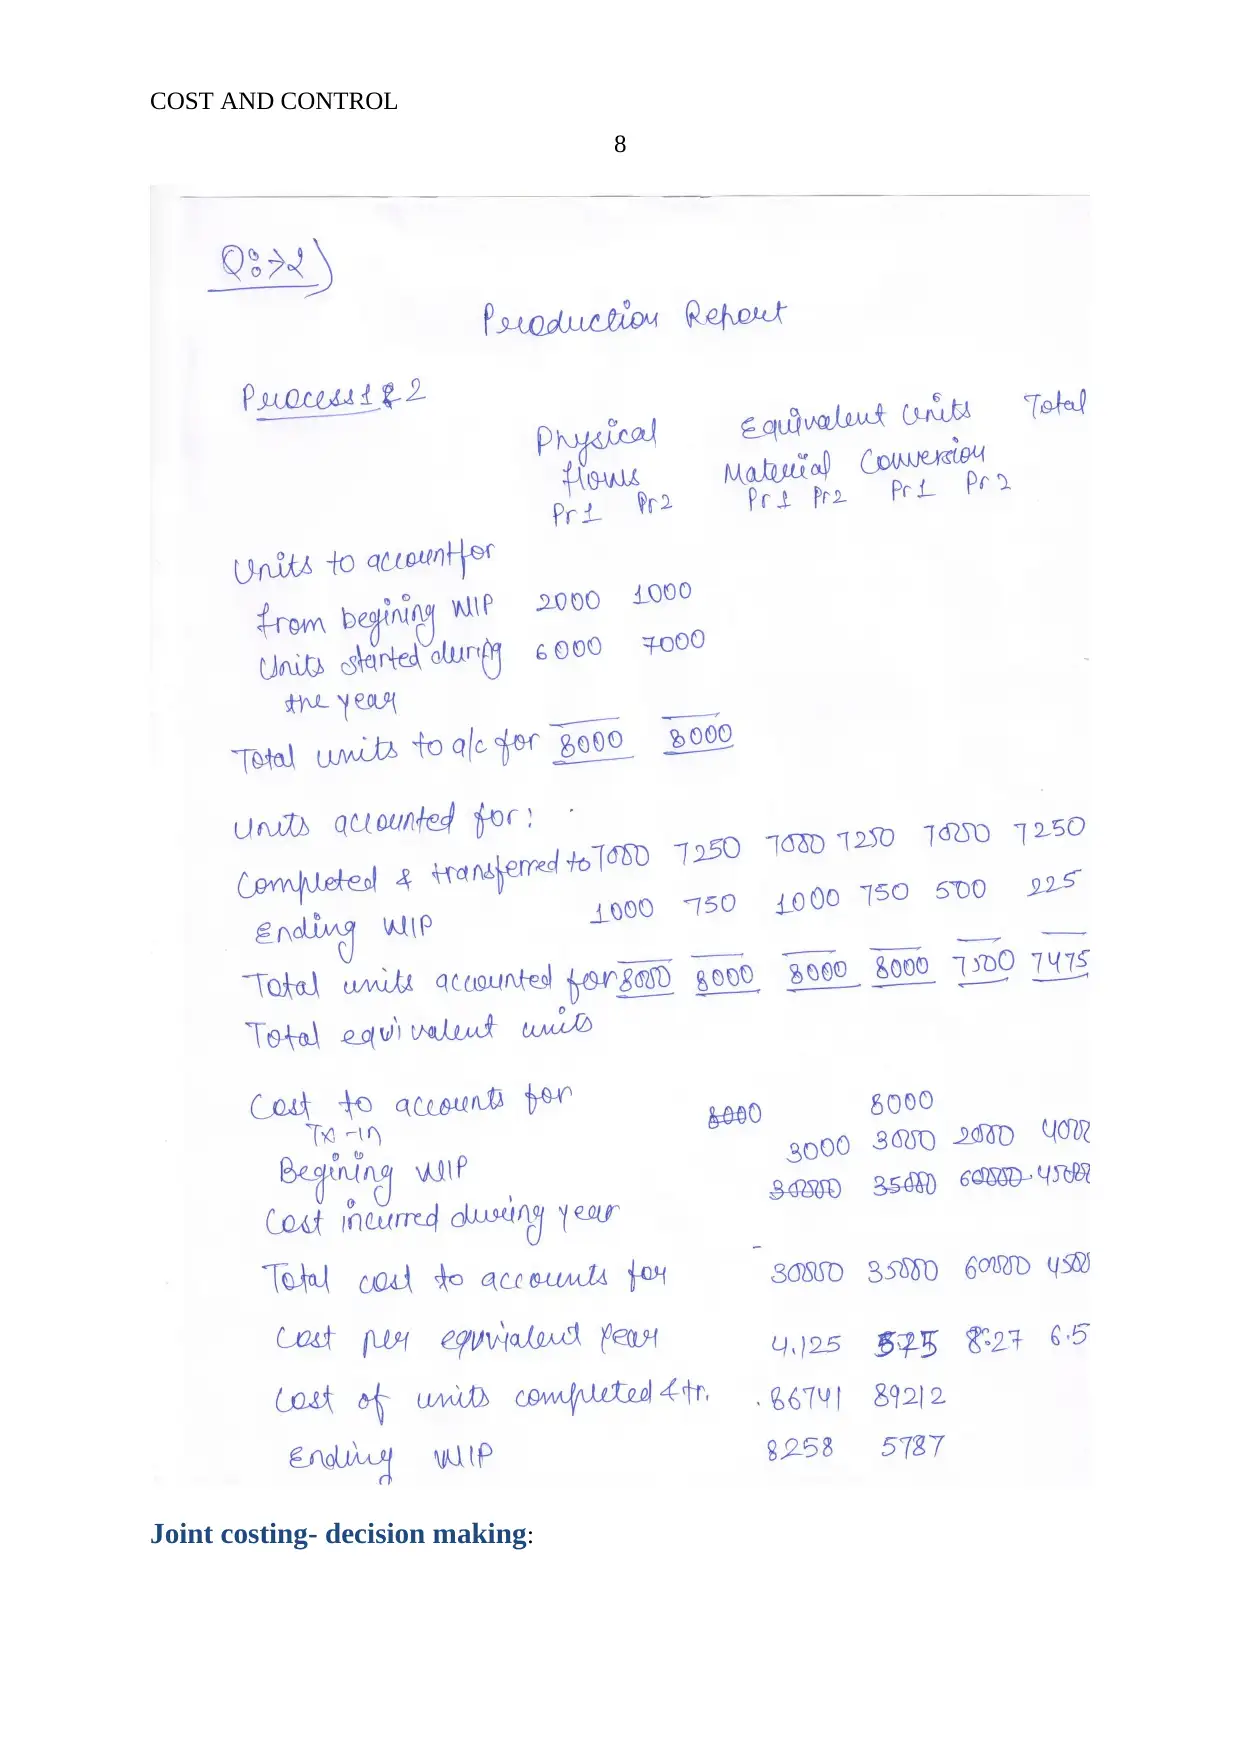
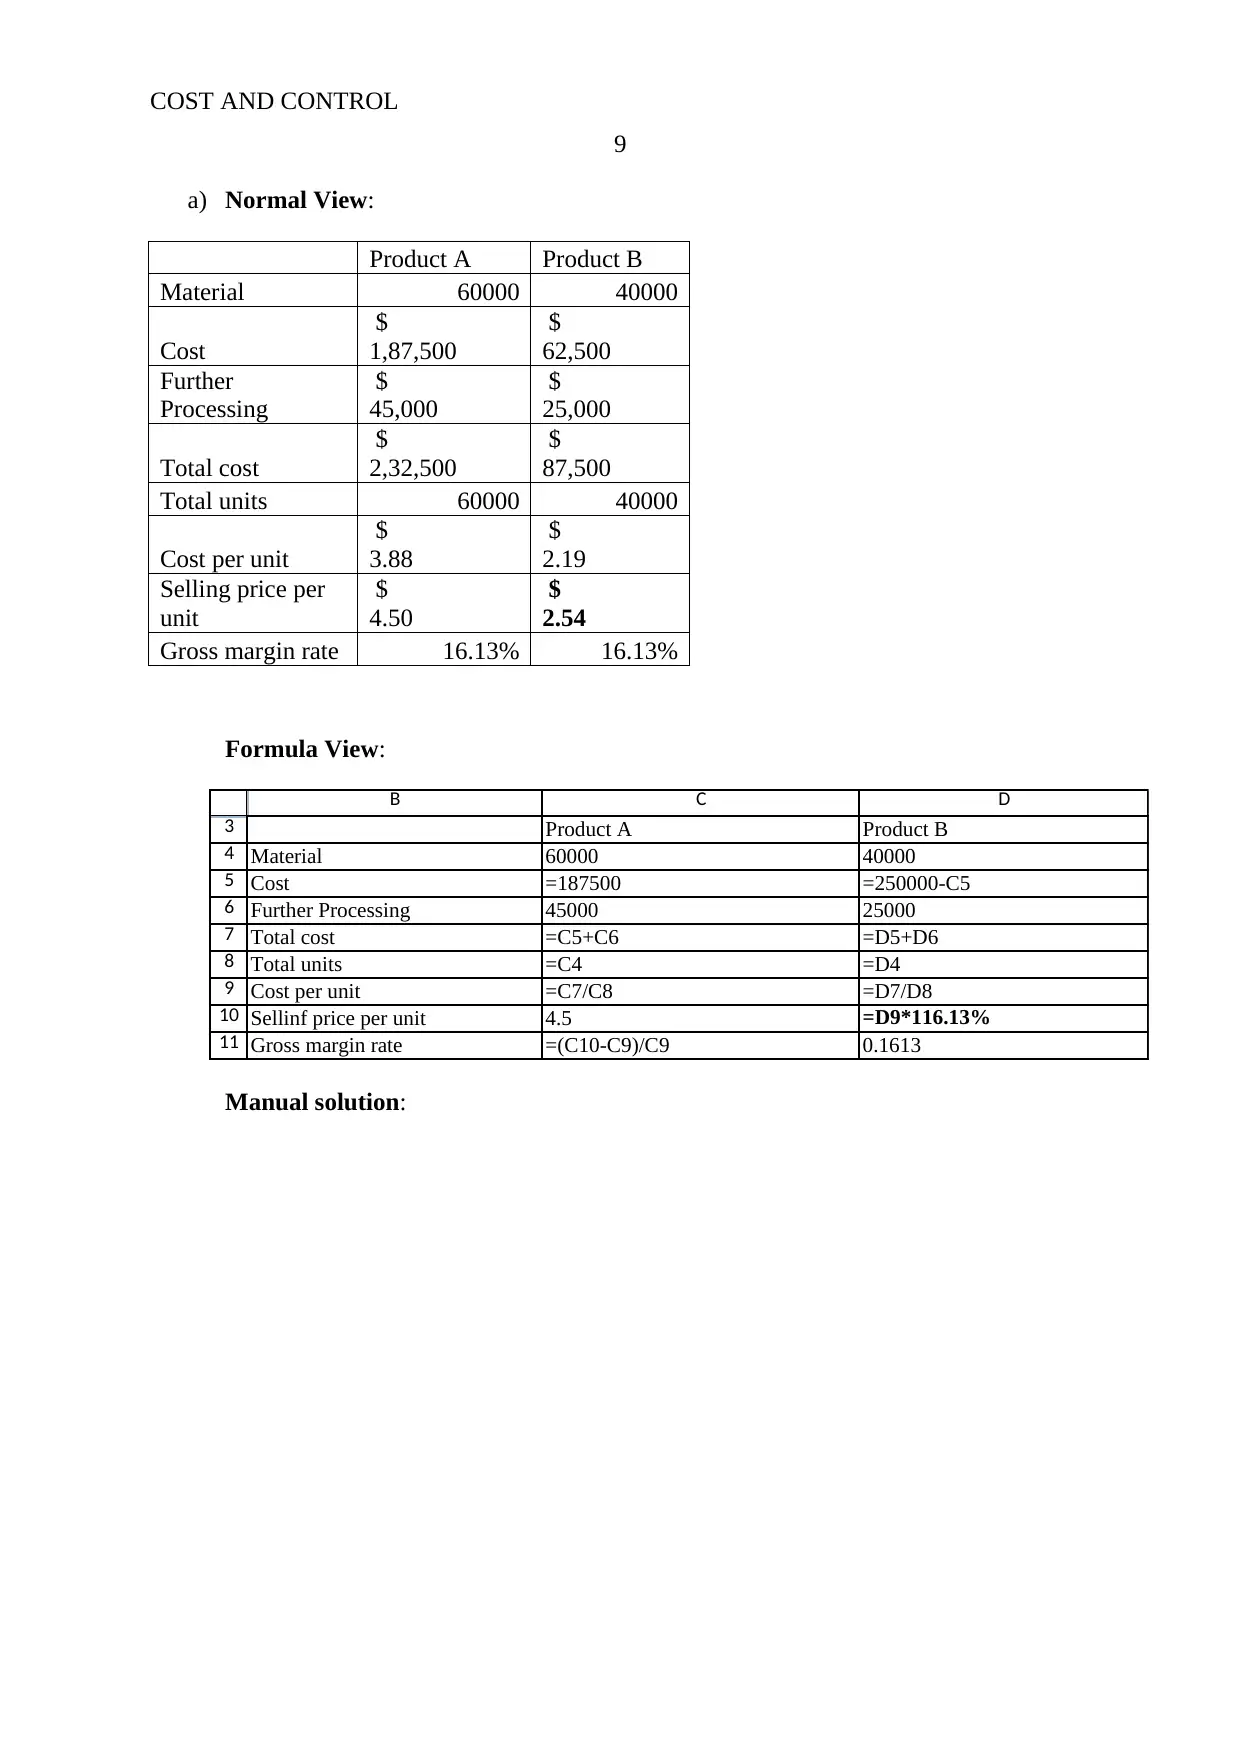
This project report delves into cost control and job costing, encompassing various financial analyses and techniques. The report begins with a normal view analysis of direct material control, work in process, and finished goods, along with journal entries and accounts payable. It then explores process costing, providing production reports for different processes. The project also includes a decision-making analysis for joint costing, comparing different scenarios and recommending the best course of action. Furthermore, the report covers variance analysis, including material purchase price and usage variances, and actual direct labor rate calculations. Finally, it presents a financial model for forecasting income statements, including sales projections, cost of goods sold, and profit analysis, along with a discussion on the political process. The project utilizes normal view, formula view, and manual solution approaches to provide a comprehensive understanding of the concepts.
Document Page
RUNNING HEAD: COST AND CONTROL
1
Project Report: Cost and control
tabler-icon-diamond-filled.svg

Paraphrase This Document

Need a fresh take? Get an instant paraphrase of this document with our AI Paraphraser
Document Page
COST AND CONTROL
2
Job costing:
a. Solution:
Normal View:
Direct material control
Debit credit
Particulars amount Particulars amount
balance b/d 23655 WIP 4810
Purchase 6155 balance c/d 25000
29810 29810
Work in process
Debit credit
Particulars amount Particulars amount
Balance b/d 6700
Direct Material 4810 Finished goods 30110
Labour 14800 balance c/d 8200
Factory overhead 12000
38310 38310
Finished Goods
Debit credit
Particulars amount Particulars amount
Balance b/d 8790 Sales 48000
WIP 30110 balance c/d 8900
gross profit 18000
56900 56900
Accounts Payable
Debit credit
Particulars amount Particulars amount
Balance b/d 2345
Cash 6700
Direct material
(purchase) 6155
balance
c/d 1800
8500 8500
Cost of goods sold
Document Page
COST AND CONTROL
3
Debit credit
Particulars amount Particulars amount
sales 48000 Gross profit 18000
Balance c/d 30000
48000 48000
Assumption: the labour cost is $ 4 per hour.
Formula View:
3
4
5
6
7
8
9
10
11
12
13
14
15
16
17
18
19
20
21
22
23
24
25
26
B C D E
Debit credit
Particluars amount Particluars amount
balance b/d =C9-C7 WIP 4810
Purchase =J7 balance c/d 25000
=E9 =SUM(E6:E7)
Debit credit
Particluars amount Particluars amount
Balance b/d 6700
Direct Material =C18-(C16+C17+C14) Finished goods =C24
Labor =3700*4 balance c/d =(1200+7000)
Factory overhead =12000
=E18 =SUM(E15:E16)
Debit credit
Particluars amount Particluars amount
Balance b/d 8790 Sales 48000
WIP =C26-(C23+C25) balance c/d 8900
gross profit =48000*(60/160)
=E26 =SUM(E23:E24)
Direct material control
Work in process
Finished Goods
3
4
5
6
7
8
9
10
11
12
13
14
15
16
G H I J
Debit credit
Particluars amount Particluars amount
Balance b/d 2345
Cash 6700 Direct material (purchase) =J9-J6
balance c/d 1800
=SUM(H7:H8) =H9
Debit credit
Particluars amount Particluars amount
sales 48000 Gross prrofit =C25
Balanc c/d =J16-J14
=H14 =H16
Accounts Payable
Cost of goods sold
Manual solution:
Document Page
COST AND CONTROL
4
b. Management accounting and history:
tabler-icon-diamond-filled.svg

Paraphrase This Document

Need a fresh take? Get an instant paraphrase of this document with our AI Paraphraser
Document Page
COST AND CONTROL
5
Process Costing:
Normal View:
Company Name
Production Report
Process 1 Physical Equivalent Units Total
Flows Material Conversion
Units to account for:
From beginning WIP 2000 600 600
Units started during the year 6000 6000 6000
Total units to account for 8000
Units accounted for:
Completed and transferred
out 7000 7000 7000
Ending WIP 1000 1000 500
Total units accounted for 8000
Total equivalent Units 8000 7500
Cost to accounts for:
Beginning WIP 3000 2000
Costs incurred during year 30000 60000
Total cost to account for 33000 62000
Cost per equivalent year 4.125 8.2666667 12.3917
Cost of units completed and transferred out 86741.66667
Ending WIP 8258.333333
Company Name
Production Report
Process 1 Physical Equivalent Units Total
Flows Material Conversion
Units to account for:
Document Page
COST AND CONTROL
6
From beginning WIP 1000 300 300
Units started during the year 7000 6000 6000
Total units to account for 8000
Units accounted for:
Completed 7250 7250 7250
Ending WIP 750 750 225
Total units accounted for 8000
Total equivalent Units 8000 7475
Cost to accounts for:
Tx-in $ 8,000
Beginning WIP $ 3,000 $ 4,000
Costs incurred during year $ 35,000 $ 45,000
Total cost to account for $ 46,000 49000
Cost per equivalent year 5.75 6.5551839 12.3051839
Cost of units completed and transferred out 89212.5836
Ending WIP 5787.41639
Company Name
Production Report
Process 2 Physical Equivalent Units Total
Flows Material Conversion
Units to account for:
From beginning WIP 1000 300 300
Units started during the year 7000 6000 6000
Total units to account for 8000
Units accounted for:
Completed 7250 7250 7250
Ending WIP 750 750 225
Total units accounted for 8000
Total equivalent Units 8000 7475
Cost to accounts for:
Document Page
COST AND CONTROL
7
Tx-in $ 8,000
Beginning WIP $ 3,000 $ 4,000
Costs incurred during year $ 35,000 $ 45,000
Total cost to account for $ 46,000 49000
Cost per equivalent year 5.75 6.5551839 12.3051839
Cost of units completed and transferred out 89212.5836
Ending WIP 5787.41639
Formula View:
28
29
30
31
32
33
34
35
36
37
38
39
40
41
42
43
44
45
46
47
48
49
50
51
52
53
54
55
B C D E F G
Process 1 Physical Total
Flows Material Conversion
Units to account for:
From begining WIP =D13 =D36*30% =D36*30%
Units started during the year =D14 6000 6000
Total units to account for =D36+D37
Units accounted for:
Completed and transferred out =D15 7000 7000
Ending WIP 1000 1000 =D42*50%
Total units accounted for =D38
Total equivalent Units =E41+E42 =F41+F42
Cost to accounts for:
Begining WIP 3000 2000
Costs incurred during year 30000 60000
Total cost to account for =E48+E49 =F48+F49
Cost per equivalent year =E50/E44 =F50/F44 =E51+F51
Cost of units completed and transferred out =D41*G51
Ending WIP =E42*E51+F42*F51
Equivalent Units
Company Name
Production Report
28
29
30
31
32
33
34
35
36
37
38
39
40
41
42
43
44
45
46
47
48
49
50
51
52
53
54
55
J K L M N O
Process 2 Physical Total
Flows Material Conversion
Units to account for:
From begining WIP =F13 =L36*30% =L36*30%
Units started during the year =D41 6000 6000
Total units to account for =L36+L37
Units accounted for:
Completed =L43-L42 =L41 =M41
Ending WIP 750 =L42 =L42*30%
Total units accounted for =L38
Total equivalent Units =M41+M42 =N41+N42
Cost to accounts for:
Tx-in 8000
Begining WIP =F20 =F21
Costs incurred during year =F23 =F24
Total cost to account for =M48+M49+M47 =N48+N49
Cost per equivalent year =M50/M44 =N50/N44 =M51+N51
Cost of units completed and transferred out =L41*O51
Ending WIP =M42*M51+N42*N51
Company Name
Production Report
Equivalent Units
Manual solution:
tabler-icon-diamond-filled.svg

Paraphrase This Document

Need a fresh take? Get an instant paraphrase of this document with our AI Paraphraser
Document Page
COST AND CONTROL
8
Joint costing- decision making:
Document Page
COST AND CONTROL
9
a) Normal View:
Product A Product B
Material 60000 40000
Cost
$
1,87,500
$
62,500
Further
Processing
$
45,000
$
25,000
Total cost
$
2,32,500
$
87,500
Total units 60000 40000
Cost per unit
$
3.88
$
2.19
Selling price per
unit
$
4.50
$
2.54
Gross margin rate 16.13% 16.13%
Formula View:
3
4
5
6
7
8
9
10
11
B C D
Product A Product B
Material 60000 40000
Cost =187500 =250000-C5
Further Processing 45000 25000
Total cost =C5+C6 =D5+D6
Total units =C4 =D4
Cost per unit =C7/C8 =D7/D8
Sellinf price per unit 4.5 =D9*116.13%
Gross margin rate =(C10-C9)/C9 0.1613
Manual solution:
Document Page
COST AND CONTROL
10
b) Report:
tabler-icon-diamond-filled.svg

Paraphrase This Document

Need a fresh take? Get an instant paraphrase of this document with our AI Paraphraser
Document Page
COST AND CONTROL
11
Further, this case depict that a buyer has offered a project to the company under which
entire material related to product A would be bought by the company in $ 2. According to
this the total cost of the company would be $ 120000 as 60000 are the units and $ 2 per unit
is the cost. Further, the cost which is incurred in the company for producing the product A
is $ 187500. So the total difference among the current cost and the offered cost is $ 67500.
Further, it has been analyzed that if the product A is processed further to than the total cost
of the company would be $ 165000 according to the offered project and $ 232500 according
to the current project. So the offered project is better than the current project. So the
company must produce product C to enjoy more profits.
Product A
Material 60000
Cost
$
1,20,000
Further
Processing
$
45,000
Total cost
$
1,65,000
Total units 60000
Cost per unit
$
2.75
Selling price per
unit
$
4.50
Gross margin rate 63.64%
$
1,05,000.00
Variance analysis:
a) Standard cost variance:
Normal View:
Calculation of material purchase price variance
Standard Price (A)
$
6
Actual Price (B)
$
6.20
Actual quantity (C) 2,20,000
Document Page
COST AND CONTROL
12
DM purchase price variance
(A-B)*C
$ -
44,000.00
Unfavourable
Calculation of material usage variance
Standard Quantity (A) 214500
Actual Quantity (B) 197000
Standard Price (C)
$
6.00
DM material usage variance
(B-A)*C
$ -
1,05,000.00
Unfavourable
Calculation of actual direct labour rate per hour
Direct Labour Variance 1950
Standard rate 20
Actual Hours 40000
Actual direct labour rate per
hour 20.05
Books of KLINGTON limited
Journal Entries
Raw material $ 13,64,000
Accounts Payable
$
13,64,000
Direct Labour a/c 801950
Cash 801950
Formula View:
chevron_up_icon
1 out of 17
circle_padding
hide_on_mobile
zoom_out_icon