Stock Market Data Analysis
VerifiedAdded on 2020/05/16
|27
|6078
|33
AI Summary
This assignment involves analyzing a dataset of historical stock market data for a specific company. The data includes daily closing prices and corresponding values for a period spanning several days in December 2017. Students are tasked with examining the provided information to identify trends, patterns, and potential insights into the company's stock performance during that timeframe.
Contribute Materials
Your contribution can guide someone’s learning journey. Share your
documents today.
Running Head: Finance For Business
1
Project Report: Finance for business
1
Project Report: Finance for business
Secure Best Marks with AI Grader
Need help grading? Try our AI Grader for instant feedback on your assignments.
Finance For Business
2
Contents
Introduction.......................................................................................................................3
1. Company description...............................................................................................3
2. Ownership governance structure.............................................................................3
3. Performance ratios...................................................................................................4
4. Changes in stock price.............................................................................................6
5. Significant factors....................................................................................................7
6. Calculation of CAPM and beta values.....................................................................8
7. WACC calculations.................................................................................................8
8. Debt ratios................................................................................................................9
9. Dividend policy......................................................................................................10
10. Recommendation and Conclusion.........................................................................10
References.......................................................................................................................11
Appendix.........................................................................................................................13
Finance For Business
3
Introduction:
Financial management is a stream of management which makes it easy for the
company to analyze, evaluate and determine the required changes for the betterment of the
organization. The financial management assist the company to choose the best project and
make better decision about the operations and the activities of the company. On the other
hand, financial evaluation techniques also assist the stakeholder of the company to make
better choices about the position of the company. Financial evaluation helps the company to
manage and evaluate the better companies for the purpose of investment and it also helps
them to evaluate that what is the exact performance of the company and in the industry.
Financial evaluation involves various techniques such as IRR, NPV, Ratio analysis, vertical
analysis, WACC, required rate of return, cost of debt etc.
1. Company description:
Pacific Energy Limited is an Australian company. This company is operating its
business into Australian utility industry in which it develops, builds, manages and operates
electricity generation facilities in the Australian market. On the date of 11 Sept, 2017, this
company has operated and owned 21 diesel, gas, power stations and duel filled power
minerals along with the total power generation capacity which is approximately about 272
MW. Headquarter of the company is Landsdale, Australia. Currently, the company is
operating very well in the industry and the projects of the company are also attractive.
2. Ownership governance structure:
Further, the governance structure of the company has also been investigated and it has
been found that what the main people of the company and who are chief shareholders of the
company are (Brealey, Myers and Marcus, 2007). This study explains about the board of
members and the people who have more than 20% stake in the stock of the company.
Following is the detail about me:
Substantial stakeholders:
Substantial stakeholders are those person who has their stock in an entity and invests
the most in the company, through the annual report of the company, it has been found that the
Sept Pty Ltd <Hall Family Fund A/C> is the main stakeholders of the company and it has
around 47.73% stock in the company. Further, it expresses that the other stakeholder of the
Finance For Business
4
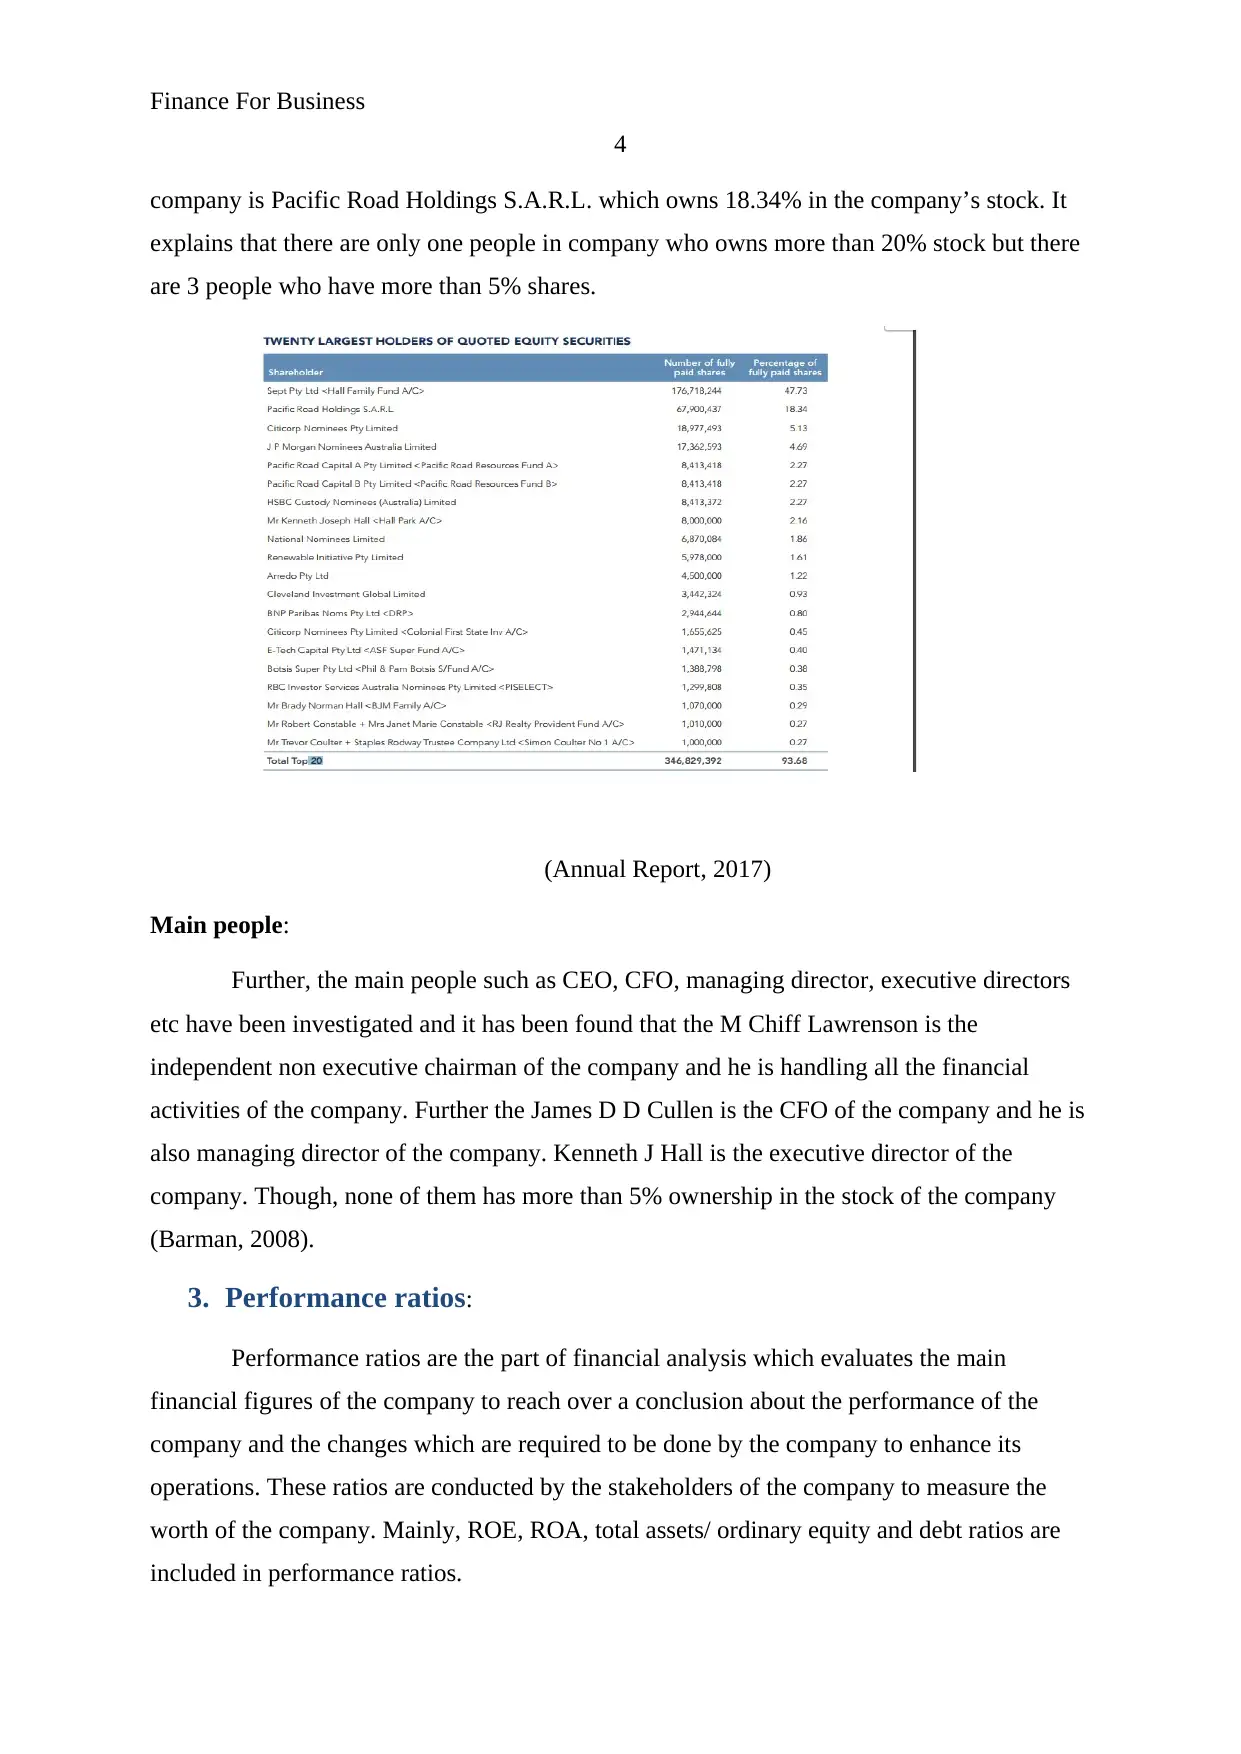
company is Pacific Road Holdings S.A.R.L. which owns 18.34% in the company’s stock. It
explains that there are only one people in company who owns more than 20% stock but there
are 3 people who have more than 5% shares.
(Annual Report, 2017)
Main people:
Further, the main people such as CEO, CFO, managing director, executive directors
etc have been investigated and it has been found that the M Chiff Lawrenson is the
independent non executive chairman of the company and he is handling all the financial
activities of the company. Further the James D D Cullen is the CFO of the company and he is
also managing director of the company. Kenneth J Hall is the executive director of the
company. Though, none of them has more than 5% ownership in the stock of the company
(Barman, 2008).
3. Performance ratios:
Performance ratios are the part of financial analysis which evaluates the main
financial figures of the company to reach over a conclusion about the performance of the
company and the changes which are required to be done by the company to enhance its
operations. These ratios are conducted by the stakeholders of the company to measure the
worth of the company. Mainly, ROE, ROA, total assets/ ordinary equity and debt ratios are
included in performance ratios.
4
company is Pacific Road Holdings S.A.R.L. which owns 18.34% in the company’s stock. It
explains that there are only one people in company who owns more than 20% stock but there
are 3 people who have more than 5% shares.
(Annual Report, 2017)
Main people:
Further, the main people such as CEO, CFO, managing director, executive directors
etc have been investigated and it has been found that the M Chiff Lawrenson is the
independent non executive chairman of the company and he is handling all the financial
activities of the company. Further the James D D Cullen is the CFO of the company and he is
also managing director of the company. Kenneth J Hall is the executive director of the
company. Though, none of them has more than 5% ownership in the stock of the company
(Barman, 2008).
3. Performance ratios:
Performance ratios are the part of financial analysis which evaluates the main
financial figures of the company to reach over a conclusion about the performance of the
company and the changes which are required to be done by the company to enhance its
operations. These ratios are conducted by the stakeholders of the company to measure the
worth of the company. Mainly, ROE, ROA, total assets/ ordinary equity and debt ratios are
included in performance ratios.
Secure Best Marks with AI Grader
Need help grading? Try our AI Grader for instant feedback on your assignments.
Finance For Business
5
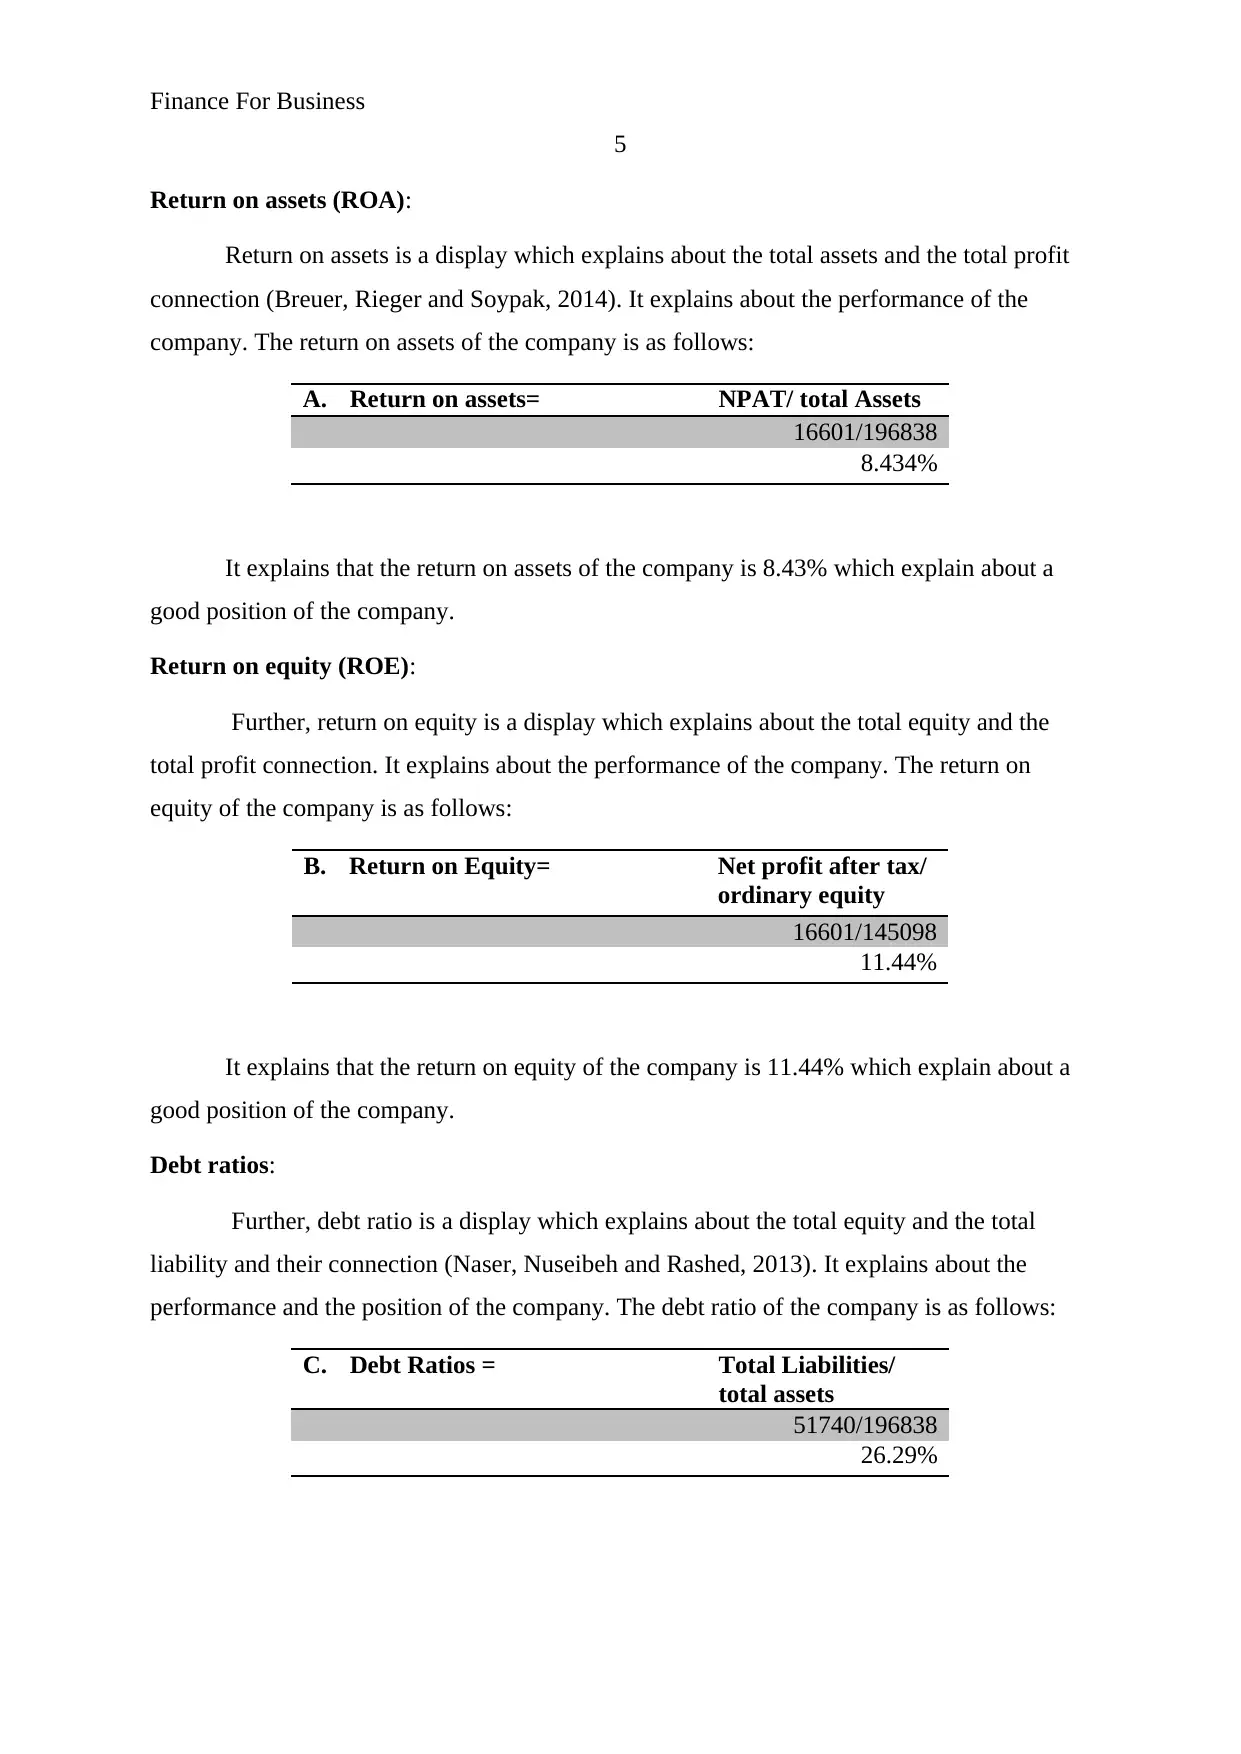
Return on assets (ROA):
Return on assets is a display which explains about the total assets and the total profit
connection (Breuer, Rieger and Soypak, 2014). It explains about the performance of the
company. The return on assets of the company is as follows:
A. Return on assets= NPAT/ total Assets
16601/196838
8.434%
It explains that the return on assets of the company is 8.43% which explain about a
good position of the company.
Return on equity (ROE):
Further, return on equity is a display which explains about the total equity and the
total profit connection. It explains about the performance of the company. The return on
equity of the company is as follows:
B. Return on Equity= Net profit after tax/
ordinary equity
16601/145098
11.44%
It explains that the return on equity of the company is 11.44% which explain about a
good position of the company.
Debt ratios:
Further, debt ratio is a display which explains about the total equity and the total
liability and their connection (Naser, Nuseibeh and Rashed, 2013). It explains about the
performance and the position of the company. The debt ratio of the company is as follows:
C. Debt Ratios = Total Liabilities/
total assets
51740/196838
26.29%
5
Return on assets (ROA):
Return on assets is a display which explains about the total assets and the total profit
connection (Breuer, Rieger and Soypak, 2014). It explains about the performance of the
company. The return on assets of the company is as follows:
A. Return on assets= NPAT/ total Assets
16601/196838
8.434%
It explains that the return on assets of the company is 8.43% which explain about a
good position of the company.
Return on equity (ROE):
Further, return on equity is a display which explains about the total equity and the
total profit connection. It explains about the performance of the company. The return on
equity of the company is as follows:
B. Return on Equity= Net profit after tax/
ordinary equity
16601/145098
11.44%
It explains that the return on equity of the company is 11.44% which explain about a
good position of the company.
Debt ratios:
Further, debt ratio is a display which explains about the total equity and the total
liability and their connection (Naser, Nuseibeh and Rashed, 2013). It explains about the
performance and the position of the company. The debt ratio of the company is as follows:
C. Debt Ratios = Total Liabilities/
total assets
51740/196838
26.29%
Finance For Business
6
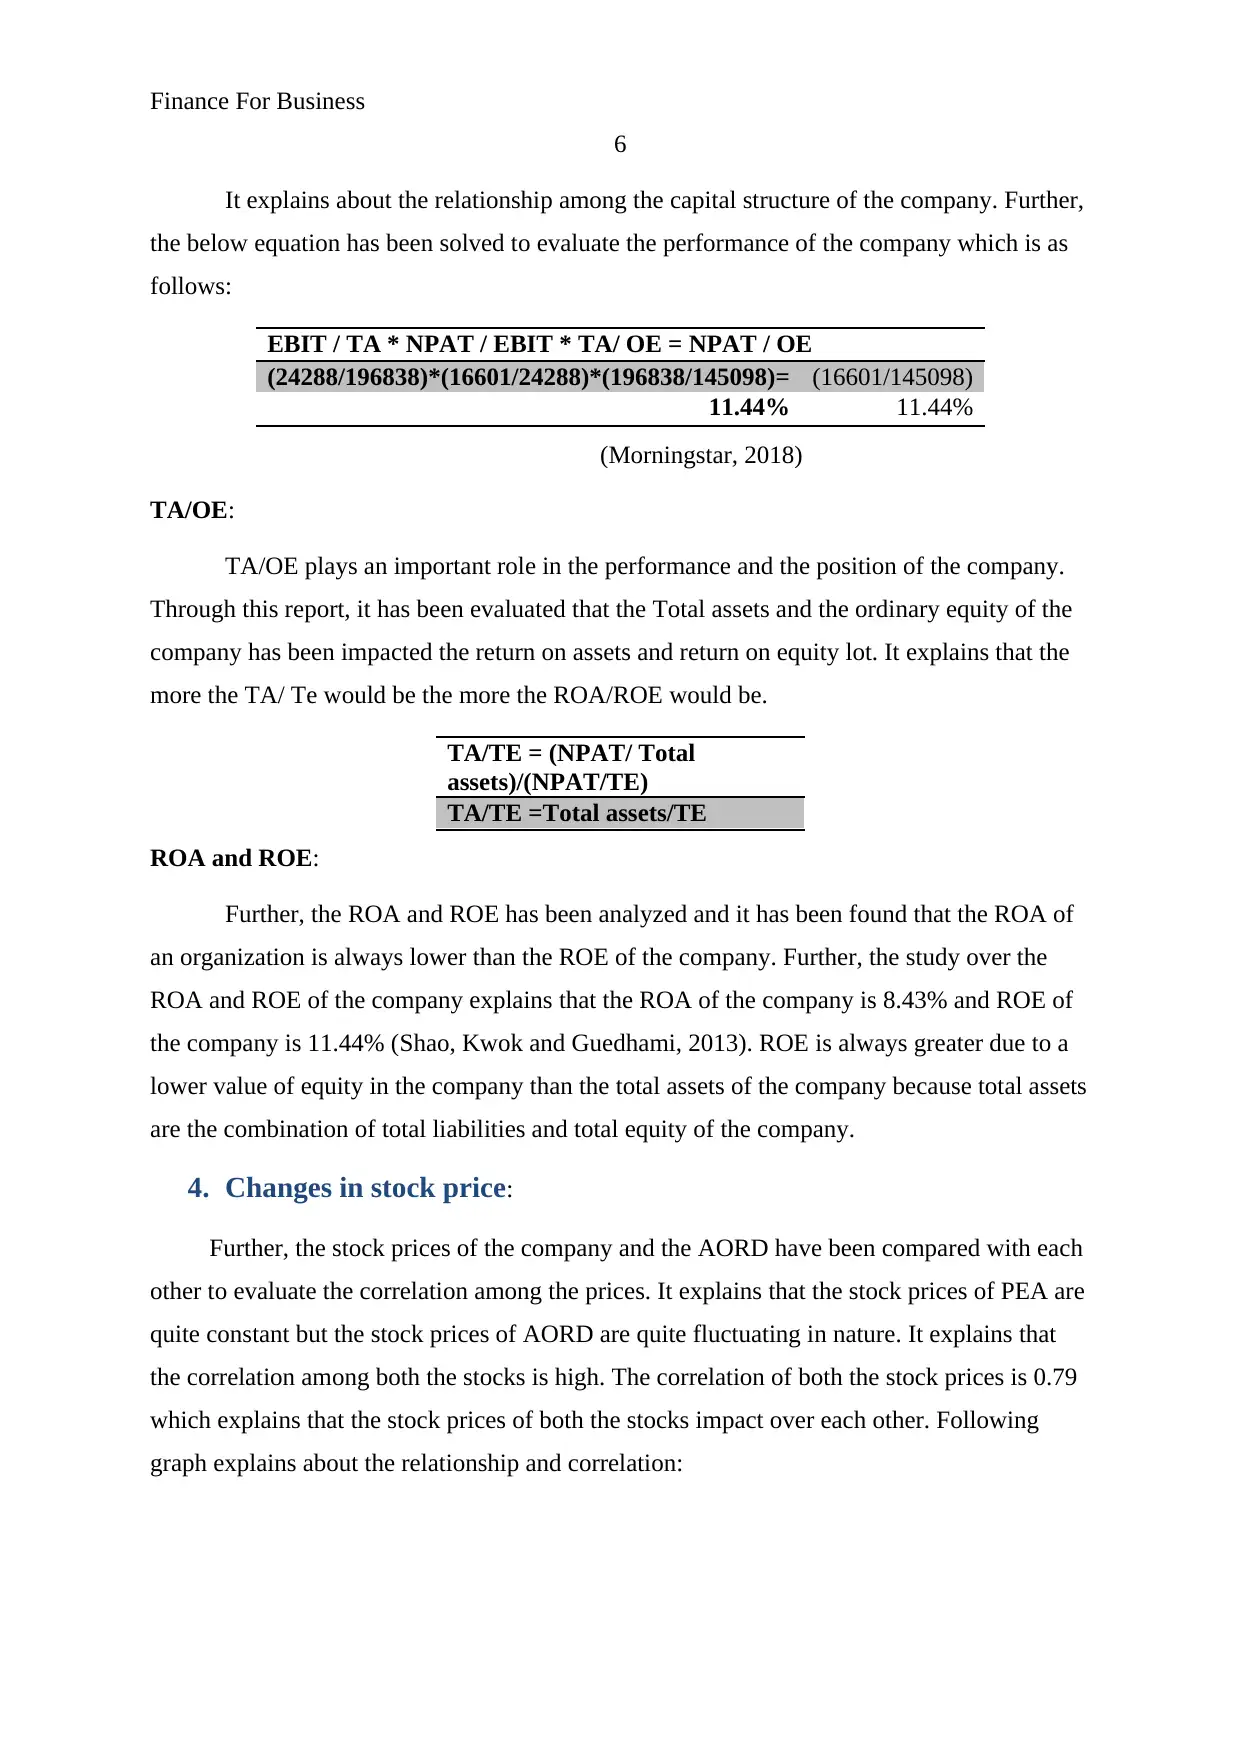
It explains about the relationship among the capital structure of the company. Further,
the below equation has been solved to evaluate the performance of the company which is as
follows:
EBIT / TA * NPAT / EBIT * TA/ OE = NPAT / OE
(24288/196838)*(16601/24288)*(196838/145098)= (16601/145098)
11.44% 11.44%
(Morningstar, 2018)
TA/OE:
TA/OE plays an important role in the performance and the position of the company.
Through this report, it has been evaluated that the Total assets and the ordinary equity of the
company has been impacted the return on assets and return on equity lot. It explains that the
more the TA/ Te would be the more the ROA/ROE would be.
TA/TE = (NPAT/ Total
assets)/(NPAT/TE)
TA/TE =Total assets/TE
ROA and ROE:
Further, the ROA and ROE has been analyzed and it has been found that the ROA of
an organization is always lower than the ROE of the company. Further, the study over the
ROA and ROE of the company explains that the ROA of the company is 8.43% and ROE of
the company is 11.44% (Shao, Kwok and Guedhami, 2013). ROE is always greater due to a
lower value of equity in the company than the total assets of the company because total assets
are the combination of total liabilities and total equity of the company.
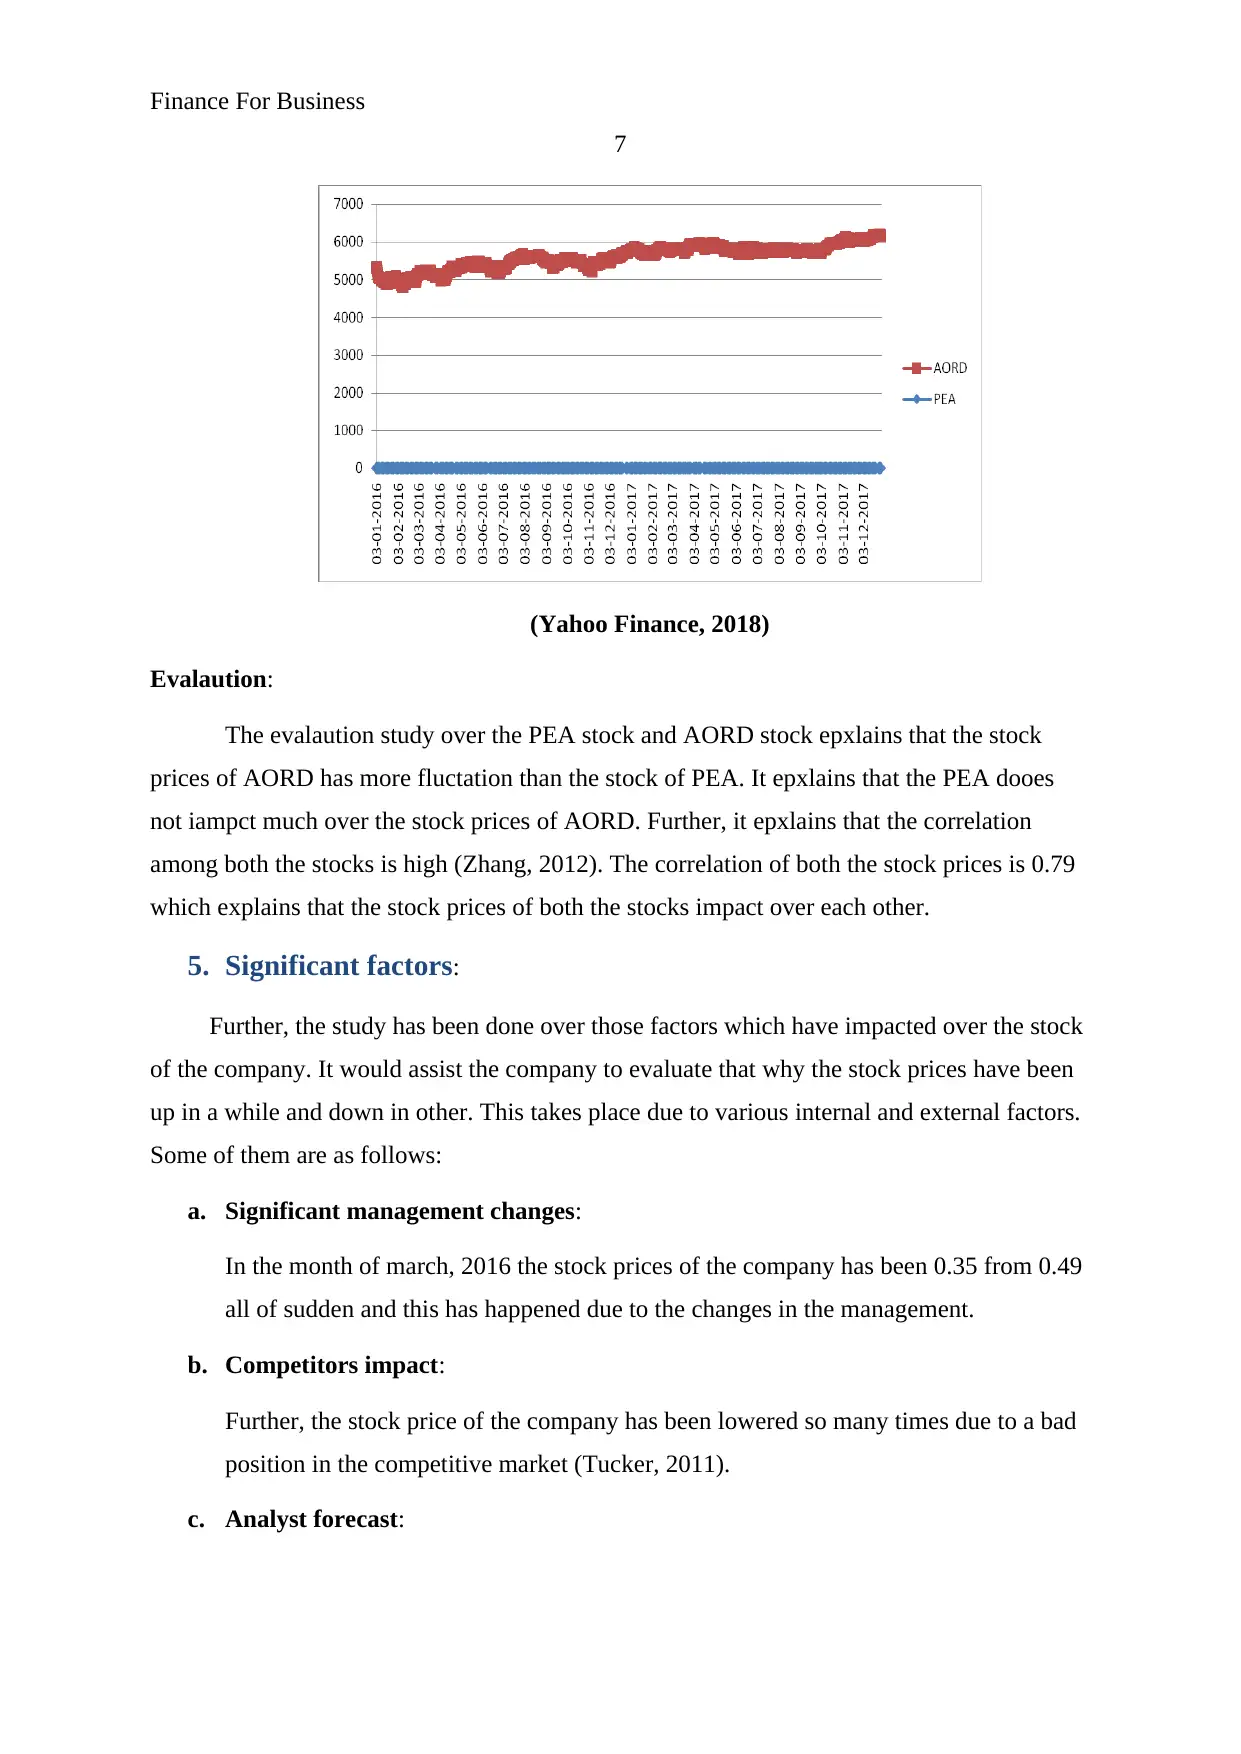
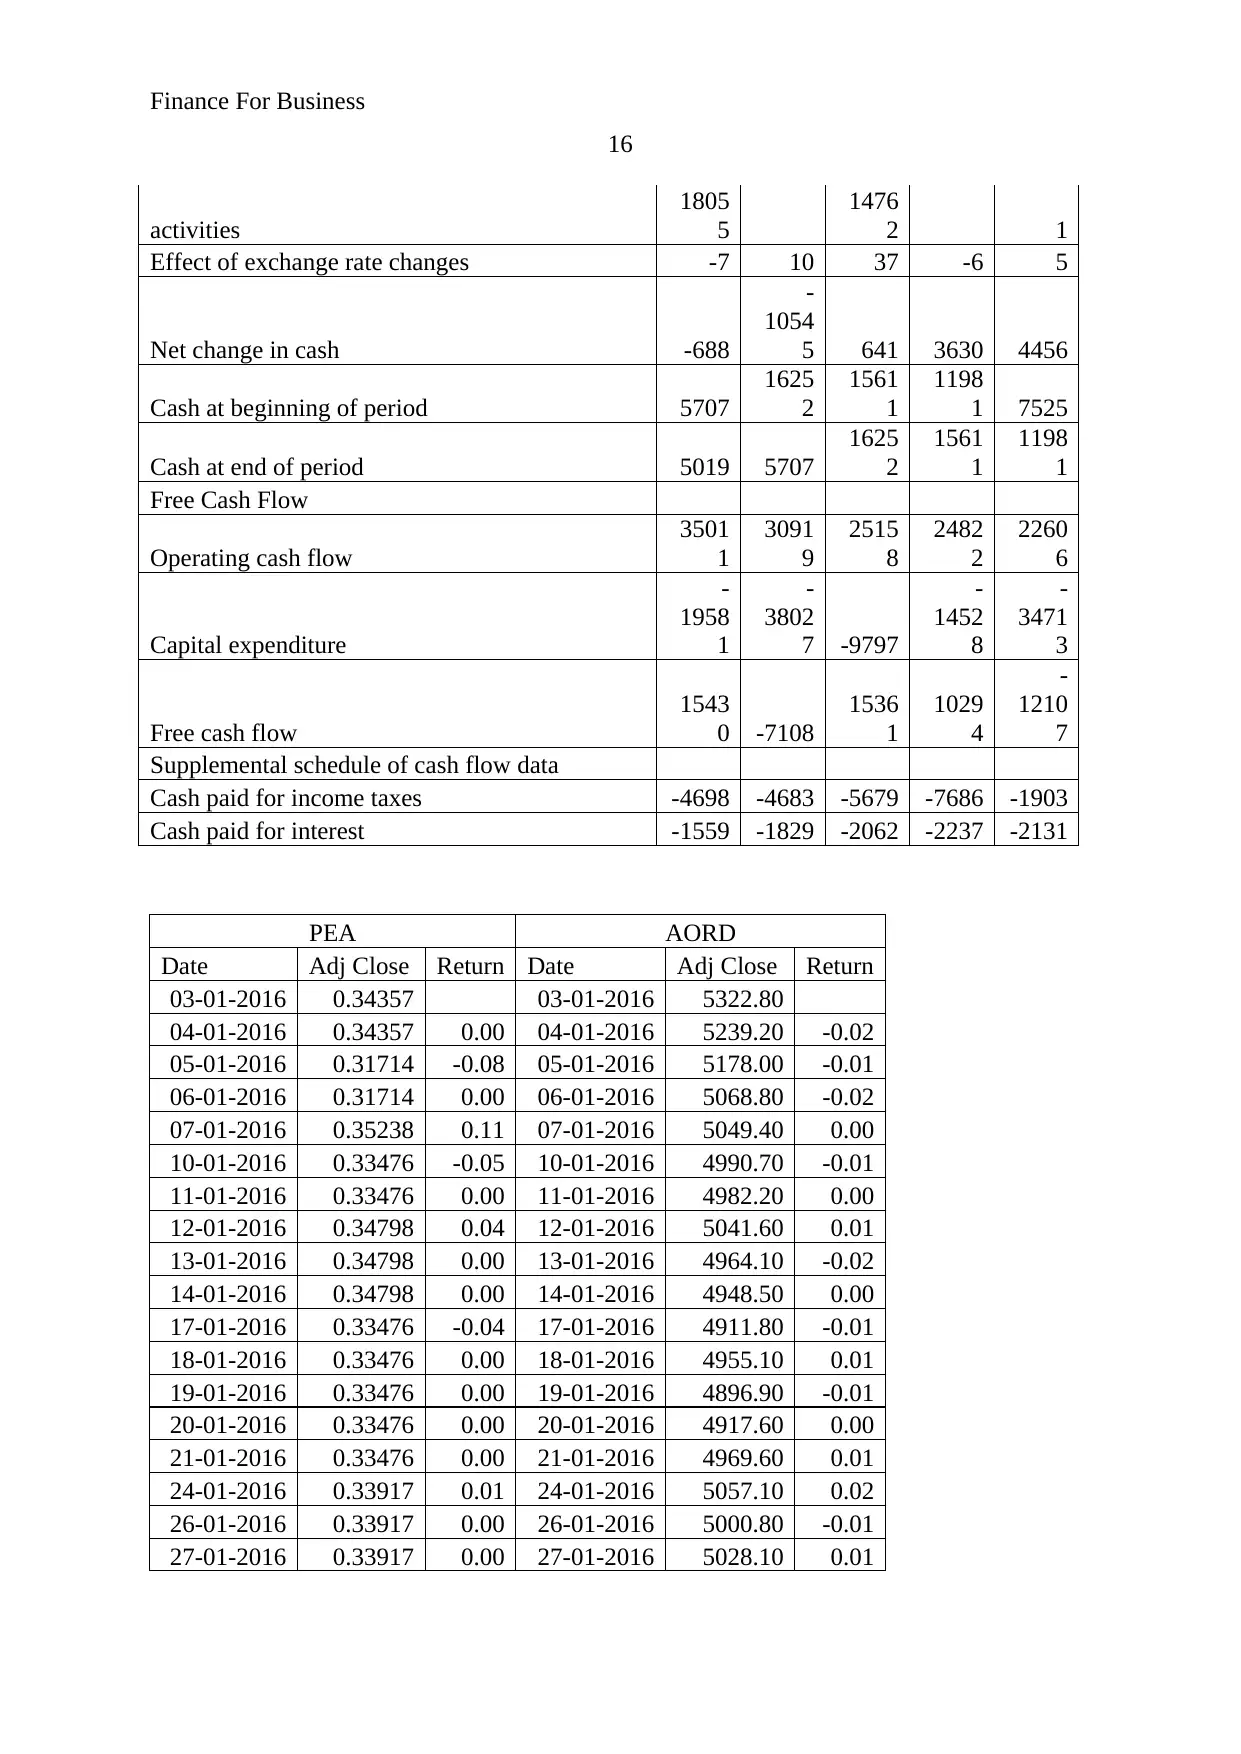
4. Changes in stock price:
Further, the stock prices of the company and the AORD have been compared with each
other to evaluate the correlation among the prices. It explains that the stock prices of PEA are
quite constant but the stock prices of AORD are quite fluctuating in nature. It explains that
the correlation among both the stocks is high. The correlation of both the stock prices is 0.79
which explains that the stock prices of both the stocks impact over each other. Following
graph explains about the relationship and correlation:
6
It explains about the relationship among the capital structure of the company. Further,
the below equation has been solved to evaluate the performance of the company which is as
follows:
EBIT / TA * NPAT / EBIT * TA/ OE = NPAT / OE
(24288/196838)*(16601/24288)*(196838/145098)= (16601/145098)
11.44% 11.44%
(Morningstar, 2018)
TA/OE:
TA/OE plays an important role in the performance and the position of the company.
Through this report, it has been evaluated that the Total assets and the ordinary equity of the
company has been impacted the return on assets and return on equity lot. It explains that the
more the TA/ Te would be the more the ROA/ROE would be.
TA/TE = (NPAT/ Total
assets)/(NPAT/TE)
TA/TE =Total assets/TE
ROA and ROE:
Further, the ROA and ROE has been analyzed and it has been found that the ROA of
an organization is always lower than the ROE of the company. Further, the study over the
ROA and ROE of the company explains that the ROA of the company is 8.43% and ROE of
the company is 11.44% (Shao, Kwok and Guedhami, 2013). ROE is always greater due to a
lower value of equity in the company than the total assets of the company because total assets
are the combination of total liabilities and total equity of the company.
4. Changes in stock price:
Further, the stock prices of the company and the AORD have been compared with each
other to evaluate the correlation among the prices. It explains that the stock prices of PEA are
quite constant but the stock prices of AORD are quite fluctuating in nature. It explains that
the correlation among both the stocks is high. The correlation of both the stock prices is 0.79
which explains that the stock prices of both the stocks impact over each other. Following
graph explains about the relationship and correlation:
Finance For Business
7
(Yahoo Finance, 2018)
Evalaution:
The evalaution study over the PEA stock and AORD stock epxlains that the stock
prices of AORD has more fluctation than the stock of PEA. It epxlains that the PEA dooes
not iampct much over the stock prices of AORD. Further, it epxlains that the correlation
among both the stocks is high (Zhang, 2012). The correlation of both the stock prices is 0.79
which explains that the stock prices of both the stocks impact over each other.
5. Significant factors:
Further, the study has been done over those factors which have impacted over the stock
of the company. It would assist the company to evaluate that why the stock prices have been
up in a while and down in other. This takes place due to various internal and external factors.
Some of them are as follows:
a. Significant management changes:
In the month of march, 2016 the stock prices of the company has been 0.35 from 0.49
all of sudden and this has happened due to the changes in the management.
b. Competitors impact:
Further, the stock price of the company has been lowered so many times due to a bad
position in the competitive market (Tucker, 2011).
c. Analyst forecast:
Paraphrase This Document
Need a fresh take? Get an instant paraphrase of this document with our AI Paraphraser
Finance For Business
8
At the time of Oct, 2017, stock price of the company has been enhanced a lot and this
has taken place due to an announcement about the better position and performance of
entity.
d. Law suits:
Further, various law suits and their decision have also make an impacted over the
performance of the company.
e. Industry wide factors:
Lastly, it has been found that industry factors also make an impact over the stock
prices of the company.
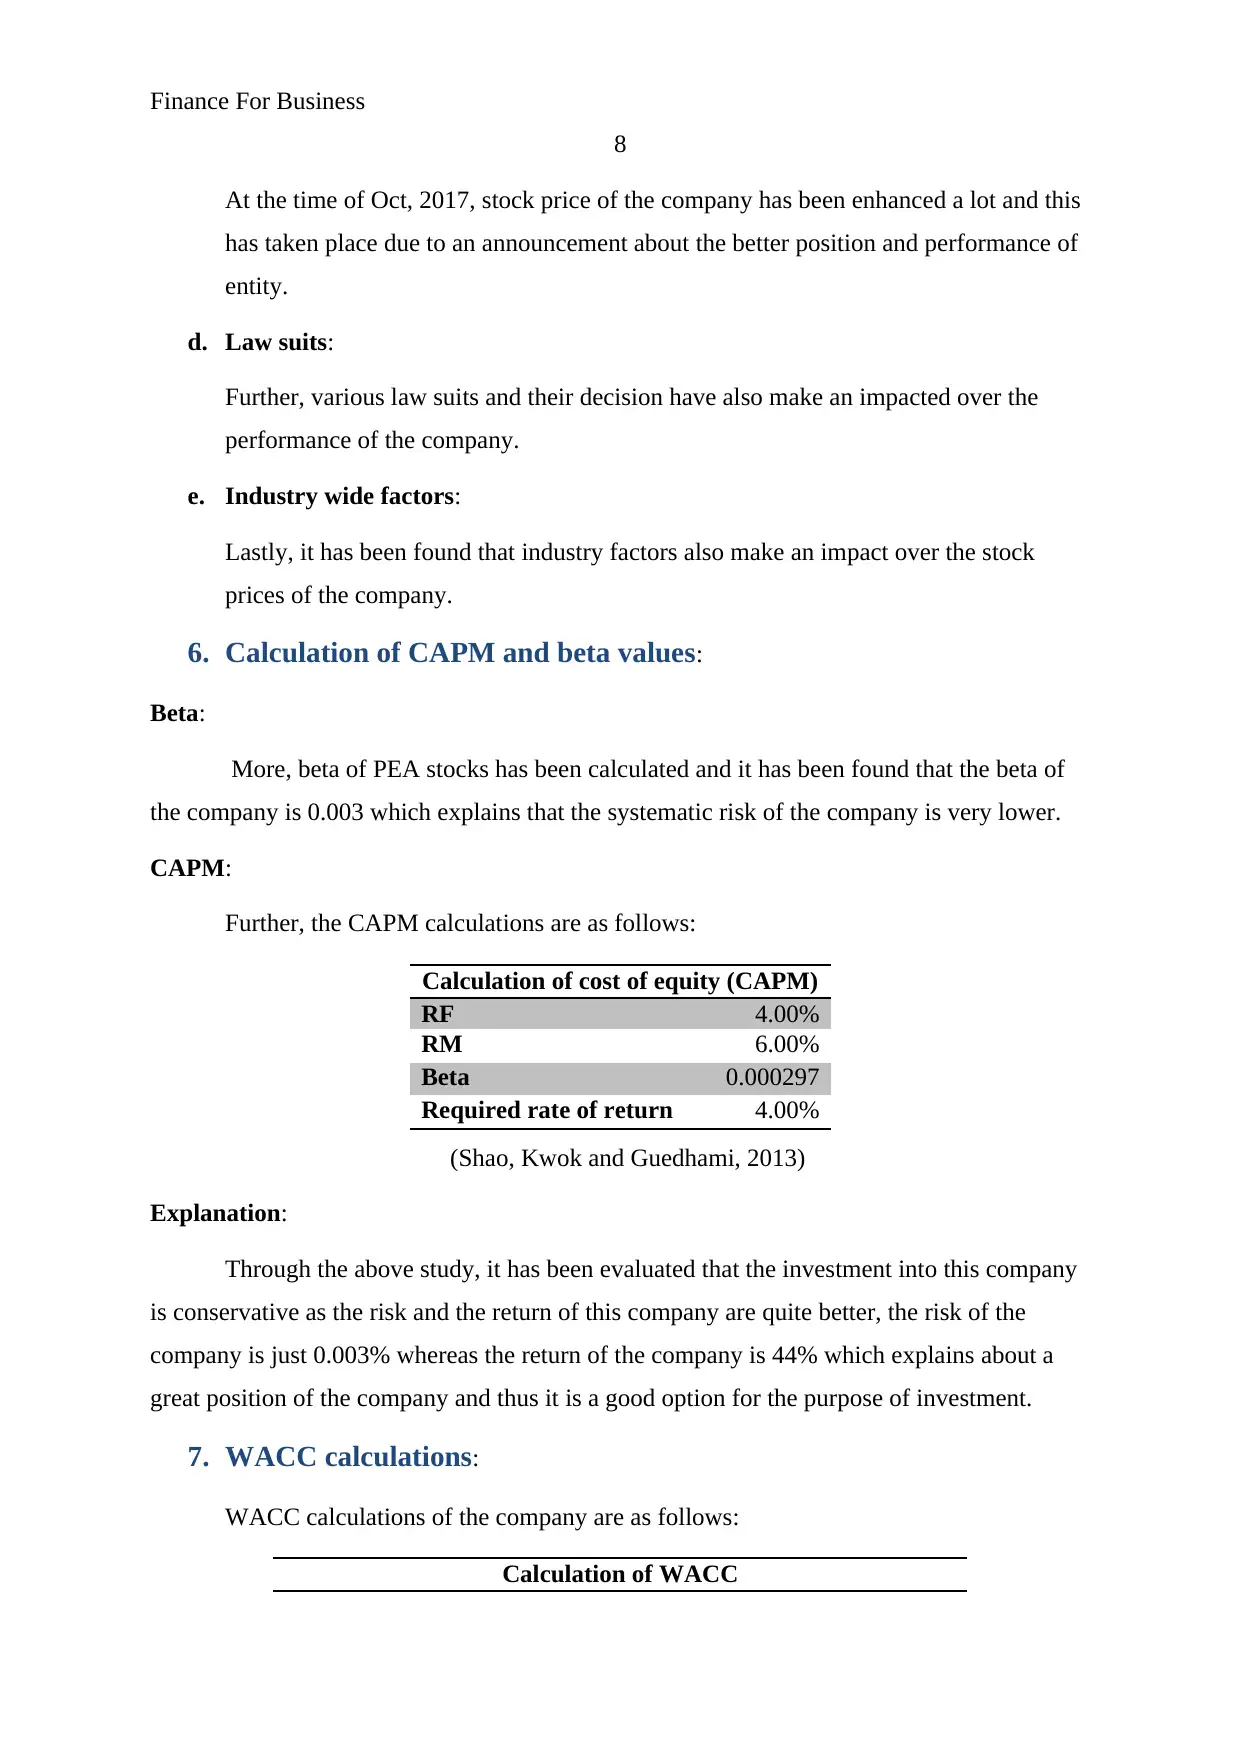
6. Calculation of CAPM and beta values:
Beta:
More, beta of PEA stocks has been calculated and it has been found that the beta of
the company is 0.003 which explains that the systematic risk of the company is very lower.
CAPM:
Further, the CAPM calculations are as follows:
Calculation of cost of equity (CAPM)
RF 4.00%
RM 6.00%
Beta 0.000297
Required rate of return 4.00%
(Shao, Kwok and Guedhami, 2013)
Explanation:
Through the above study, it has been evaluated that the investment into this company
is conservative as the risk and the return of this company are quite better, the risk of the
company is just 0.003% whereas the return of the company is 44% which explains about a
great position of the company and thus it is a good option for the purpose of investment.
7. WACC calculations:
WACC calculations of the company are as follows:
Calculation of WACC
8
At the time of Oct, 2017, stock price of the company has been enhanced a lot and this
has taken place due to an announcement about the better position and performance of
entity.
d. Law suits:
Further, various law suits and their decision have also make an impacted over the
performance of the company.
e. Industry wide factors:
Lastly, it has been found that industry factors also make an impact over the stock
prices of the company.
6. Calculation of CAPM and beta values:
Beta:
More, beta of PEA stocks has been calculated and it has been found that the beta of
the company is 0.003 which explains that the systematic risk of the company is very lower.
CAPM:
Further, the CAPM calculations are as follows:
Calculation of cost of equity (CAPM)
RF 4.00%
RM 6.00%
Beta 0.000297
Required rate of return 4.00%
(Shao, Kwok and Guedhami, 2013)
Explanation:
Through the above study, it has been evaluated that the investment into this company
is conservative as the risk and the return of this company are quite better, the risk of the
company is just 0.003% whereas the return of the company is 44% which explains about a
great position of the company and thus it is a good option for the purpose of investment.
7. WACC calculations:
WACC calculations of the company are as follows:
Calculation of WACC
Finance For Business
9
Price Cost Weight WACC
Debt 23,901 3.50% 0.17656 0.00618
Equity 1,11,472 4.00% 0.82344 0.03294
1,35,373 Kd 3.91%
Calculation of cost of debt
Outstanding debt 23,901
interest rate 5%
Tax rate 0.3
Kd 3.50%
Calculation of cost of equity
(CAPM)
RF 4.00%
RM 6.00%
Beta 0.03%
Required rate of return 4.00%
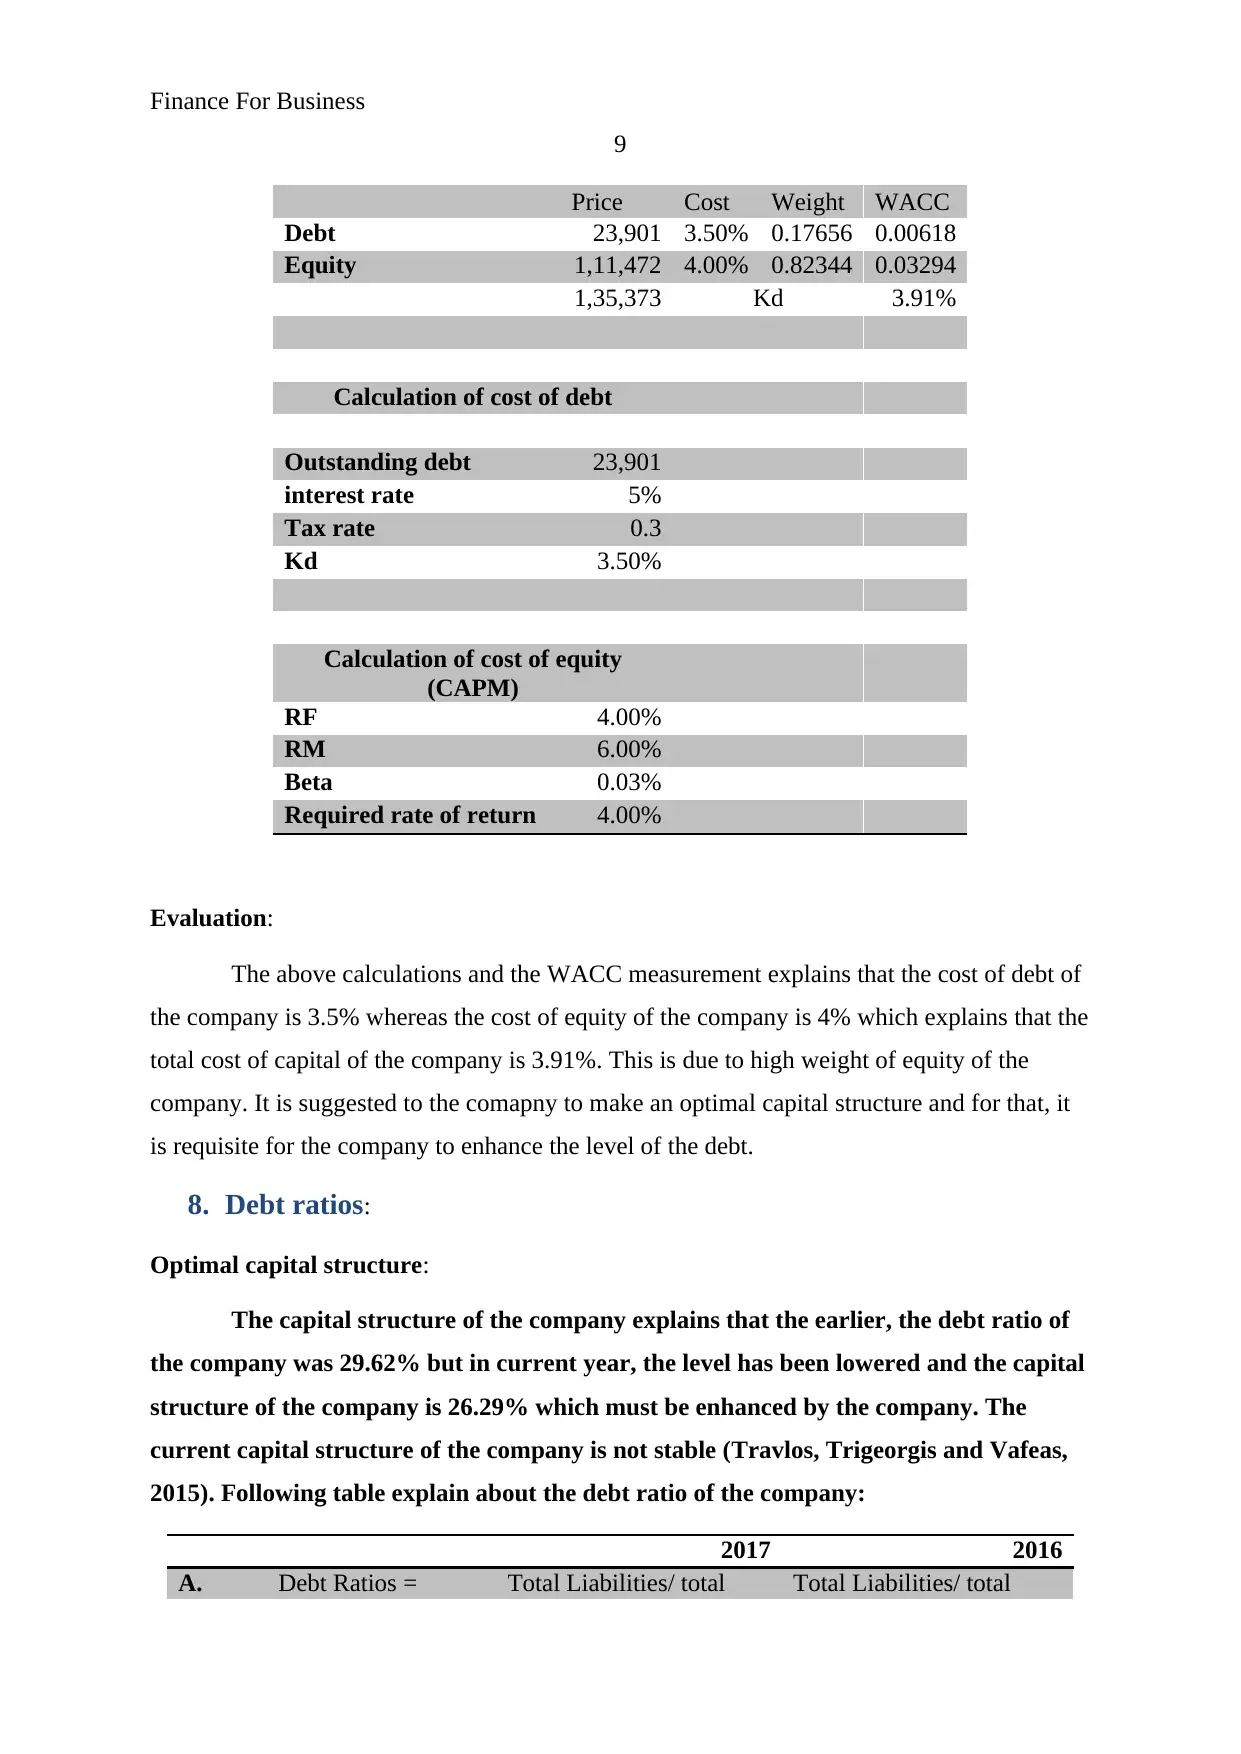
Evaluation:
The above calculations and the WACC measurement explains that the cost of debt of
the company is 3.5% whereas the cost of equity of the company is 4% which explains that the
total cost of capital of the company is 3.91%. This is due to high weight of equity of the
company. It is suggested to the comapny to make an optimal capital structure and for that, it
is requisite for the company to enhance the level of the debt.
8. Debt ratios:
Optimal capital structure:
The capital structure of the company explains that the earlier, the debt ratio of
the company was 29.62% but in current year, the level has been lowered and the capital
structure of the company is 26.29% which must be enhanced by the company. The
current capital structure of the company is not stable (Travlos, Trigeorgis and Vafeas,
2015). Following table explain about the debt ratio of the company:
2017 2016
A. Debt Ratios = Total Liabilities/ total Total Liabilities/ total
9
Price Cost Weight WACC
Debt 23,901 3.50% 0.17656 0.00618
Equity 1,11,472 4.00% 0.82344 0.03294
1,35,373 Kd 3.91%
Calculation of cost of debt
Outstanding debt 23,901
interest rate 5%
Tax rate 0.3
Kd 3.50%
Calculation of cost of equity
(CAPM)
RF 4.00%
RM 6.00%
Beta 0.03%
Required rate of return 4.00%
Evaluation:
The above calculations and the WACC measurement explains that the cost of debt of
the company is 3.5% whereas the cost of equity of the company is 4% which explains that the
total cost of capital of the company is 3.91%. This is due to high weight of equity of the
company. It is suggested to the comapny to make an optimal capital structure and for that, it
is requisite for the company to enhance the level of the debt.
8. Debt ratios:
Optimal capital structure:
The capital structure of the company explains that the earlier, the debt ratio of
the company was 29.62% but in current year, the level has been lowered and the capital
structure of the company is 26.29% which must be enhanced by the company. The
current capital structure of the company is not stable (Travlos, Trigeorgis and Vafeas,
2015). Following table explain about the debt ratio of the company:
2017 2016
A. Debt Ratios = Total Liabilities/ total Total Liabilities/ total
Finance For Business
10
assets assets
51740/196838 57597/194434
26.29% 29.62%
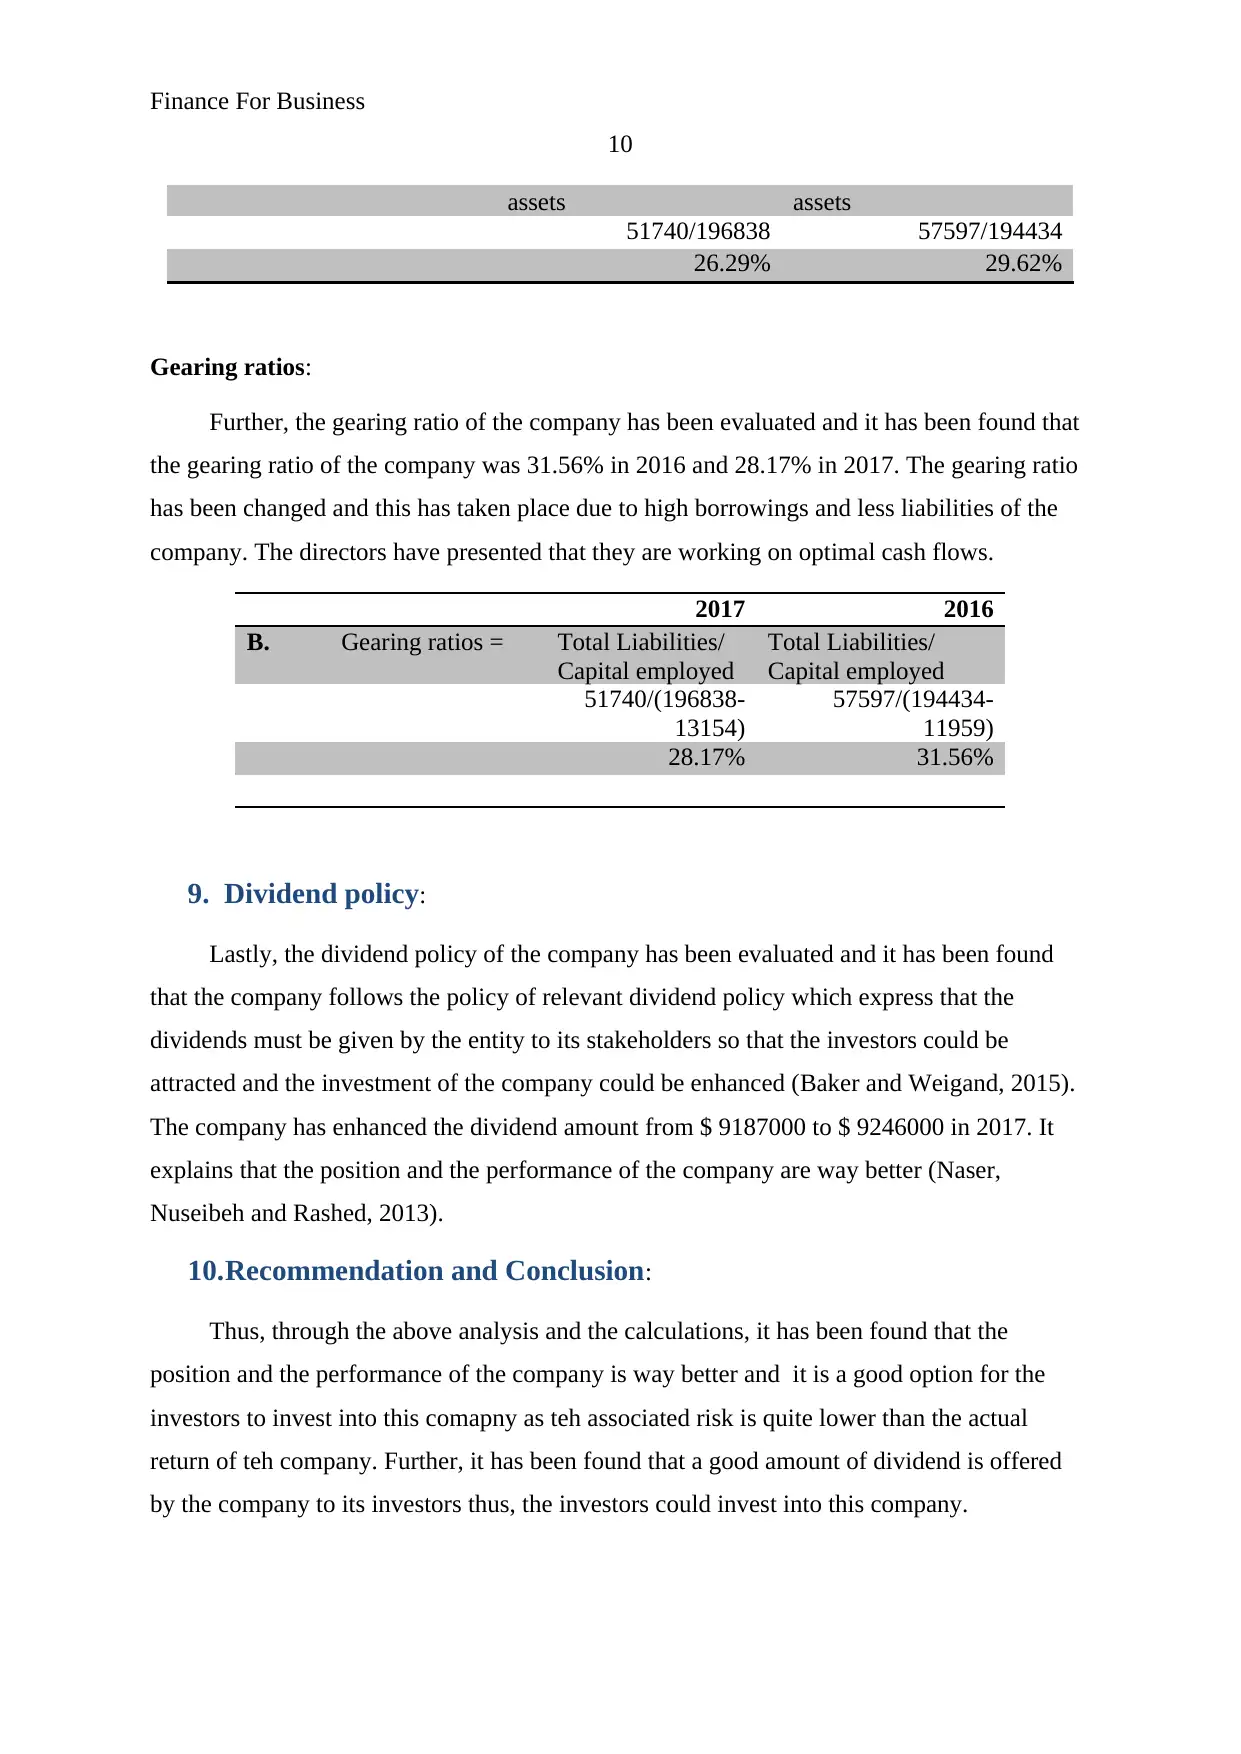
Gearing ratios:
Further, the gearing ratio of the company has been evaluated and it has been found that
the gearing ratio of the company was 31.56% in 2016 and 28.17% in 2017. The gearing ratio
has been changed and this has taken place due to high borrowings and less liabilities of the
company. The directors have presented that they are working on optimal cash flows.
2017 2016
B. Gearing ratios = Total Liabilities/
Capital employed
Total Liabilities/
Capital employed
51740/(196838-
13154)
57597/(194434-
11959)
28.17% 31.56%
9. Dividend policy:
Lastly, the dividend policy of the company has been evaluated and it has been found
that the company follows the policy of relevant dividend policy which express that the
dividends must be given by the entity to its stakeholders so that the investors could be
attracted and the investment of the company could be enhanced (Baker and Weigand, 2015).
The company has enhanced the dividend amount from $ 9187000 to $ 9246000 in 2017. It
explains that the position and the performance of the company are way better (Naser,
Nuseibeh and Rashed, 2013).
10.Recommendation and Conclusion:
Thus, through the above analysis and the calculations, it has been found that the
position and the performance of the company is way better and it is a good option for the
investors to invest into this comapny as teh associated risk is quite lower than the actual
return of teh company. Further, it has been found that a good amount of dividend is offered
by the company to its investors thus, the investors could invest into this company.
10
assets assets
51740/196838 57597/194434
26.29% 29.62%
Gearing ratios:
Further, the gearing ratio of the company has been evaluated and it has been found that
the gearing ratio of the company was 31.56% in 2016 and 28.17% in 2017. The gearing ratio
has been changed and this has taken place due to high borrowings and less liabilities of the
company. The directors have presented that they are working on optimal cash flows.
2017 2016
B. Gearing ratios = Total Liabilities/
Capital employed
Total Liabilities/
Capital employed
51740/(196838-
13154)
57597/(194434-
11959)
28.17% 31.56%
9. Dividend policy:
Lastly, the dividend policy of the company has been evaluated and it has been found
that the company follows the policy of relevant dividend policy which express that the
dividends must be given by the entity to its stakeholders so that the investors could be
attracted and the investment of the company could be enhanced (Baker and Weigand, 2015).
The company has enhanced the dividend amount from $ 9187000 to $ 9246000 in 2017. It
explains that the position and the performance of the company are way better (Naser,
Nuseibeh and Rashed, 2013).
10.Recommendation and Conclusion:
Thus, through the above analysis and the calculations, it has been found that the
position and the performance of the company is way better and it is a good option for the
investors to invest into this comapny as teh associated risk is quite lower than the actual
return of teh company. Further, it has been found that a good amount of dividend is offered
by the company to its investors thus, the investors could invest into this company.
Secure Best Marks with AI Grader
Need help grading? Try our AI Grader for instant feedback on your assignments.
Finance For Business
11
References:
Baker, H.K. and Weigand, R., 2015. Corporate dividend policy revisited. Managerial
Finance, 41(2), pp.126-144.
Barman, G.P., 2008. An evaluation of how dividend policies impact on the share value of
selected companies.
Brealey, R., Myers, S.C. and Marcus, A.J., 2007. FundamentalsofCorporate Finance. Mc
Graw Hill, New York.
Breuer, W., Rieger, M.O. and Soypak, K.C., 2014. The behavioral foundations of corporate
dividend policy a cross-country analysis. Journal of Banking & Finance, 42, pp.247-265.
Naser, K., Nuseibeh, R. and Rashed, W., 2013. Managers' perception of dividend policy:
Evidence from companies listed on Abu Dhabi Securities Exchange. Issues in Business
Management and Economics, 1(1), pp.001-012.
Shao, L., Kwok, C.C. and Guedhami, O., 2013. DIVIDEND POLICY: BALANCING
SHAREHOLDERS'AND CREDITORS'INTERESTS. Journal of Financial Research, 36(1),
pp.43-66.
Travlos, N.G., Trigeorgis, L. and Vafeas, N., 2015. Shareholder wealth effects of dividend
policy changes in an emerging stock market: The case of Cyprus.
Tucker, J.W., 2011. Selection bias and econometric remedies in accounting and finance
research.
Zhang, D., 2012. Managerial dividend-paying incentives. Erasmus University Rotterdam.
Annual report. 2017. Pacific Energy Limited. viewed Jan 22, 2018,
http://www.pacificenergy.com.au/images/files/asx-announcements/2016/2PEAR2016Final.pd
f
Yahoo Finance. 2017. Pacific Energy Limited. viewed Jan 22, 2018,
https://au.finance.yahoo.com/quote/PEA.AX/history?
period1=1451586600&period2=1514745000&interval=1d&filter=history&frequency=1d
Finance For Business
12
Morningstar. 2017. Pacific Energy Limited. viewed Jan 22, 2018,
http://financials.morningstar.com/cash-flow/cf.html?t=PEA®ion=aus&culture=en-US
12
Morningstar. 2017. Pacific Energy Limited. viewed Jan 22, 2018,
http://financials.morningstar.com/cash-flow/cf.html?t=PEA®ion=aus&culture=en-US
Finance For Business
13
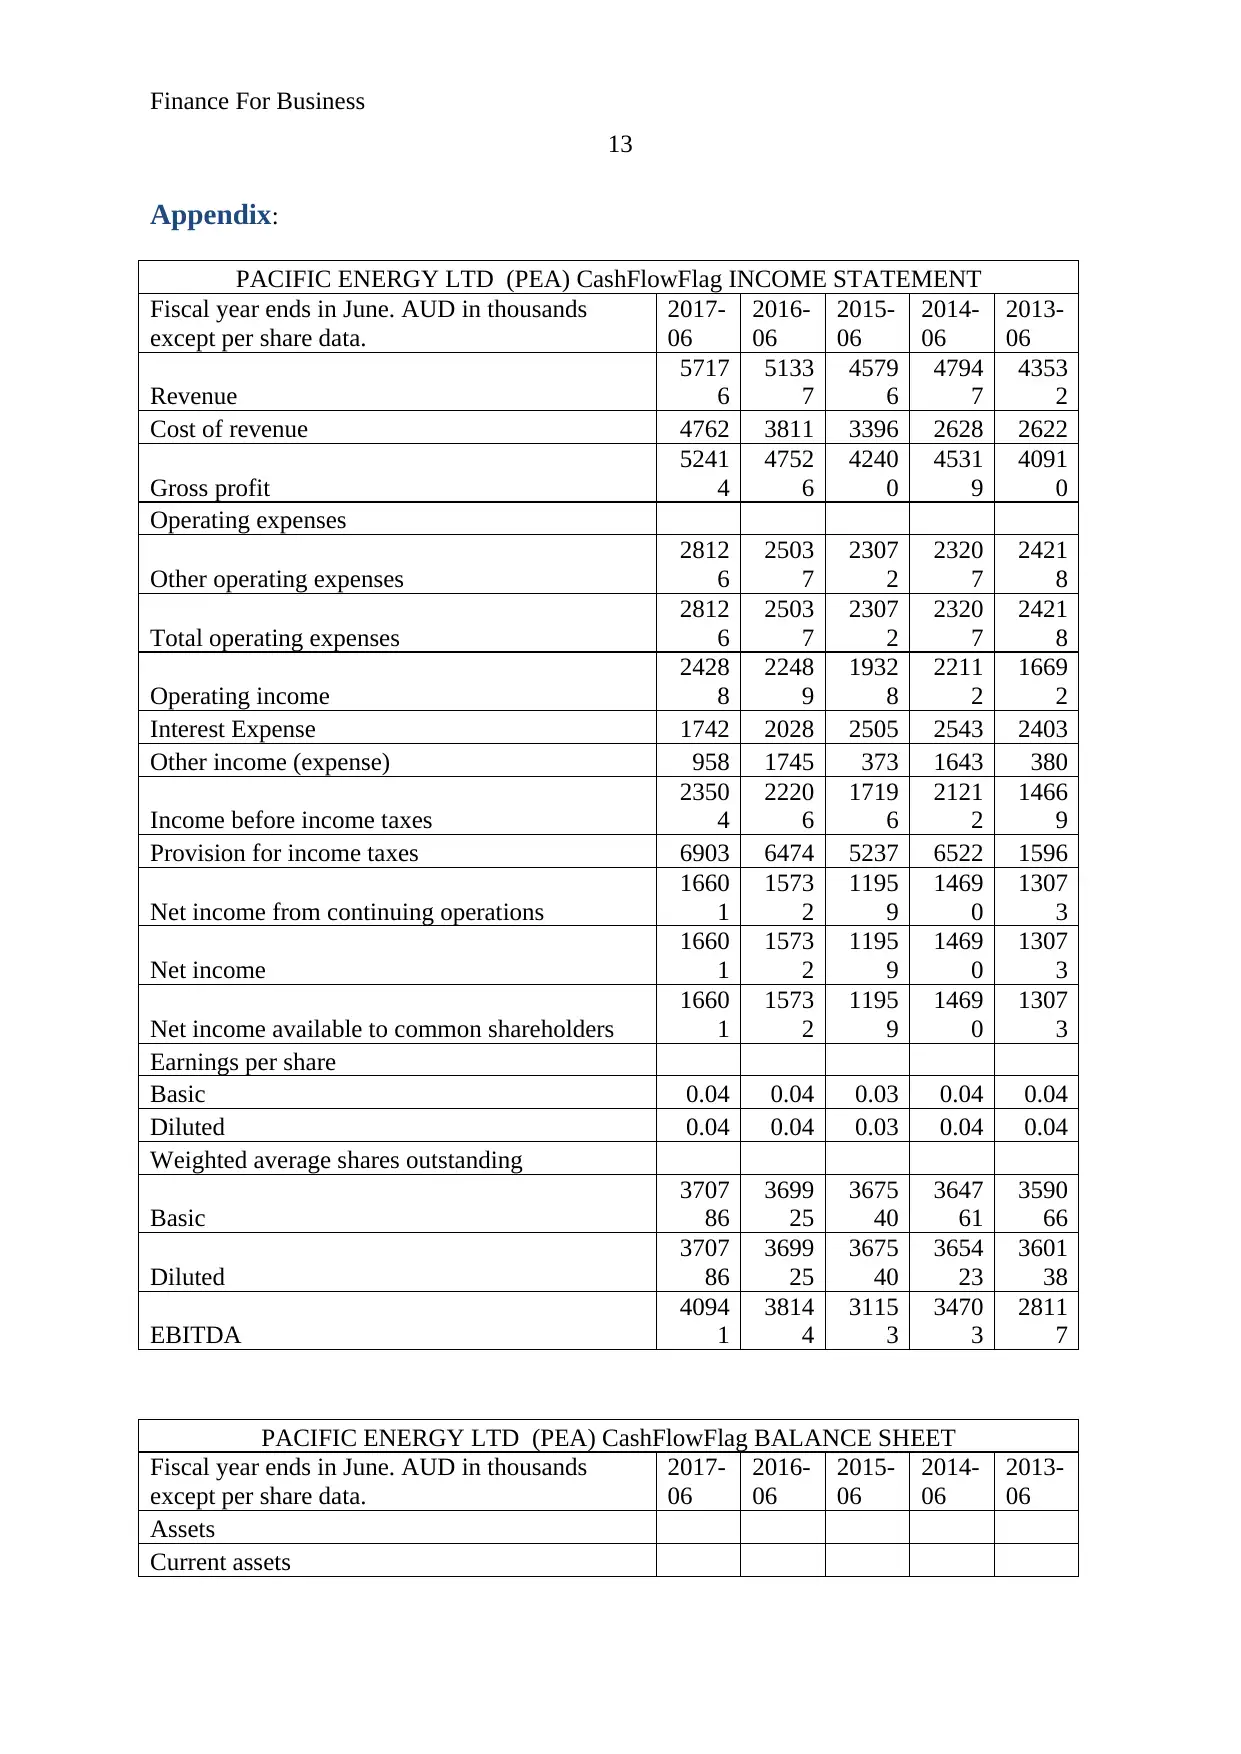
Appendix:
PACIFIC ENERGY LTD (PEA) CashFlowFlag INCOME STATEMENT
Fiscal year ends in June. AUD in thousands
except per share data.
2017-
06
2016-
06
2015-
06
2014-
06
2013-
06
Revenue
5717
6
5133
7
4579
6
4794
7
4353
2
Cost of revenue 4762 3811 3396 2628 2622
Gross profit
5241
4
4752
6
4240
0
4531
9
4091
0
Operating expenses
Other operating expenses
2812
6
2503
7
2307
2
2320
7
2421
8
Total operating expenses
2812
6
2503
7
2307
2
2320
7
2421
8
Operating income
2428
8
2248
9
1932
8
2211
2
1669
2
Interest Expense 1742 2028 2505 2543 2403
Other income (expense) 958 1745 373 1643 380
Income before income taxes
2350
4
2220
6
1719
6
2121
2
1466
9
Provision for income taxes 6903 6474 5237 6522 1596
Net income from continuing operations
1660
1
1573
2
1195
9
1469
0
1307
3
Net income
1660
1
1573
2
1195
9
1469
0
1307
3
Net income available to common shareholders
1660
1
1573
2
1195
9
1469
0
1307
3
Earnings per share
Basic 0.04 0.04 0.03 0.04 0.04
Diluted 0.04 0.04 0.03 0.04 0.04
Weighted average shares outstanding
Basic
3707
86
3699
25
3675
40
3647
61
3590
66
Diluted
3707
86
3699
25
3675
40
3654
23
3601
38
EBITDA
4094
1
3814
4
3115
3
3470
3
2811
7
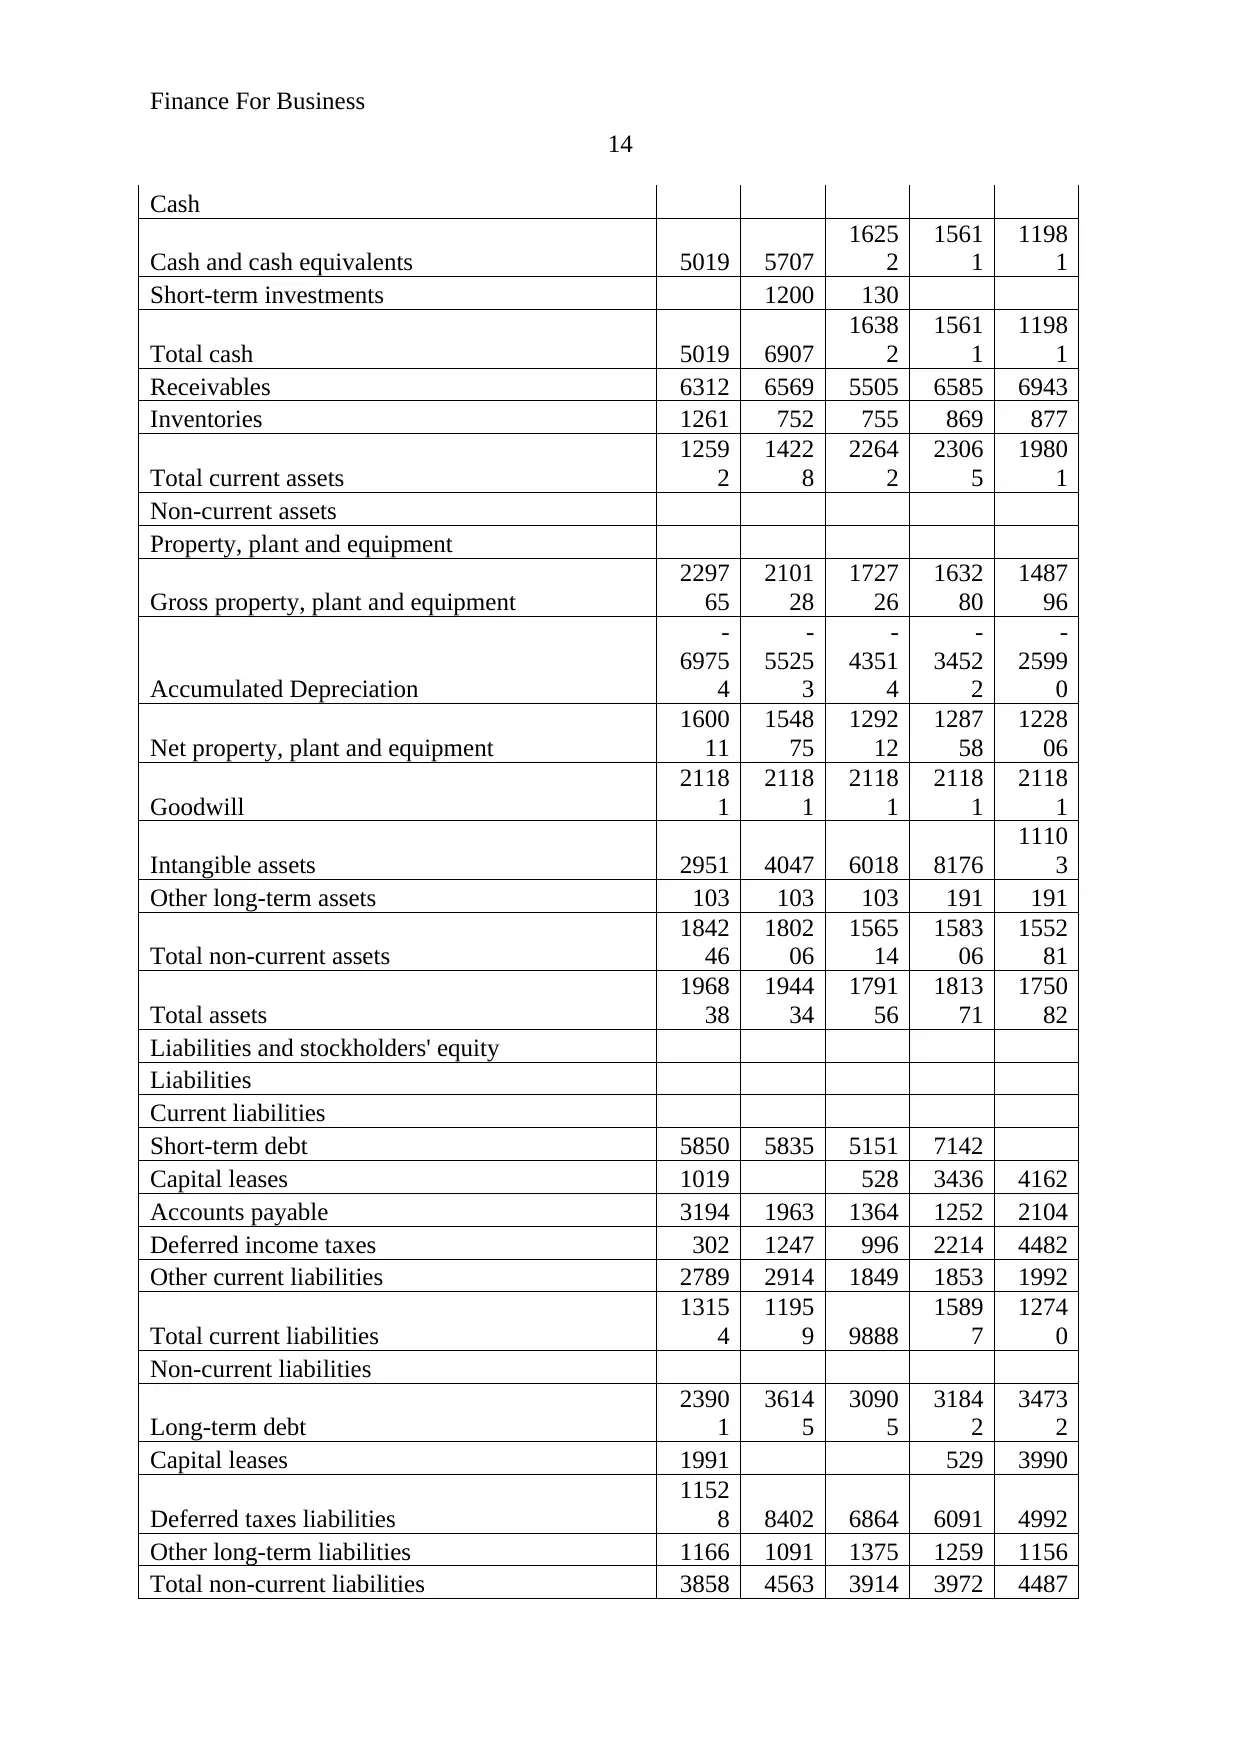
PACIFIC ENERGY LTD (PEA) CashFlowFlag BALANCE SHEET
Fiscal year ends in June. AUD in thousands
except per share data.
2017-
06
2016-
06
2015-
06
2014-
06
2013-
06
Assets
Current assets
13
Appendix:
PACIFIC ENERGY LTD (PEA) CashFlowFlag INCOME STATEMENT
Fiscal year ends in June. AUD in thousands
except per share data.
2017-
06
2016-
06
2015-
06
2014-
06
2013-
06
Revenue
5717
6
5133
7
4579
6
4794
7
4353
2
Cost of revenue 4762 3811 3396 2628 2622
Gross profit
5241
4
4752
6
4240
0
4531
9
4091
0
Operating expenses
Other operating expenses
2812
6
2503
7
2307
2
2320
7
2421
8
Total operating expenses
2812
6
2503
7
2307
2
2320
7
2421
8
Operating income
2428
8
2248
9
1932
8
2211
2
1669
2
Interest Expense 1742 2028 2505 2543 2403
Other income (expense) 958 1745 373 1643 380
Income before income taxes
2350
4
2220
6
1719
6
2121
2
1466
9
Provision for income taxes 6903 6474 5237 6522 1596
Net income from continuing operations
1660
1
1573
2
1195
9
1469
0
1307
3
Net income
1660
1
1573
2
1195
9
1469
0
1307
3
Net income available to common shareholders
1660
1
1573
2
1195
9
1469
0
1307
3
Earnings per share
Basic 0.04 0.04 0.03 0.04 0.04
Diluted 0.04 0.04 0.03 0.04 0.04
Weighted average shares outstanding
Basic
3707
86
3699
25
3675
40
3647
61
3590
66
Diluted
3707
86
3699
25
3675
40
3654
23
3601
38
EBITDA
4094
1
3814
4
3115
3
3470
3
2811
7
PACIFIC ENERGY LTD (PEA) CashFlowFlag BALANCE SHEET
Fiscal year ends in June. AUD in thousands
except per share data.
2017-
06
2016-
06
2015-
06
2014-
06
2013-
06
Assets
Current assets
Paraphrase This Document
Need a fresh take? Get an instant paraphrase of this document with our AI Paraphraser
Finance For Business
14
Cash
Cash and cash equivalents 5019 5707
1625
2
1561
1
1198
1
Short-term investments 1200 130
Total cash 5019 6907
1638
2
1561
1
1198
1
Receivables 6312 6569 5505 6585 6943
Inventories 1261 752 755 869 877
Total current assets
1259
2
1422
8
2264
2
2306
5
1980
1
Non-current assets
Property, plant and equipment
Gross property, plant and equipment
2297
65
2101
28
1727
26
1632
80
1487
96
Accumulated Depreciation
-
6975
4
-
5525
3
-
4351
4
-
3452
2
-
2599
0
Net property, plant and equipment
1600
11
1548
75
1292
12
1287
58
1228
06
Goodwill
2118
1
2118
1
2118
1
2118
1
2118
1
Intangible assets 2951 4047 6018 8176
1110
3
Other long-term assets 103 103 103 191 191
Total non-current assets
1842
46
1802
06
1565
14
1583
06
1552
81
Total assets
1968
38
1944
34
1791
56
1813
71
1750
82
Liabilities and stockholders' equity
Liabilities
Current liabilities
Short-term debt 5850 5835 5151 7142
Capital leases 1019 528 3436 4162
Accounts payable 3194 1963 1364 1252 2104
Deferred income taxes 302 1247 996 2214 4482
Other current liabilities 2789 2914 1849 1853 1992
Total current liabilities
1315
4
1195
9 9888
1589
7
1274
0
Non-current liabilities
Long-term debt
2390
1
3614
5
3090
5
3184
2
3473
2
Capital leases 1991 529 3990
Deferred taxes liabilities
1152
8 8402 6864 6091 4992
Other long-term liabilities 1166 1091 1375 1259 1156
Total non-current liabilities 3858 4563 3914 3972 4487
14
Cash
Cash and cash equivalents 5019 5707
1625
2
1561
1
1198
1
Short-term investments 1200 130
Total cash 5019 6907
1638
2
1561
1
1198
1
Receivables 6312 6569 5505 6585 6943
Inventories 1261 752 755 869 877
Total current assets
1259
2
1422
8
2264
2
2306
5
1980
1
Non-current assets
Property, plant and equipment
Gross property, plant and equipment
2297
65
2101
28
1727
26
1632
80
1487
96
Accumulated Depreciation
-
6975
4
-
5525
3
-
4351
4
-
3452
2
-
2599
0
Net property, plant and equipment
1600
11
1548
75
1292
12
1287
58
1228
06
Goodwill
2118
1
2118
1
2118
1
2118
1
2118
1
Intangible assets 2951 4047 6018 8176
1110
3
Other long-term assets 103 103 103 191 191
Total non-current assets
1842
46
1802
06
1565
14
1583
06
1552
81
Total assets
1968
38
1944
34
1791
56
1813
71
1750
82
Liabilities and stockholders' equity
Liabilities
Current liabilities
Short-term debt 5850 5835 5151 7142
Capital leases 1019 528 3436 4162
Accounts payable 3194 1963 1364 1252 2104
Deferred income taxes 302 1247 996 2214 4482
Other current liabilities 2789 2914 1849 1853 1992
Total current liabilities
1315
4
1195
9 9888
1589
7
1274
0
Non-current liabilities
Long-term debt
2390
1
3614
5
3090
5
3184
2
3473
2
Capital leases 1991 529 3990
Deferred taxes liabilities
1152
8 8402 6864 6091 4992
Other long-term liabilities 1166 1091 1375 1259 1156
Total non-current liabilities 3858 4563 3914 3972 4487
Finance For Business
15
6 8 4 1 0
Total liabilities
5174
0
5759
7
4903
2
5561
8
5761
0
stockholders' equity
Common stock
1114
72
1103
18
1101
48
1083
74
1069
80
Retained earnings
3378
5
2634
6
2091
9
1812
3
1072
8
Accumulated other comprehensive income -159 173 -943 -744 -236
Total stockholders' equity
1450
98
1368
37
1301
24
1257
53
1174
72
Total liabilities and stockholders' equity
1968
38
1944
34
1791
56
1813
71
1750
82
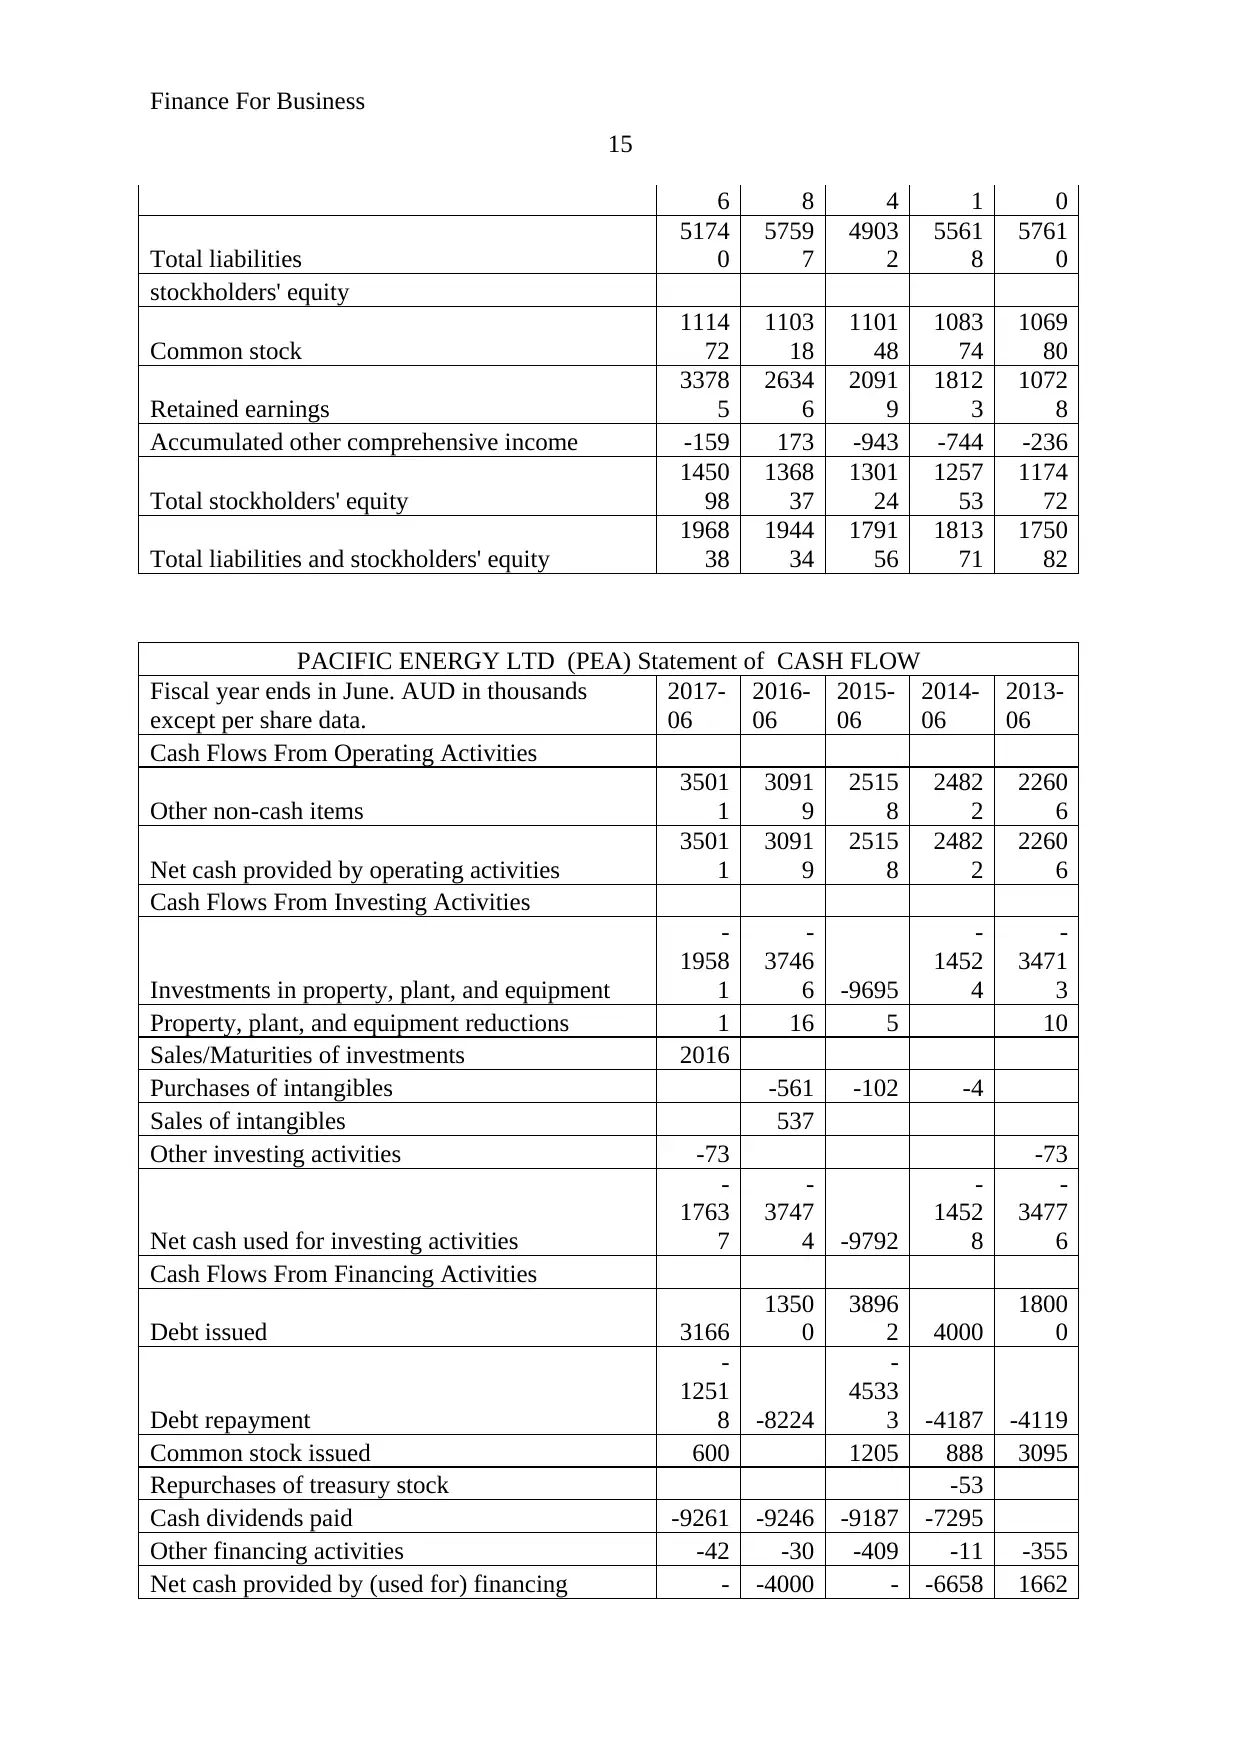
PACIFIC ENERGY LTD (PEA) Statement of CASH FLOW
Fiscal year ends in June. AUD in thousands
except per share data.
2017-
06
2016-
06
2015-
06
2014-
06
2013-
06
Cash Flows From Operating Activities
Other non-cash items
3501
1
3091
9
2515
8
2482
2
2260
6
Net cash provided by operating activities
3501
1
3091
9
2515
8
2482
2
2260
6
Cash Flows From Investing Activities
Investments in property, plant, and equipment
-
1958
1
-
3746
6 -9695
-
1452
4
-
3471
3
Property, plant, and equipment reductions 1 16 5 10
Sales/Maturities of investments 2016
Purchases of intangibles -561 -102 -4
Sales of intangibles 537
Other investing activities -73 -73
Net cash used for investing activities
-
1763
7
-
3747
4 -9792
-
1452
8
-
3477
6
Cash Flows From Financing Activities
Debt issued 3166
1350
0
3896
2 4000
1800
0
Debt repayment
-
1251
8 -8224
-
4533
3 -4187 -4119
Common stock issued 600 1205 888 3095
Repurchases of treasury stock -53
Cash dividends paid -9261 -9246 -9187 -7295
Other financing activities -42 -30 -409 -11 -355
Net cash provided by (used for) financing - -4000 - -6658 1662
15
6 8 4 1 0
Total liabilities
5174
0
5759
7
4903
2
5561
8
5761
0
stockholders' equity
Common stock
1114
72
1103
18
1101
48
1083
74
1069
80
Retained earnings
3378
5
2634
6
2091
9
1812
3
1072
8
Accumulated other comprehensive income -159 173 -943 -744 -236
Total stockholders' equity
1450
98
1368
37
1301
24
1257
53
1174
72
Total liabilities and stockholders' equity
1968
38
1944
34
1791
56
1813
71
1750
82
PACIFIC ENERGY LTD (PEA) Statement of CASH FLOW
Fiscal year ends in June. AUD in thousands
except per share data.
2017-
06
2016-
06
2015-
06
2014-
06
2013-
06
Cash Flows From Operating Activities
Other non-cash items
3501
1
3091
9
2515
8
2482
2
2260
6
Net cash provided by operating activities
3501
1
3091
9
2515
8
2482
2
2260
6
Cash Flows From Investing Activities
Investments in property, plant, and equipment
-
1958
1
-
3746
6 -9695
-
1452
4
-
3471
3
Property, plant, and equipment reductions 1 16 5 10
Sales/Maturities of investments 2016
Purchases of intangibles -561 -102 -4
Sales of intangibles 537
Other investing activities -73 -73
Net cash used for investing activities
-
1763
7
-
3747
4 -9792
-
1452
8
-
3477
6
Cash Flows From Financing Activities
Debt issued 3166
1350
0
3896
2 4000
1800
0
Debt repayment
-
1251
8 -8224
-
4533
3 -4187 -4119
Common stock issued 600 1205 888 3095
Repurchases of treasury stock -53
Cash dividends paid -9261 -9246 -9187 -7295
Other financing activities -42 -30 -409 -11 -355
Net cash provided by (used for) financing - -4000 - -6658 1662
Finance For Business
16
activities
1805
5
1476
2 1
Effect of exchange rate changes -7 10 37 -6 5
Net change in cash -688
-
1054
5 641 3630 4456
Cash at beginning of period 5707
1625
2
1561
1
1198
1 7525
Cash at end of period 5019 5707
1625
2
1561
1
1198
1
Free Cash Flow
Operating cash flow
3501
1
3091
9
2515
8
2482
2
2260
6
Capital expenditure
-
1958
1
-
3802
7 -9797
-
1452
8
-
3471
3
Free cash flow
1543
0 -7108
1536
1
1029
4
-
1210
7
Supplemental schedule of cash flow data
Cash paid for income taxes -4698 -4683 -5679 -7686 -1903
Cash paid for interest -1559 -1829 -2062 -2237 -2131
PEA AORD
Date Adj Close Return Date Adj Close Return
03-01-2016 0.34357 03-01-2016 5322.80
04-01-2016 0.34357 0.00 04-01-2016 5239.20 -0.02
05-01-2016 0.31714 -0.08 05-01-2016 5178.00 -0.01
06-01-2016 0.31714 0.00 06-01-2016 5068.80 -0.02
07-01-2016 0.35238 0.11 07-01-2016 5049.40 0.00
10-01-2016 0.33476 -0.05 10-01-2016 4990.70 -0.01
11-01-2016 0.33476 0.00 11-01-2016 4982.20 0.00
12-01-2016 0.34798 0.04 12-01-2016 5041.60 0.01
13-01-2016 0.34798 0.00 13-01-2016 4964.10 -0.02
14-01-2016 0.34798 0.00 14-01-2016 4948.50 0.00
17-01-2016 0.33476 -0.04 17-01-2016 4911.80 -0.01
18-01-2016 0.33476 0.00 18-01-2016 4955.10 0.01
19-01-2016 0.33476 0.00 19-01-2016 4896.90 -0.01
20-01-2016 0.33476 0.00 20-01-2016 4917.60 0.00
21-01-2016 0.33476 0.00 21-01-2016 4969.60 0.01
24-01-2016 0.33917 0.01 24-01-2016 5057.10 0.02
26-01-2016 0.33917 0.00 26-01-2016 5000.80 -0.01
27-01-2016 0.33917 0.00 27-01-2016 5028.10 0.01
Secure Best Marks with AI Grader
Need help grading? Try our AI Grader for instant feedback on your assignments.
Finance For Business
17
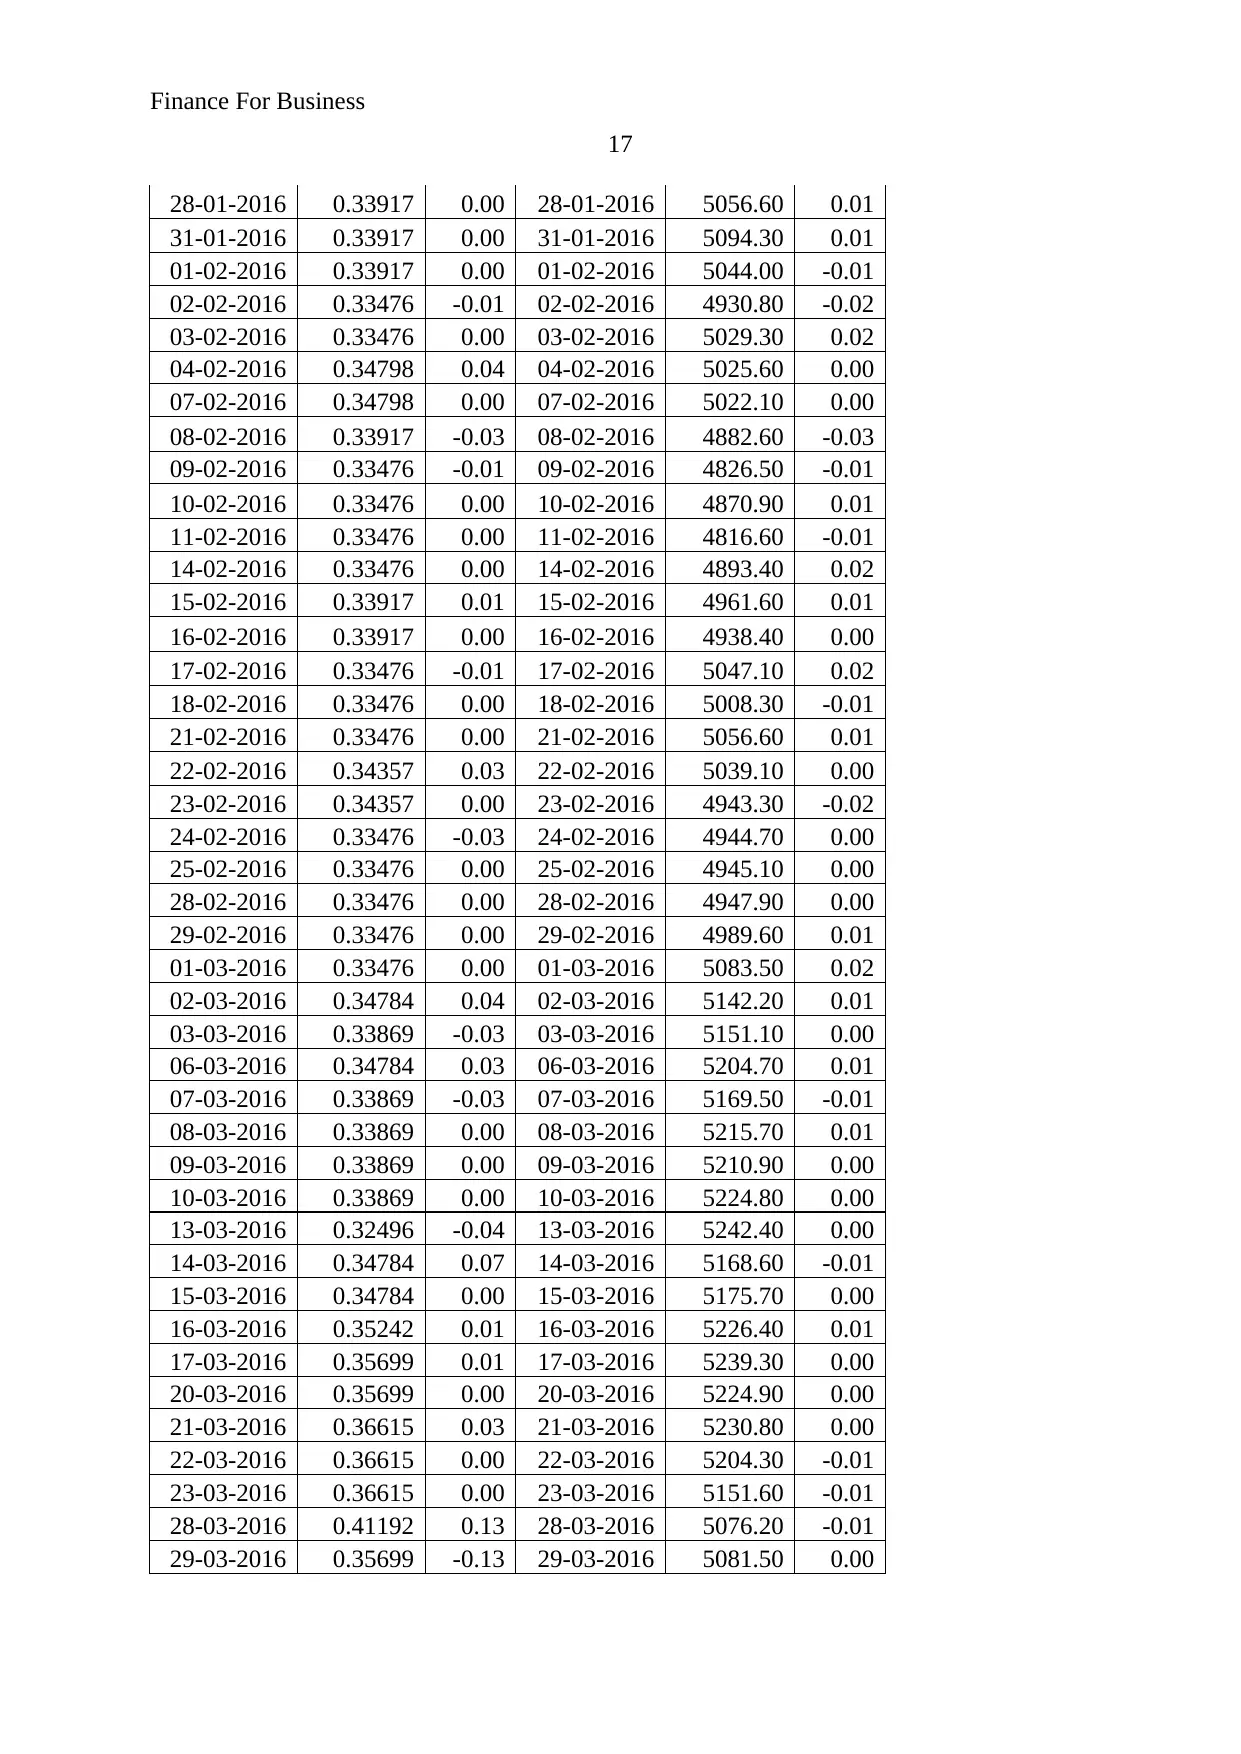
28-01-2016 0.33917 0.00 28-01-2016 5056.60 0.01
31-01-2016 0.33917 0.00 31-01-2016 5094.30 0.01
01-02-2016 0.33917 0.00 01-02-2016 5044.00 -0.01
02-02-2016 0.33476 -0.01 02-02-2016 4930.80 -0.02
03-02-2016 0.33476 0.00 03-02-2016 5029.30 0.02
04-02-2016 0.34798 0.04 04-02-2016 5025.60 0.00
07-02-2016 0.34798 0.00 07-02-2016 5022.10 0.00
08-02-2016 0.33917 -0.03 08-02-2016 4882.60 -0.03
09-02-2016 0.33476 -0.01 09-02-2016 4826.50 -0.01
10-02-2016 0.33476 0.00 10-02-2016 4870.90 0.01
11-02-2016 0.33476 0.00 11-02-2016 4816.60 -0.01
14-02-2016 0.33476 0.00 14-02-2016 4893.40 0.02
15-02-2016 0.33917 0.01 15-02-2016 4961.60 0.01
16-02-2016 0.33917 0.00 16-02-2016 4938.40 0.00
17-02-2016 0.33476 -0.01 17-02-2016 5047.10 0.02
18-02-2016 0.33476 0.00 18-02-2016 5008.30 -0.01
21-02-2016 0.33476 0.00 21-02-2016 5056.60 0.01
22-02-2016 0.34357 0.03 22-02-2016 5039.10 0.00
23-02-2016 0.34357 0.00 23-02-2016 4943.30 -0.02
24-02-2016 0.33476 -0.03 24-02-2016 4944.70 0.00
25-02-2016 0.33476 0.00 25-02-2016 4945.10 0.00
28-02-2016 0.33476 0.00 28-02-2016 4947.90 0.00
29-02-2016 0.33476 0.00 29-02-2016 4989.60 0.01
01-03-2016 0.33476 0.00 01-03-2016 5083.50 0.02
02-03-2016 0.34784 0.04 02-03-2016 5142.20 0.01
03-03-2016 0.33869 -0.03 03-03-2016 5151.10 0.00
06-03-2016 0.34784 0.03 06-03-2016 5204.70 0.01
07-03-2016 0.33869 -0.03 07-03-2016 5169.50 -0.01
08-03-2016 0.33869 0.00 08-03-2016 5215.70 0.01
09-03-2016 0.33869 0.00 09-03-2016 5210.90 0.00
10-03-2016 0.33869 0.00 10-03-2016 5224.80 0.00
13-03-2016 0.32496 -0.04 13-03-2016 5242.40 0.00
14-03-2016 0.34784 0.07 14-03-2016 5168.60 -0.01
15-03-2016 0.34784 0.00 15-03-2016 5175.70 0.00
16-03-2016 0.35242 0.01 16-03-2016 5226.40 0.01
17-03-2016 0.35699 0.01 17-03-2016 5239.30 0.00
20-03-2016 0.35699 0.00 20-03-2016 5224.90 0.00
21-03-2016 0.36615 0.03 21-03-2016 5230.80 0.00
22-03-2016 0.36615 0.00 22-03-2016 5204.30 -0.01
23-03-2016 0.36615 0.00 23-03-2016 5151.60 -0.01
28-03-2016 0.41192 0.13 28-03-2016 5076.20 -0.01
29-03-2016 0.35699 -0.13 29-03-2016 5081.50 0.00
17
28-01-2016 0.33917 0.00 28-01-2016 5056.60 0.01
31-01-2016 0.33917 0.00 31-01-2016 5094.30 0.01
01-02-2016 0.33917 0.00 01-02-2016 5044.00 -0.01
02-02-2016 0.33476 -0.01 02-02-2016 4930.80 -0.02
03-02-2016 0.33476 0.00 03-02-2016 5029.30 0.02
04-02-2016 0.34798 0.04 04-02-2016 5025.60 0.00
07-02-2016 0.34798 0.00 07-02-2016 5022.10 0.00
08-02-2016 0.33917 -0.03 08-02-2016 4882.60 -0.03
09-02-2016 0.33476 -0.01 09-02-2016 4826.50 -0.01
10-02-2016 0.33476 0.00 10-02-2016 4870.90 0.01
11-02-2016 0.33476 0.00 11-02-2016 4816.60 -0.01
14-02-2016 0.33476 0.00 14-02-2016 4893.40 0.02
15-02-2016 0.33917 0.01 15-02-2016 4961.60 0.01
16-02-2016 0.33917 0.00 16-02-2016 4938.40 0.00
17-02-2016 0.33476 -0.01 17-02-2016 5047.10 0.02
18-02-2016 0.33476 0.00 18-02-2016 5008.30 -0.01
21-02-2016 0.33476 0.00 21-02-2016 5056.60 0.01
22-02-2016 0.34357 0.03 22-02-2016 5039.10 0.00
23-02-2016 0.34357 0.00 23-02-2016 4943.30 -0.02
24-02-2016 0.33476 -0.03 24-02-2016 4944.70 0.00
25-02-2016 0.33476 0.00 25-02-2016 4945.10 0.00
28-02-2016 0.33476 0.00 28-02-2016 4947.90 0.00
29-02-2016 0.33476 0.00 29-02-2016 4989.60 0.01
01-03-2016 0.33476 0.00 01-03-2016 5083.50 0.02
02-03-2016 0.34784 0.04 02-03-2016 5142.20 0.01
03-03-2016 0.33869 -0.03 03-03-2016 5151.10 0.00
06-03-2016 0.34784 0.03 06-03-2016 5204.70 0.01
07-03-2016 0.33869 -0.03 07-03-2016 5169.50 -0.01
08-03-2016 0.33869 0.00 08-03-2016 5215.70 0.01
09-03-2016 0.33869 0.00 09-03-2016 5210.90 0.00
10-03-2016 0.33869 0.00 10-03-2016 5224.80 0.00
13-03-2016 0.32496 -0.04 13-03-2016 5242.40 0.00
14-03-2016 0.34784 0.07 14-03-2016 5168.60 -0.01
15-03-2016 0.34784 0.00 15-03-2016 5175.70 0.00
16-03-2016 0.35242 0.01 16-03-2016 5226.40 0.01
17-03-2016 0.35699 0.01 17-03-2016 5239.30 0.00
20-03-2016 0.35699 0.00 20-03-2016 5224.90 0.00
21-03-2016 0.36615 0.03 21-03-2016 5230.80 0.00
22-03-2016 0.36615 0.00 22-03-2016 5204.30 -0.01
23-03-2016 0.36615 0.00 23-03-2016 5151.60 -0.01
28-03-2016 0.41192 0.13 28-03-2016 5076.20 -0.01
29-03-2016 0.35699 -0.13 29-03-2016 5081.50 0.00
Finance For Business
18
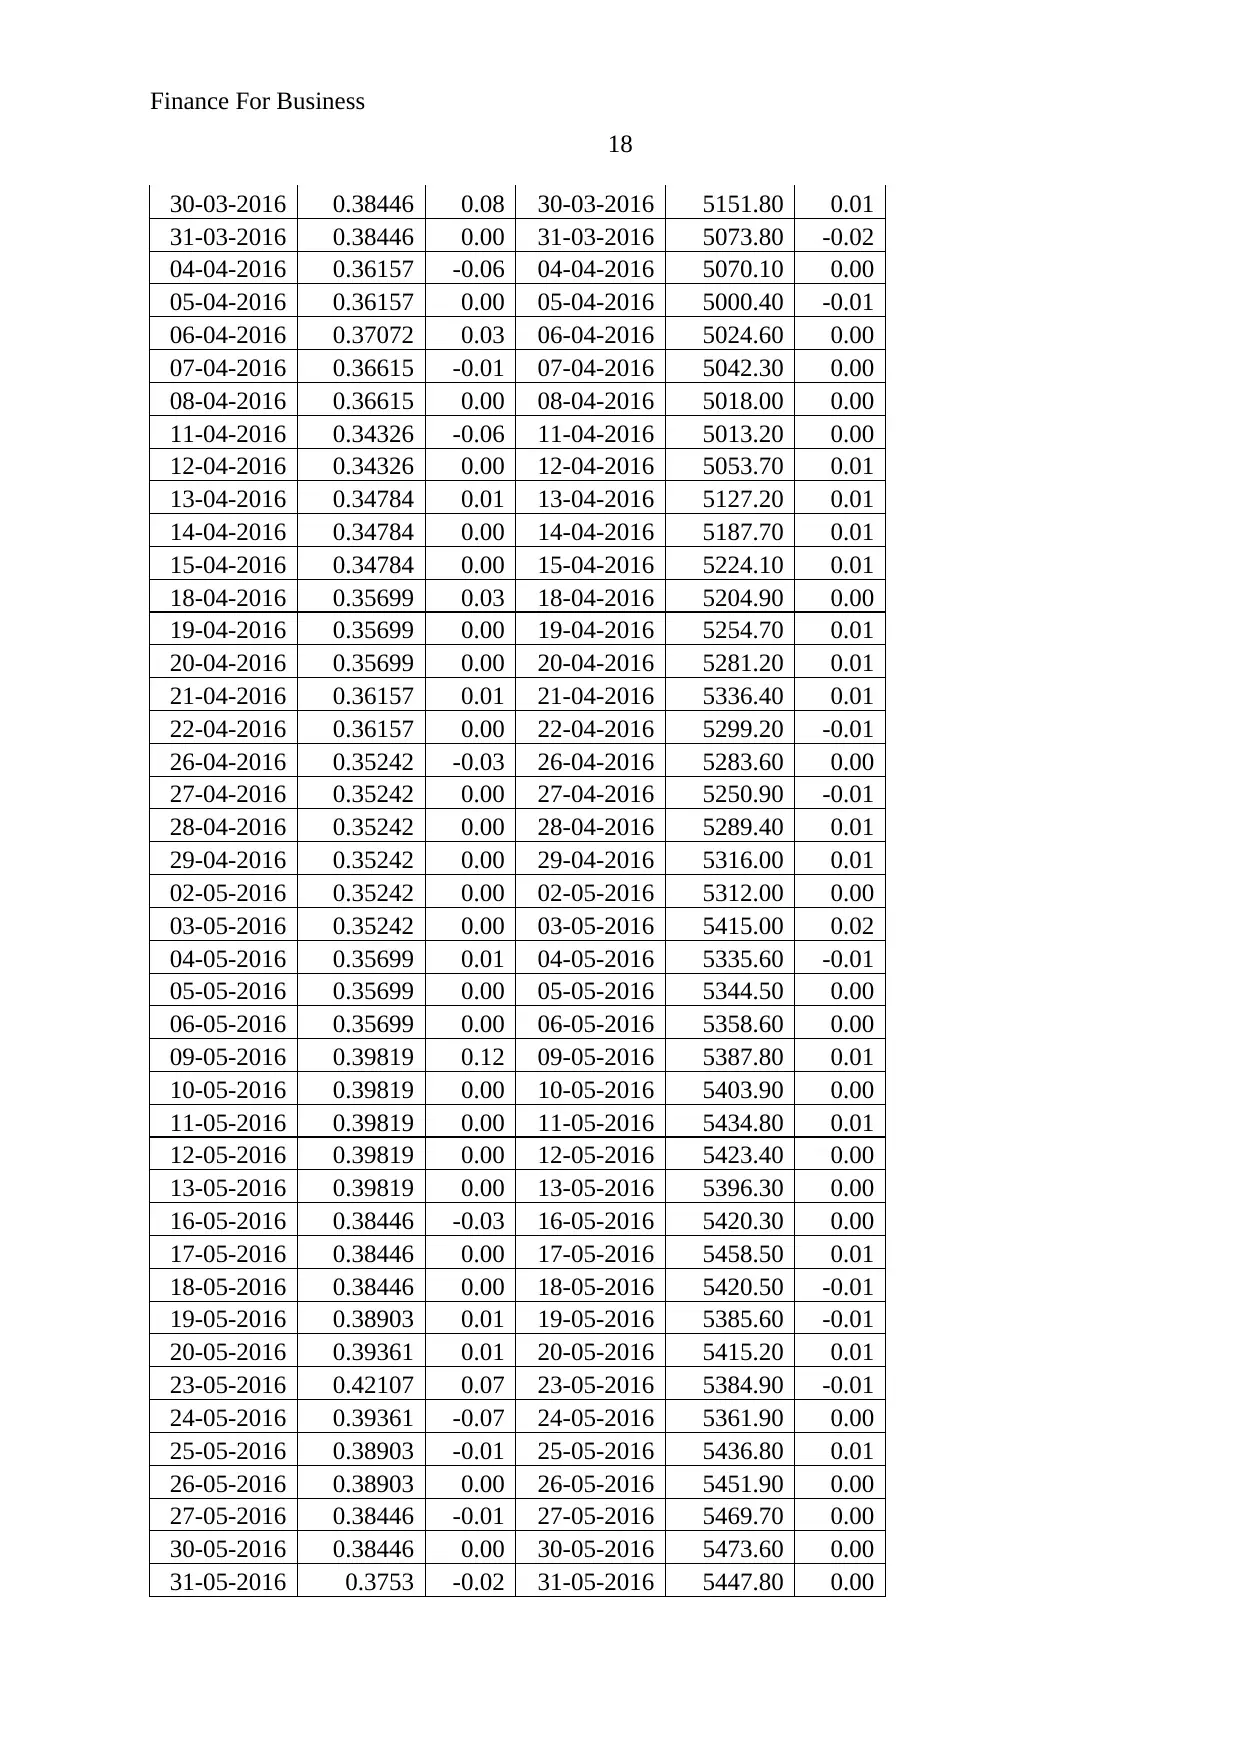
30-03-2016 0.38446 0.08 30-03-2016 5151.80 0.01
31-03-2016 0.38446 0.00 31-03-2016 5073.80 -0.02
04-04-2016 0.36157 -0.06 04-04-2016 5070.10 0.00
05-04-2016 0.36157 0.00 05-04-2016 5000.40 -0.01
06-04-2016 0.37072 0.03 06-04-2016 5024.60 0.00
07-04-2016 0.36615 -0.01 07-04-2016 5042.30 0.00
08-04-2016 0.36615 0.00 08-04-2016 5018.00 0.00
11-04-2016 0.34326 -0.06 11-04-2016 5013.20 0.00
12-04-2016 0.34326 0.00 12-04-2016 5053.70 0.01
13-04-2016 0.34784 0.01 13-04-2016 5127.20 0.01
14-04-2016 0.34784 0.00 14-04-2016 5187.70 0.01
15-04-2016 0.34784 0.00 15-04-2016 5224.10 0.01
18-04-2016 0.35699 0.03 18-04-2016 5204.90 0.00
19-04-2016 0.35699 0.00 19-04-2016 5254.70 0.01
20-04-2016 0.35699 0.00 20-04-2016 5281.20 0.01
21-04-2016 0.36157 0.01 21-04-2016 5336.40 0.01
22-04-2016 0.36157 0.00 22-04-2016 5299.20 -0.01
26-04-2016 0.35242 -0.03 26-04-2016 5283.60 0.00
27-04-2016 0.35242 0.00 27-04-2016 5250.90 -0.01
28-04-2016 0.35242 0.00 28-04-2016 5289.40 0.01
29-04-2016 0.35242 0.00 29-04-2016 5316.00 0.01
02-05-2016 0.35242 0.00 02-05-2016 5312.00 0.00
03-05-2016 0.35242 0.00 03-05-2016 5415.00 0.02
04-05-2016 0.35699 0.01 04-05-2016 5335.60 -0.01
05-05-2016 0.35699 0.00 05-05-2016 5344.50 0.00
06-05-2016 0.35699 0.00 06-05-2016 5358.60 0.00
09-05-2016 0.39819 0.12 09-05-2016 5387.80 0.01
10-05-2016 0.39819 0.00 10-05-2016 5403.90 0.00
11-05-2016 0.39819 0.00 11-05-2016 5434.80 0.01
12-05-2016 0.39819 0.00 12-05-2016 5423.40 0.00
13-05-2016 0.39819 0.00 13-05-2016 5396.30 0.00
16-05-2016 0.38446 -0.03 16-05-2016 5420.30 0.00
17-05-2016 0.38446 0.00 17-05-2016 5458.50 0.01
18-05-2016 0.38446 0.00 18-05-2016 5420.50 -0.01
19-05-2016 0.38903 0.01 19-05-2016 5385.60 -0.01
20-05-2016 0.39361 0.01 20-05-2016 5415.20 0.01
23-05-2016 0.42107 0.07 23-05-2016 5384.90 -0.01
24-05-2016 0.39361 -0.07 24-05-2016 5361.90 0.00
25-05-2016 0.38903 -0.01 25-05-2016 5436.80 0.01
26-05-2016 0.38903 0.00 26-05-2016 5451.90 0.00
27-05-2016 0.38446 -0.01 27-05-2016 5469.70 0.00
30-05-2016 0.38446 0.00 30-05-2016 5473.60 0.00
31-05-2016 0.3753 -0.02 31-05-2016 5447.80 0.00
18
30-03-2016 0.38446 0.08 30-03-2016 5151.80 0.01
31-03-2016 0.38446 0.00 31-03-2016 5073.80 -0.02
04-04-2016 0.36157 -0.06 04-04-2016 5070.10 0.00
05-04-2016 0.36157 0.00 05-04-2016 5000.40 -0.01
06-04-2016 0.37072 0.03 06-04-2016 5024.60 0.00
07-04-2016 0.36615 -0.01 07-04-2016 5042.30 0.00
08-04-2016 0.36615 0.00 08-04-2016 5018.00 0.00
11-04-2016 0.34326 -0.06 11-04-2016 5013.20 0.00
12-04-2016 0.34326 0.00 12-04-2016 5053.70 0.01
13-04-2016 0.34784 0.01 13-04-2016 5127.20 0.01
14-04-2016 0.34784 0.00 14-04-2016 5187.70 0.01
15-04-2016 0.34784 0.00 15-04-2016 5224.10 0.01
18-04-2016 0.35699 0.03 18-04-2016 5204.90 0.00
19-04-2016 0.35699 0.00 19-04-2016 5254.70 0.01
20-04-2016 0.35699 0.00 20-04-2016 5281.20 0.01
21-04-2016 0.36157 0.01 21-04-2016 5336.40 0.01
22-04-2016 0.36157 0.00 22-04-2016 5299.20 -0.01
26-04-2016 0.35242 -0.03 26-04-2016 5283.60 0.00
27-04-2016 0.35242 0.00 27-04-2016 5250.90 -0.01
28-04-2016 0.35242 0.00 28-04-2016 5289.40 0.01
29-04-2016 0.35242 0.00 29-04-2016 5316.00 0.01
02-05-2016 0.35242 0.00 02-05-2016 5312.00 0.00
03-05-2016 0.35242 0.00 03-05-2016 5415.00 0.02
04-05-2016 0.35699 0.01 04-05-2016 5335.60 -0.01
05-05-2016 0.35699 0.00 05-05-2016 5344.50 0.00
06-05-2016 0.35699 0.00 06-05-2016 5358.60 0.00
09-05-2016 0.39819 0.12 09-05-2016 5387.80 0.01
10-05-2016 0.39819 0.00 10-05-2016 5403.90 0.00
11-05-2016 0.39819 0.00 11-05-2016 5434.80 0.01
12-05-2016 0.39819 0.00 12-05-2016 5423.40 0.00
13-05-2016 0.39819 0.00 13-05-2016 5396.30 0.00
16-05-2016 0.38446 -0.03 16-05-2016 5420.30 0.00
17-05-2016 0.38446 0.00 17-05-2016 5458.50 0.01
18-05-2016 0.38446 0.00 18-05-2016 5420.50 -0.01
19-05-2016 0.38903 0.01 19-05-2016 5385.60 -0.01
20-05-2016 0.39361 0.01 20-05-2016 5415.20 0.01
23-05-2016 0.42107 0.07 23-05-2016 5384.90 -0.01
24-05-2016 0.39361 -0.07 24-05-2016 5361.90 0.00
25-05-2016 0.38903 -0.01 25-05-2016 5436.80 0.01
26-05-2016 0.38903 0.00 26-05-2016 5451.90 0.00
27-05-2016 0.38446 -0.01 27-05-2016 5469.70 0.00
30-05-2016 0.38446 0.00 30-05-2016 5473.60 0.00
31-05-2016 0.3753 -0.02 31-05-2016 5447.80 0.00
Finance For Business
19
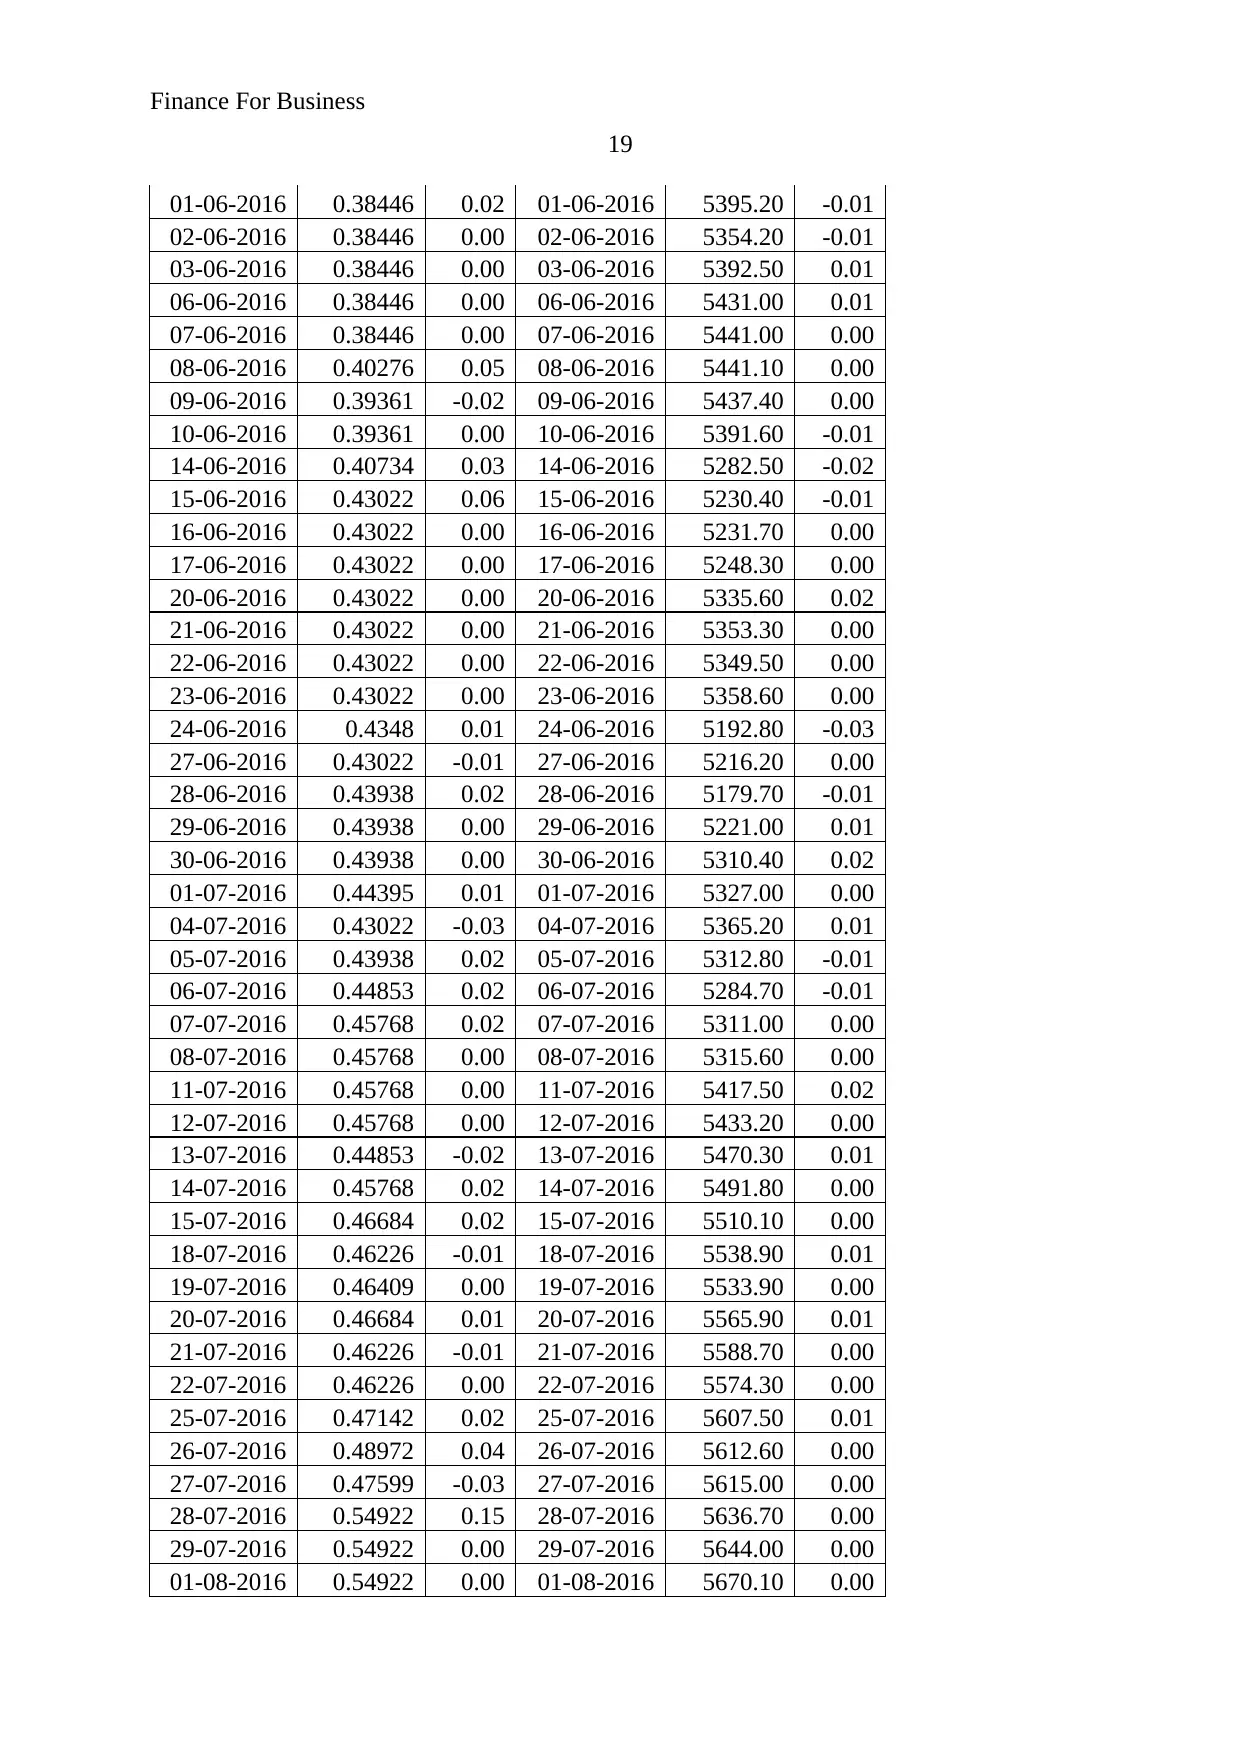
01-06-2016 0.38446 0.02 01-06-2016 5395.20 -0.01
02-06-2016 0.38446 0.00 02-06-2016 5354.20 -0.01
03-06-2016 0.38446 0.00 03-06-2016 5392.50 0.01
06-06-2016 0.38446 0.00 06-06-2016 5431.00 0.01
07-06-2016 0.38446 0.00 07-06-2016 5441.00 0.00
08-06-2016 0.40276 0.05 08-06-2016 5441.10 0.00
09-06-2016 0.39361 -0.02 09-06-2016 5437.40 0.00
10-06-2016 0.39361 0.00 10-06-2016 5391.60 -0.01
14-06-2016 0.40734 0.03 14-06-2016 5282.50 -0.02
15-06-2016 0.43022 0.06 15-06-2016 5230.40 -0.01
16-06-2016 0.43022 0.00 16-06-2016 5231.70 0.00
17-06-2016 0.43022 0.00 17-06-2016 5248.30 0.00
20-06-2016 0.43022 0.00 20-06-2016 5335.60 0.02
21-06-2016 0.43022 0.00 21-06-2016 5353.30 0.00
22-06-2016 0.43022 0.00 22-06-2016 5349.50 0.00
23-06-2016 0.43022 0.00 23-06-2016 5358.60 0.00
24-06-2016 0.4348 0.01 24-06-2016 5192.80 -0.03
27-06-2016 0.43022 -0.01 27-06-2016 5216.20 0.00
28-06-2016 0.43938 0.02 28-06-2016 5179.70 -0.01
29-06-2016 0.43938 0.00 29-06-2016 5221.00 0.01
30-06-2016 0.43938 0.00 30-06-2016 5310.40 0.02
01-07-2016 0.44395 0.01 01-07-2016 5327.00 0.00
04-07-2016 0.43022 -0.03 04-07-2016 5365.20 0.01
05-07-2016 0.43938 0.02 05-07-2016 5312.80 -0.01
06-07-2016 0.44853 0.02 06-07-2016 5284.70 -0.01
07-07-2016 0.45768 0.02 07-07-2016 5311.00 0.00
08-07-2016 0.45768 0.00 08-07-2016 5315.60 0.00
11-07-2016 0.45768 0.00 11-07-2016 5417.50 0.02
12-07-2016 0.45768 0.00 12-07-2016 5433.20 0.00
13-07-2016 0.44853 -0.02 13-07-2016 5470.30 0.01
14-07-2016 0.45768 0.02 14-07-2016 5491.80 0.00
15-07-2016 0.46684 0.02 15-07-2016 5510.10 0.00
18-07-2016 0.46226 -0.01 18-07-2016 5538.90 0.01
19-07-2016 0.46409 0.00 19-07-2016 5533.90 0.00
20-07-2016 0.46684 0.01 20-07-2016 5565.90 0.01
21-07-2016 0.46226 -0.01 21-07-2016 5588.70 0.00
22-07-2016 0.46226 0.00 22-07-2016 5574.30 0.00
25-07-2016 0.47142 0.02 25-07-2016 5607.50 0.01
26-07-2016 0.48972 0.04 26-07-2016 5612.60 0.00
27-07-2016 0.47599 -0.03 27-07-2016 5615.00 0.00
28-07-2016 0.54922 0.15 28-07-2016 5636.70 0.00
29-07-2016 0.54922 0.00 29-07-2016 5644.00 0.00
01-08-2016 0.54922 0.00 01-08-2016 5670.10 0.00
19
01-06-2016 0.38446 0.02 01-06-2016 5395.20 -0.01
02-06-2016 0.38446 0.00 02-06-2016 5354.20 -0.01
03-06-2016 0.38446 0.00 03-06-2016 5392.50 0.01
06-06-2016 0.38446 0.00 06-06-2016 5431.00 0.01
07-06-2016 0.38446 0.00 07-06-2016 5441.00 0.00
08-06-2016 0.40276 0.05 08-06-2016 5441.10 0.00
09-06-2016 0.39361 -0.02 09-06-2016 5437.40 0.00
10-06-2016 0.39361 0.00 10-06-2016 5391.60 -0.01
14-06-2016 0.40734 0.03 14-06-2016 5282.50 -0.02
15-06-2016 0.43022 0.06 15-06-2016 5230.40 -0.01
16-06-2016 0.43022 0.00 16-06-2016 5231.70 0.00
17-06-2016 0.43022 0.00 17-06-2016 5248.30 0.00
20-06-2016 0.43022 0.00 20-06-2016 5335.60 0.02
21-06-2016 0.43022 0.00 21-06-2016 5353.30 0.00
22-06-2016 0.43022 0.00 22-06-2016 5349.50 0.00
23-06-2016 0.43022 0.00 23-06-2016 5358.60 0.00
24-06-2016 0.4348 0.01 24-06-2016 5192.80 -0.03
27-06-2016 0.43022 -0.01 27-06-2016 5216.20 0.00
28-06-2016 0.43938 0.02 28-06-2016 5179.70 -0.01
29-06-2016 0.43938 0.00 29-06-2016 5221.00 0.01
30-06-2016 0.43938 0.00 30-06-2016 5310.40 0.02
01-07-2016 0.44395 0.01 01-07-2016 5327.00 0.00
04-07-2016 0.43022 -0.03 04-07-2016 5365.20 0.01
05-07-2016 0.43938 0.02 05-07-2016 5312.80 -0.01
06-07-2016 0.44853 0.02 06-07-2016 5284.70 -0.01
07-07-2016 0.45768 0.02 07-07-2016 5311.00 0.00
08-07-2016 0.45768 0.00 08-07-2016 5315.60 0.00
11-07-2016 0.45768 0.00 11-07-2016 5417.50 0.02
12-07-2016 0.45768 0.00 12-07-2016 5433.20 0.00
13-07-2016 0.44853 -0.02 13-07-2016 5470.30 0.01
14-07-2016 0.45768 0.02 14-07-2016 5491.80 0.00
15-07-2016 0.46684 0.02 15-07-2016 5510.10 0.00
18-07-2016 0.46226 -0.01 18-07-2016 5538.90 0.01
19-07-2016 0.46409 0.00 19-07-2016 5533.90 0.00
20-07-2016 0.46684 0.01 20-07-2016 5565.90 0.01
21-07-2016 0.46226 -0.01 21-07-2016 5588.70 0.00
22-07-2016 0.46226 0.00 22-07-2016 5574.30 0.00
25-07-2016 0.47142 0.02 25-07-2016 5607.50 0.01
26-07-2016 0.48972 0.04 26-07-2016 5612.60 0.00
27-07-2016 0.47599 -0.03 27-07-2016 5615.00 0.00
28-07-2016 0.54922 0.15 28-07-2016 5636.70 0.00
29-07-2016 0.54922 0.00 29-07-2016 5644.00 0.00
01-08-2016 0.54922 0.00 01-08-2016 5670.10 0.00
Paraphrase This Document
Need a fresh take? Get an instant paraphrase of this document with our AI Paraphraser
Finance For Business
20
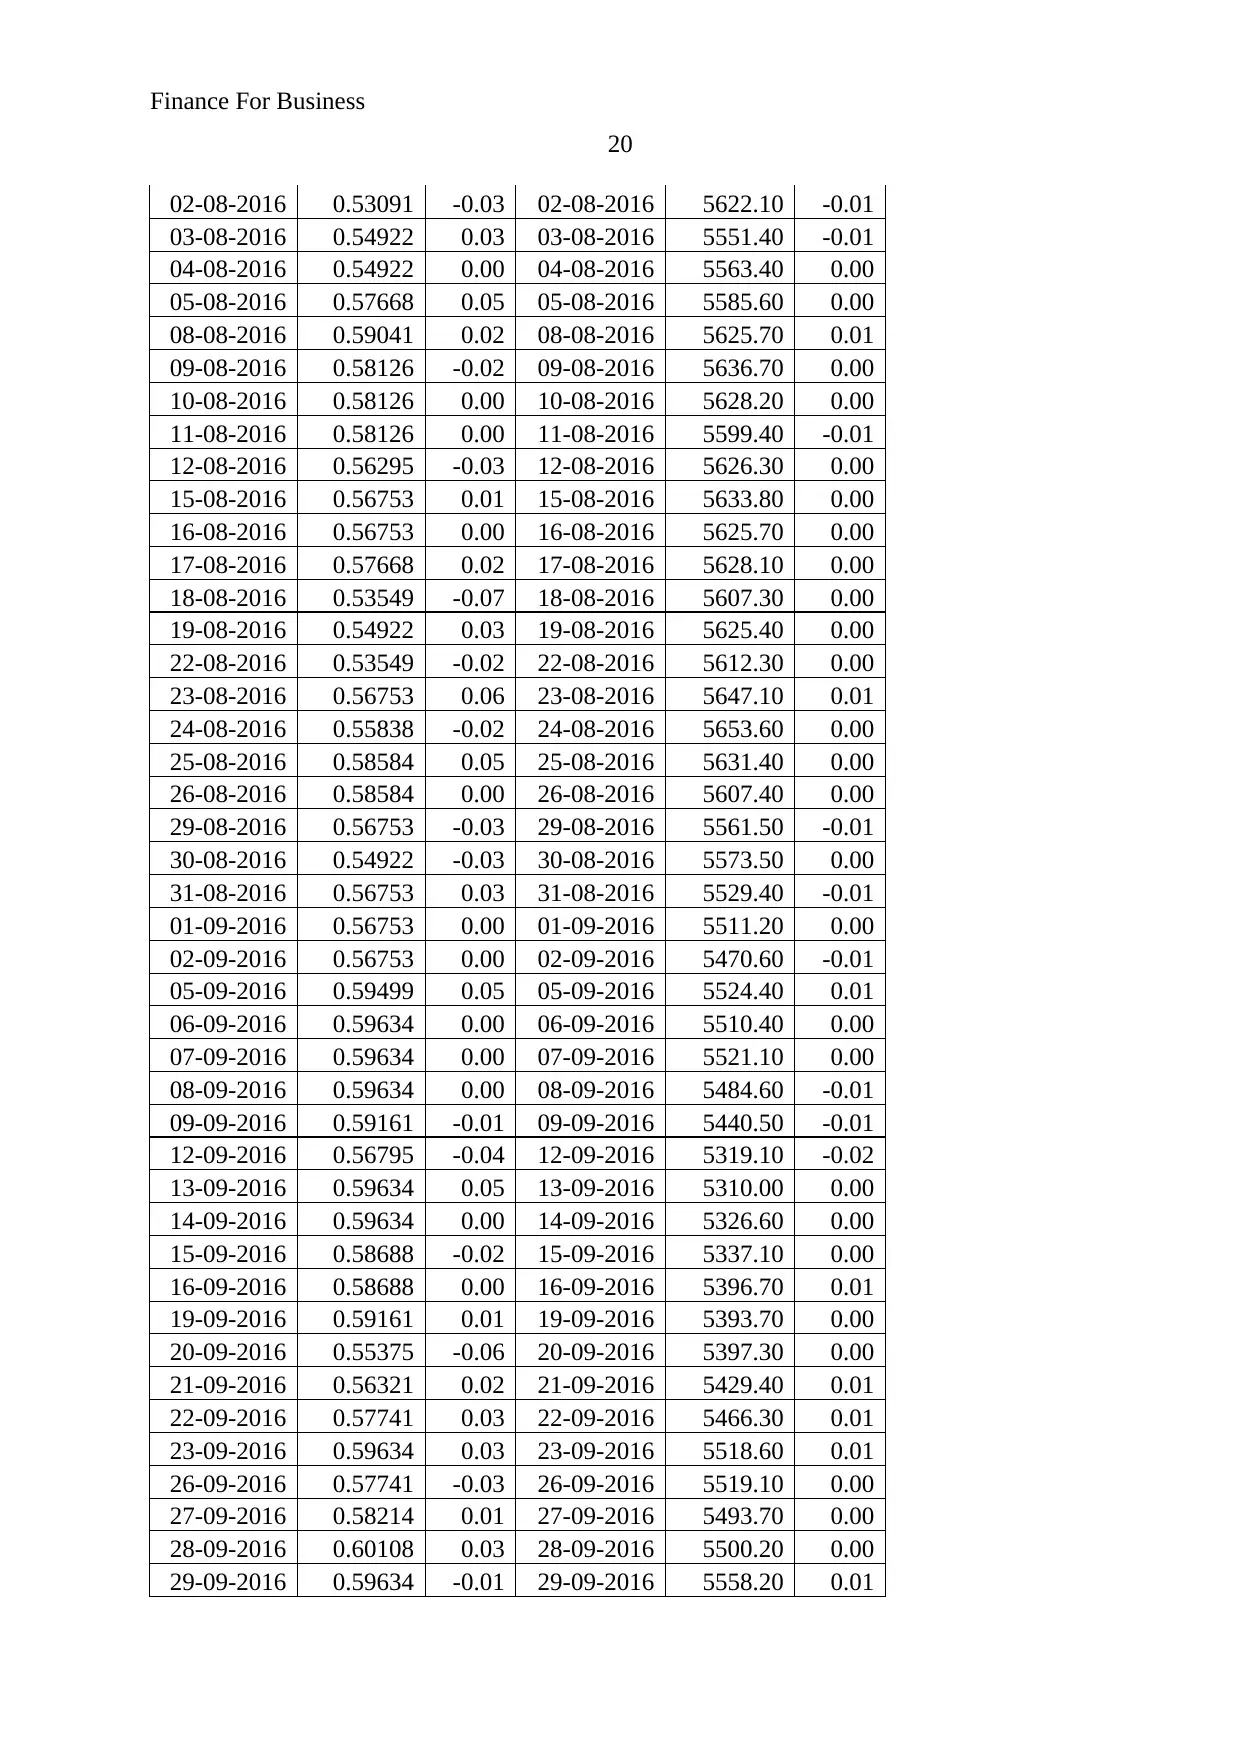
02-08-2016 0.53091 -0.03 02-08-2016 5622.10 -0.01
03-08-2016 0.54922 0.03 03-08-2016 5551.40 -0.01
04-08-2016 0.54922 0.00 04-08-2016 5563.40 0.00
05-08-2016 0.57668 0.05 05-08-2016 5585.60 0.00
08-08-2016 0.59041 0.02 08-08-2016 5625.70 0.01
09-08-2016 0.58126 -0.02 09-08-2016 5636.70 0.00
10-08-2016 0.58126 0.00 10-08-2016 5628.20 0.00
11-08-2016 0.58126 0.00 11-08-2016 5599.40 -0.01
12-08-2016 0.56295 -0.03 12-08-2016 5626.30 0.00
15-08-2016 0.56753 0.01 15-08-2016 5633.80 0.00
16-08-2016 0.56753 0.00 16-08-2016 5625.70 0.00
17-08-2016 0.57668 0.02 17-08-2016 5628.10 0.00
18-08-2016 0.53549 -0.07 18-08-2016 5607.30 0.00
19-08-2016 0.54922 0.03 19-08-2016 5625.40 0.00
22-08-2016 0.53549 -0.02 22-08-2016 5612.30 0.00
23-08-2016 0.56753 0.06 23-08-2016 5647.10 0.01
24-08-2016 0.55838 -0.02 24-08-2016 5653.60 0.00
25-08-2016 0.58584 0.05 25-08-2016 5631.40 0.00
26-08-2016 0.58584 0.00 26-08-2016 5607.40 0.00
29-08-2016 0.56753 -0.03 29-08-2016 5561.50 -0.01
30-08-2016 0.54922 -0.03 30-08-2016 5573.50 0.00
31-08-2016 0.56753 0.03 31-08-2016 5529.40 -0.01
01-09-2016 0.56753 0.00 01-09-2016 5511.20 0.00
02-09-2016 0.56753 0.00 02-09-2016 5470.60 -0.01
05-09-2016 0.59499 0.05 05-09-2016 5524.40 0.01
06-09-2016 0.59634 0.00 06-09-2016 5510.40 0.00
07-09-2016 0.59634 0.00 07-09-2016 5521.10 0.00
08-09-2016 0.59634 0.00 08-09-2016 5484.60 -0.01
09-09-2016 0.59161 -0.01 09-09-2016 5440.50 -0.01
12-09-2016 0.56795 -0.04 12-09-2016 5319.10 -0.02
13-09-2016 0.59634 0.05 13-09-2016 5310.00 0.00
14-09-2016 0.59634 0.00 14-09-2016 5326.60 0.00
15-09-2016 0.58688 -0.02 15-09-2016 5337.10 0.00
16-09-2016 0.58688 0.00 16-09-2016 5396.70 0.01
19-09-2016 0.59161 0.01 19-09-2016 5393.70 0.00
20-09-2016 0.55375 -0.06 20-09-2016 5397.30 0.00
21-09-2016 0.56321 0.02 21-09-2016 5429.40 0.01
22-09-2016 0.57741 0.03 22-09-2016 5466.30 0.01
23-09-2016 0.59634 0.03 23-09-2016 5518.60 0.01
26-09-2016 0.57741 -0.03 26-09-2016 5519.10 0.00
27-09-2016 0.58214 0.01 27-09-2016 5493.70 0.00
28-09-2016 0.60108 0.03 28-09-2016 5500.20 0.00
29-09-2016 0.59634 -0.01 29-09-2016 5558.20 0.01
20
02-08-2016 0.53091 -0.03 02-08-2016 5622.10 -0.01
03-08-2016 0.54922 0.03 03-08-2016 5551.40 -0.01
04-08-2016 0.54922 0.00 04-08-2016 5563.40 0.00
05-08-2016 0.57668 0.05 05-08-2016 5585.60 0.00
08-08-2016 0.59041 0.02 08-08-2016 5625.70 0.01
09-08-2016 0.58126 -0.02 09-08-2016 5636.70 0.00
10-08-2016 0.58126 0.00 10-08-2016 5628.20 0.00
11-08-2016 0.58126 0.00 11-08-2016 5599.40 -0.01
12-08-2016 0.56295 -0.03 12-08-2016 5626.30 0.00
15-08-2016 0.56753 0.01 15-08-2016 5633.80 0.00
16-08-2016 0.56753 0.00 16-08-2016 5625.70 0.00
17-08-2016 0.57668 0.02 17-08-2016 5628.10 0.00
18-08-2016 0.53549 -0.07 18-08-2016 5607.30 0.00
19-08-2016 0.54922 0.03 19-08-2016 5625.40 0.00
22-08-2016 0.53549 -0.02 22-08-2016 5612.30 0.00
23-08-2016 0.56753 0.06 23-08-2016 5647.10 0.01
24-08-2016 0.55838 -0.02 24-08-2016 5653.60 0.00
25-08-2016 0.58584 0.05 25-08-2016 5631.40 0.00
26-08-2016 0.58584 0.00 26-08-2016 5607.40 0.00
29-08-2016 0.56753 -0.03 29-08-2016 5561.50 -0.01
30-08-2016 0.54922 -0.03 30-08-2016 5573.50 0.00
31-08-2016 0.56753 0.03 31-08-2016 5529.40 -0.01
01-09-2016 0.56753 0.00 01-09-2016 5511.20 0.00
02-09-2016 0.56753 0.00 02-09-2016 5470.60 -0.01
05-09-2016 0.59499 0.05 05-09-2016 5524.40 0.01
06-09-2016 0.59634 0.00 06-09-2016 5510.40 0.00
07-09-2016 0.59634 0.00 07-09-2016 5521.10 0.00
08-09-2016 0.59634 0.00 08-09-2016 5484.60 -0.01
09-09-2016 0.59161 -0.01 09-09-2016 5440.50 -0.01
12-09-2016 0.56795 -0.04 12-09-2016 5319.10 -0.02
13-09-2016 0.59634 0.05 13-09-2016 5310.00 0.00
14-09-2016 0.59634 0.00 14-09-2016 5326.60 0.00
15-09-2016 0.58688 -0.02 15-09-2016 5337.10 0.00
16-09-2016 0.58688 0.00 16-09-2016 5396.70 0.01
19-09-2016 0.59161 0.01 19-09-2016 5393.70 0.00
20-09-2016 0.55375 -0.06 20-09-2016 5397.30 0.00
21-09-2016 0.56321 0.02 21-09-2016 5429.40 0.01
22-09-2016 0.57741 0.03 22-09-2016 5466.30 0.01
23-09-2016 0.59634 0.03 23-09-2016 5518.60 0.01
26-09-2016 0.57741 -0.03 26-09-2016 5519.10 0.00
27-09-2016 0.58214 0.01 27-09-2016 5493.70 0.00
28-09-2016 0.60108 0.03 28-09-2016 5500.20 0.00
29-09-2016 0.59634 -0.01 29-09-2016 5558.20 0.01
Finance For Business
21
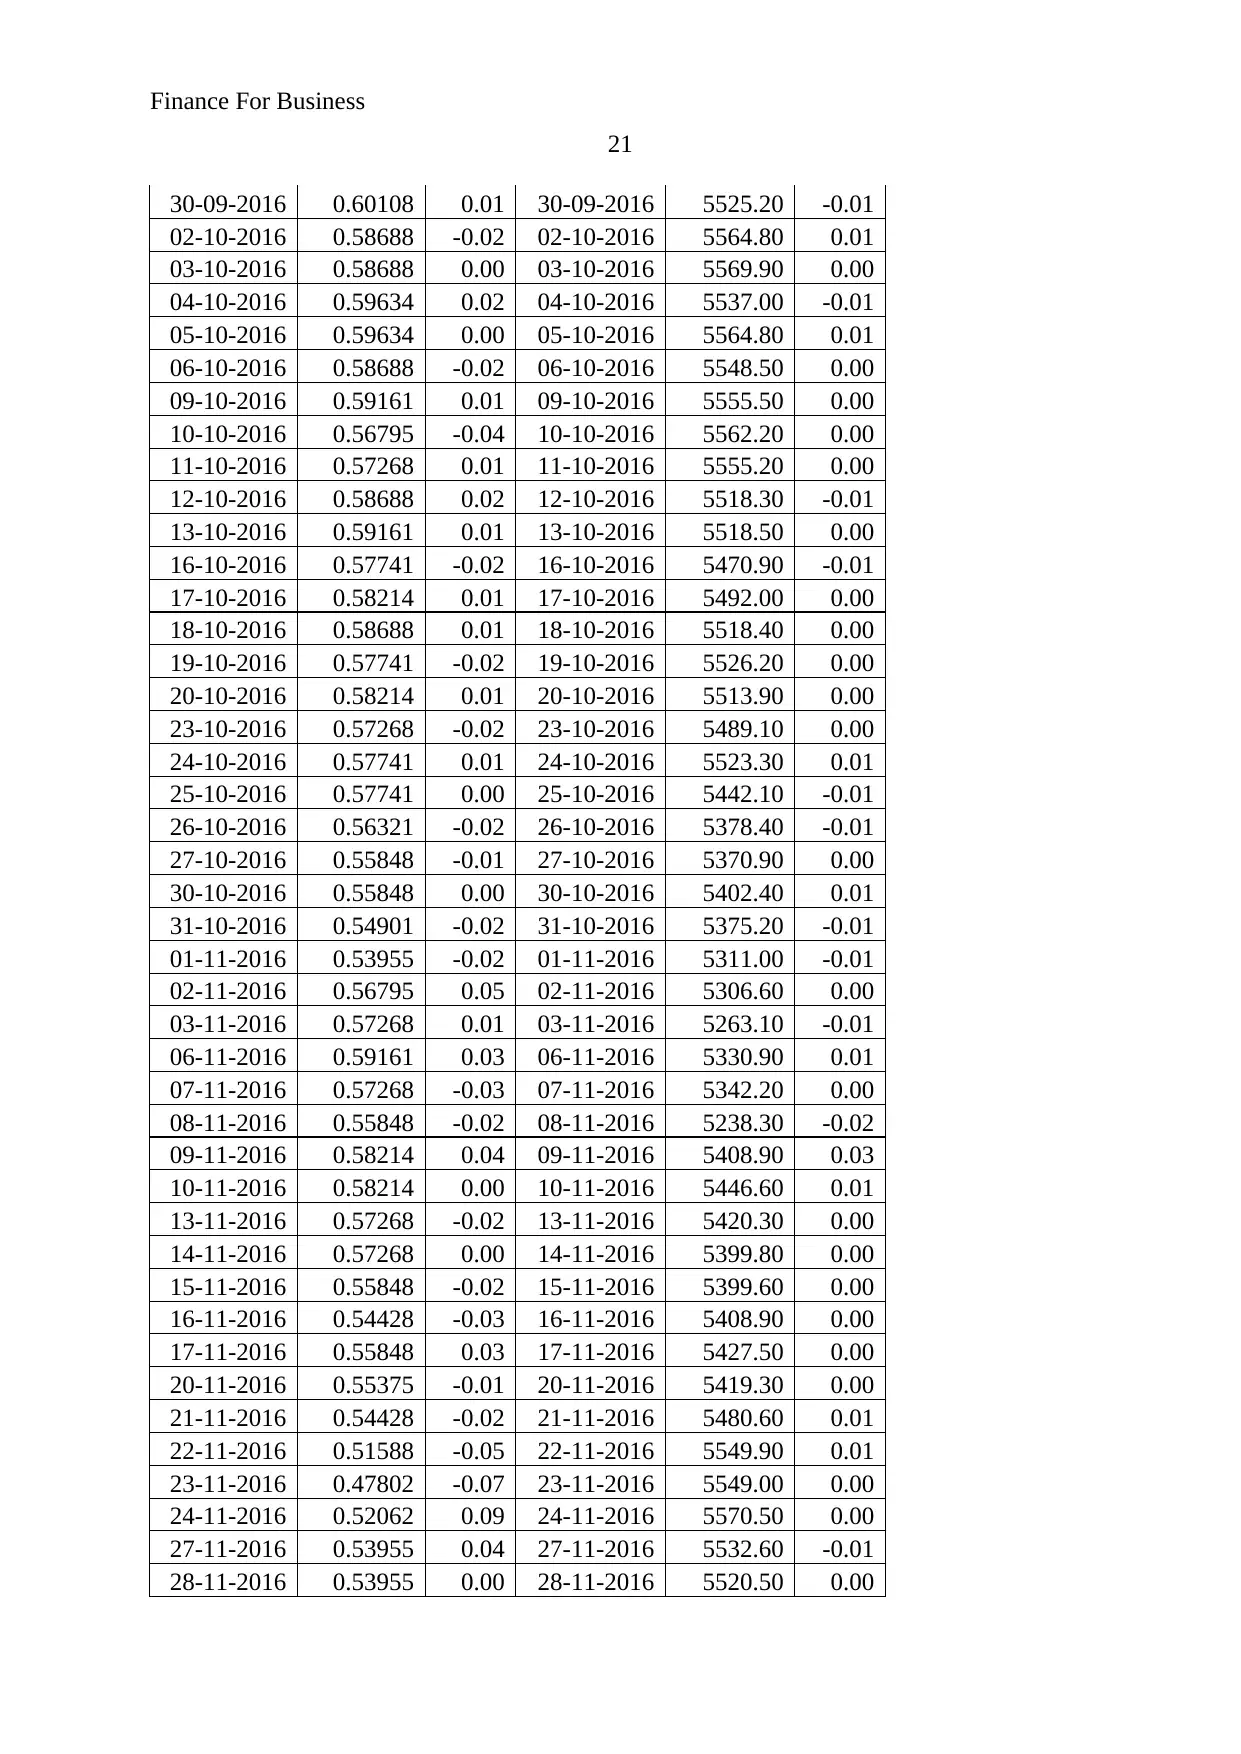
30-09-2016 0.60108 0.01 30-09-2016 5525.20 -0.01
02-10-2016 0.58688 -0.02 02-10-2016 5564.80 0.01
03-10-2016 0.58688 0.00 03-10-2016 5569.90 0.00
04-10-2016 0.59634 0.02 04-10-2016 5537.00 -0.01
05-10-2016 0.59634 0.00 05-10-2016 5564.80 0.01
06-10-2016 0.58688 -0.02 06-10-2016 5548.50 0.00
09-10-2016 0.59161 0.01 09-10-2016 5555.50 0.00
10-10-2016 0.56795 -0.04 10-10-2016 5562.20 0.00
11-10-2016 0.57268 0.01 11-10-2016 5555.20 0.00
12-10-2016 0.58688 0.02 12-10-2016 5518.30 -0.01
13-10-2016 0.59161 0.01 13-10-2016 5518.50 0.00
16-10-2016 0.57741 -0.02 16-10-2016 5470.90 -0.01
17-10-2016 0.58214 0.01 17-10-2016 5492.00 0.00
18-10-2016 0.58688 0.01 18-10-2016 5518.40 0.00
19-10-2016 0.57741 -0.02 19-10-2016 5526.20 0.00
20-10-2016 0.58214 0.01 20-10-2016 5513.90 0.00
23-10-2016 0.57268 -0.02 23-10-2016 5489.10 0.00
24-10-2016 0.57741 0.01 24-10-2016 5523.30 0.01
25-10-2016 0.57741 0.00 25-10-2016 5442.10 -0.01
26-10-2016 0.56321 -0.02 26-10-2016 5378.40 -0.01
27-10-2016 0.55848 -0.01 27-10-2016 5370.90 0.00
30-10-2016 0.55848 0.00 30-10-2016 5402.40 0.01
31-10-2016 0.54901 -0.02 31-10-2016 5375.20 -0.01
01-11-2016 0.53955 -0.02 01-11-2016 5311.00 -0.01
02-11-2016 0.56795 0.05 02-11-2016 5306.60 0.00
03-11-2016 0.57268 0.01 03-11-2016 5263.10 -0.01
06-11-2016 0.59161 0.03 06-11-2016 5330.90 0.01
07-11-2016 0.57268 -0.03 07-11-2016 5342.20 0.00
08-11-2016 0.55848 -0.02 08-11-2016 5238.30 -0.02
09-11-2016 0.58214 0.04 09-11-2016 5408.90 0.03
10-11-2016 0.58214 0.00 10-11-2016 5446.60 0.01
13-11-2016 0.57268 -0.02 13-11-2016 5420.30 0.00
14-11-2016 0.57268 0.00 14-11-2016 5399.80 0.00
15-11-2016 0.55848 -0.02 15-11-2016 5399.60 0.00
16-11-2016 0.54428 -0.03 16-11-2016 5408.90 0.00
17-11-2016 0.55848 0.03 17-11-2016 5427.50 0.00
20-11-2016 0.55375 -0.01 20-11-2016 5419.30 0.00
21-11-2016 0.54428 -0.02 21-11-2016 5480.60 0.01
22-11-2016 0.51588 -0.05 22-11-2016 5549.90 0.01
23-11-2016 0.47802 -0.07 23-11-2016 5549.00 0.00
24-11-2016 0.52062 0.09 24-11-2016 5570.50 0.00
27-11-2016 0.53955 0.04 27-11-2016 5532.60 -0.01
28-11-2016 0.53955 0.00 28-11-2016 5520.50 0.00
21
30-09-2016 0.60108 0.01 30-09-2016 5525.20 -0.01
02-10-2016 0.58688 -0.02 02-10-2016 5564.80 0.01
03-10-2016 0.58688 0.00 03-10-2016 5569.90 0.00
04-10-2016 0.59634 0.02 04-10-2016 5537.00 -0.01
05-10-2016 0.59634 0.00 05-10-2016 5564.80 0.01
06-10-2016 0.58688 -0.02 06-10-2016 5548.50 0.00
09-10-2016 0.59161 0.01 09-10-2016 5555.50 0.00
10-10-2016 0.56795 -0.04 10-10-2016 5562.20 0.00
11-10-2016 0.57268 0.01 11-10-2016 5555.20 0.00
12-10-2016 0.58688 0.02 12-10-2016 5518.30 -0.01
13-10-2016 0.59161 0.01 13-10-2016 5518.50 0.00
16-10-2016 0.57741 -0.02 16-10-2016 5470.90 -0.01
17-10-2016 0.58214 0.01 17-10-2016 5492.00 0.00
18-10-2016 0.58688 0.01 18-10-2016 5518.40 0.00
19-10-2016 0.57741 -0.02 19-10-2016 5526.20 0.00
20-10-2016 0.58214 0.01 20-10-2016 5513.90 0.00
23-10-2016 0.57268 -0.02 23-10-2016 5489.10 0.00
24-10-2016 0.57741 0.01 24-10-2016 5523.30 0.01
25-10-2016 0.57741 0.00 25-10-2016 5442.10 -0.01
26-10-2016 0.56321 -0.02 26-10-2016 5378.40 -0.01
27-10-2016 0.55848 -0.01 27-10-2016 5370.90 0.00
30-10-2016 0.55848 0.00 30-10-2016 5402.40 0.01
31-10-2016 0.54901 -0.02 31-10-2016 5375.20 -0.01
01-11-2016 0.53955 -0.02 01-11-2016 5311.00 -0.01
02-11-2016 0.56795 0.05 02-11-2016 5306.60 0.00
03-11-2016 0.57268 0.01 03-11-2016 5263.10 -0.01
06-11-2016 0.59161 0.03 06-11-2016 5330.90 0.01
07-11-2016 0.57268 -0.03 07-11-2016 5342.20 0.00
08-11-2016 0.55848 -0.02 08-11-2016 5238.30 -0.02
09-11-2016 0.58214 0.04 09-11-2016 5408.90 0.03
10-11-2016 0.58214 0.00 10-11-2016 5446.60 0.01
13-11-2016 0.57268 -0.02 13-11-2016 5420.30 0.00
14-11-2016 0.57268 0.00 14-11-2016 5399.80 0.00
15-11-2016 0.55848 -0.02 15-11-2016 5399.60 0.00
16-11-2016 0.54428 -0.03 16-11-2016 5408.90 0.00
17-11-2016 0.55848 0.03 17-11-2016 5427.50 0.00
20-11-2016 0.55375 -0.01 20-11-2016 5419.30 0.00
21-11-2016 0.54428 -0.02 21-11-2016 5480.60 0.01
22-11-2016 0.51588 -0.05 22-11-2016 5549.90 0.01
23-11-2016 0.47802 -0.07 23-11-2016 5549.00 0.00
24-11-2016 0.52062 0.09 24-11-2016 5570.50 0.00
27-11-2016 0.53955 0.04 27-11-2016 5532.60 -0.01
28-11-2016 0.53955 0.00 28-11-2016 5520.50 0.00
Finance For Business
22
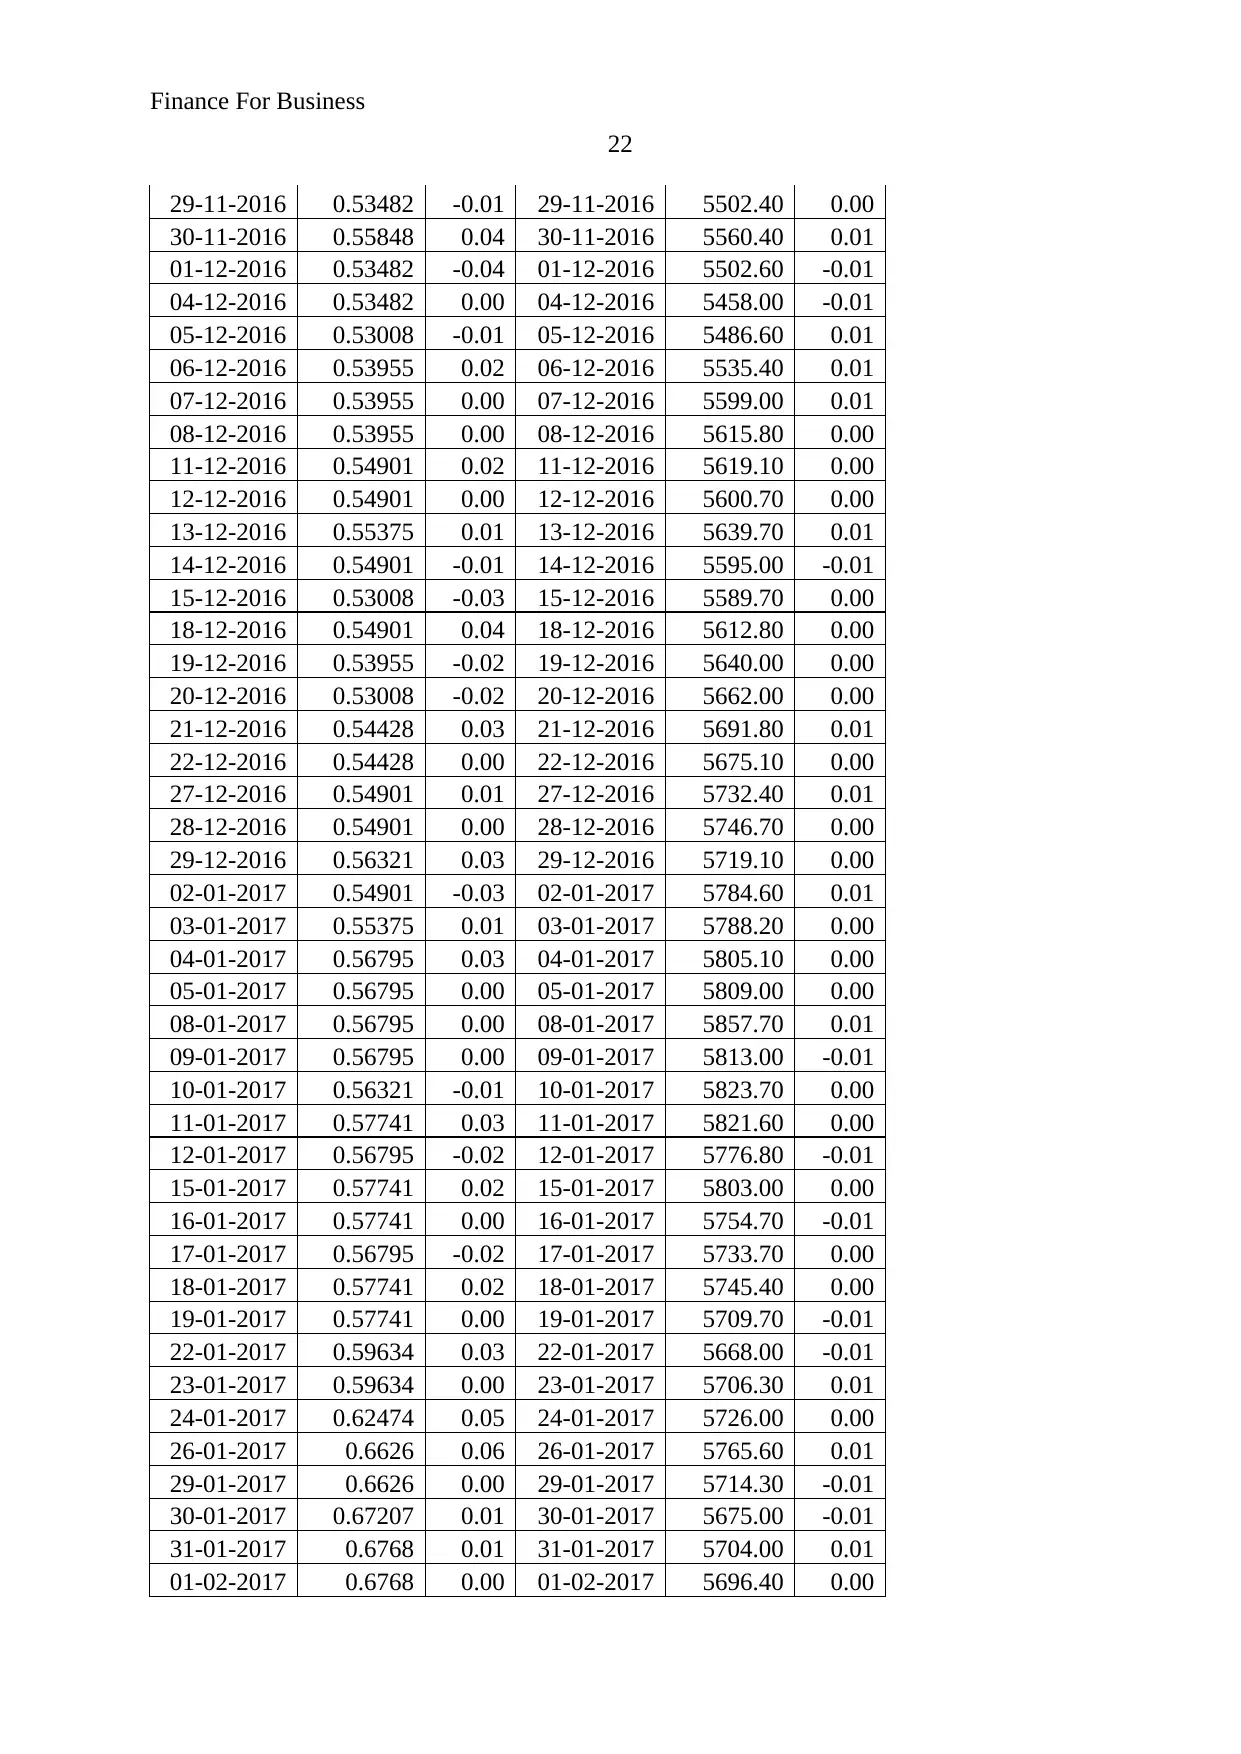
29-11-2016 0.53482 -0.01 29-11-2016 5502.40 0.00
30-11-2016 0.55848 0.04 30-11-2016 5560.40 0.01
01-12-2016 0.53482 -0.04 01-12-2016 5502.60 -0.01
04-12-2016 0.53482 0.00 04-12-2016 5458.00 -0.01
05-12-2016 0.53008 -0.01 05-12-2016 5486.60 0.01
06-12-2016 0.53955 0.02 06-12-2016 5535.40 0.01
07-12-2016 0.53955 0.00 07-12-2016 5599.00 0.01
08-12-2016 0.53955 0.00 08-12-2016 5615.80 0.00
11-12-2016 0.54901 0.02 11-12-2016 5619.10 0.00
12-12-2016 0.54901 0.00 12-12-2016 5600.70 0.00
13-12-2016 0.55375 0.01 13-12-2016 5639.70 0.01
14-12-2016 0.54901 -0.01 14-12-2016 5595.00 -0.01
15-12-2016 0.53008 -0.03 15-12-2016 5589.70 0.00
18-12-2016 0.54901 0.04 18-12-2016 5612.80 0.00
19-12-2016 0.53955 -0.02 19-12-2016 5640.00 0.00
20-12-2016 0.53008 -0.02 20-12-2016 5662.00 0.00
21-12-2016 0.54428 0.03 21-12-2016 5691.80 0.01
22-12-2016 0.54428 0.00 22-12-2016 5675.10 0.00
27-12-2016 0.54901 0.01 27-12-2016 5732.40 0.01
28-12-2016 0.54901 0.00 28-12-2016 5746.70 0.00
29-12-2016 0.56321 0.03 29-12-2016 5719.10 0.00
02-01-2017 0.54901 -0.03 02-01-2017 5784.60 0.01
03-01-2017 0.55375 0.01 03-01-2017 5788.20 0.00
04-01-2017 0.56795 0.03 04-01-2017 5805.10 0.00
05-01-2017 0.56795 0.00 05-01-2017 5809.00 0.00
08-01-2017 0.56795 0.00 08-01-2017 5857.70 0.01
09-01-2017 0.56795 0.00 09-01-2017 5813.00 -0.01
10-01-2017 0.56321 -0.01 10-01-2017 5823.70 0.00
11-01-2017 0.57741 0.03 11-01-2017 5821.60 0.00
12-01-2017 0.56795 -0.02 12-01-2017 5776.80 -0.01
15-01-2017 0.57741 0.02 15-01-2017 5803.00 0.00
16-01-2017 0.57741 0.00 16-01-2017 5754.70 -0.01
17-01-2017 0.56795 -0.02 17-01-2017 5733.70 0.00
18-01-2017 0.57741 0.02 18-01-2017 5745.40 0.00
19-01-2017 0.57741 0.00 19-01-2017 5709.70 -0.01
22-01-2017 0.59634 0.03 22-01-2017 5668.00 -0.01
23-01-2017 0.59634 0.00 23-01-2017 5706.30 0.01
24-01-2017 0.62474 0.05 24-01-2017 5726.00 0.00
26-01-2017 0.6626 0.06 26-01-2017 5765.60 0.01
29-01-2017 0.6626 0.00 29-01-2017 5714.30 -0.01
30-01-2017 0.67207 0.01 30-01-2017 5675.00 -0.01
31-01-2017 0.6768 0.01 31-01-2017 5704.00 0.01
01-02-2017 0.6768 0.00 01-02-2017 5696.40 0.00
22
29-11-2016 0.53482 -0.01 29-11-2016 5502.40 0.00
30-11-2016 0.55848 0.04 30-11-2016 5560.40 0.01
01-12-2016 0.53482 -0.04 01-12-2016 5502.60 -0.01
04-12-2016 0.53482 0.00 04-12-2016 5458.00 -0.01
05-12-2016 0.53008 -0.01 05-12-2016 5486.60 0.01
06-12-2016 0.53955 0.02 06-12-2016 5535.40 0.01
07-12-2016 0.53955 0.00 07-12-2016 5599.00 0.01
08-12-2016 0.53955 0.00 08-12-2016 5615.80 0.00
11-12-2016 0.54901 0.02 11-12-2016 5619.10 0.00
12-12-2016 0.54901 0.00 12-12-2016 5600.70 0.00
13-12-2016 0.55375 0.01 13-12-2016 5639.70 0.01
14-12-2016 0.54901 -0.01 14-12-2016 5595.00 -0.01
15-12-2016 0.53008 -0.03 15-12-2016 5589.70 0.00
18-12-2016 0.54901 0.04 18-12-2016 5612.80 0.00
19-12-2016 0.53955 -0.02 19-12-2016 5640.00 0.00
20-12-2016 0.53008 -0.02 20-12-2016 5662.00 0.00
21-12-2016 0.54428 0.03 21-12-2016 5691.80 0.01
22-12-2016 0.54428 0.00 22-12-2016 5675.10 0.00
27-12-2016 0.54901 0.01 27-12-2016 5732.40 0.01
28-12-2016 0.54901 0.00 28-12-2016 5746.70 0.00
29-12-2016 0.56321 0.03 29-12-2016 5719.10 0.00
02-01-2017 0.54901 -0.03 02-01-2017 5784.60 0.01
03-01-2017 0.55375 0.01 03-01-2017 5788.20 0.00
04-01-2017 0.56795 0.03 04-01-2017 5805.10 0.00
05-01-2017 0.56795 0.00 05-01-2017 5809.00 0.00
08-01-2017 0.56795 0.00 08-01-2017 5857.70 0.01
09-01-2017 0.56795 0.00 09-01-2017 5813.00 -0.01
10-01-2017 0.56321 -0.01 10-01-2017 5823.70 0.00
11-01-2017 0.57741 0.03 11-01-2017 5821.60 0.00
12-01-2017 0.56795 -0.02 12-01-2017 5776.80 -0.01
15-01-2017 0.57741 0.02 15-01-2017 5803.00 0.00
16-01-2017 0.57741 0.00 16-01-2017 5754.70 -0.01
17-01-2017 0.56795 -0.02 17-01-2017 5733.70 0.00
18-01-2017 0.57741 0.02 18-01-2017 5745.40 0.00
19-01-2017 0.57741 0.00 19-01-2017 5709.70 -0.01
22-01-2017 0.59634 0.03 22-01-2017 5668.00 -0.01
23-01-2017 0.59634 0.00 23-01-2017 5706.30 0.01
24-01-2017 0.62474 0.05 24-01-2017 5726.00 0.00
26-01-2017 0.6626 0.06 26-01-2017 5765.60 0.01
29-01-2017 0.6626 0.00 29-01-2017 5714.30 -0.01
30-01-2017 0.67207 0.01 30-01-2017 5675.00 -0.01
31-01-2017 0.6768 0.01 31-01-2017 5704.00 0.01
01-02-2017 0.6768 0.00 01-02-2017 5696.40 0.00
Secure Best Marks with AI Grader
Need help grading? Try our AI Grader for instant feedback on your assignments.
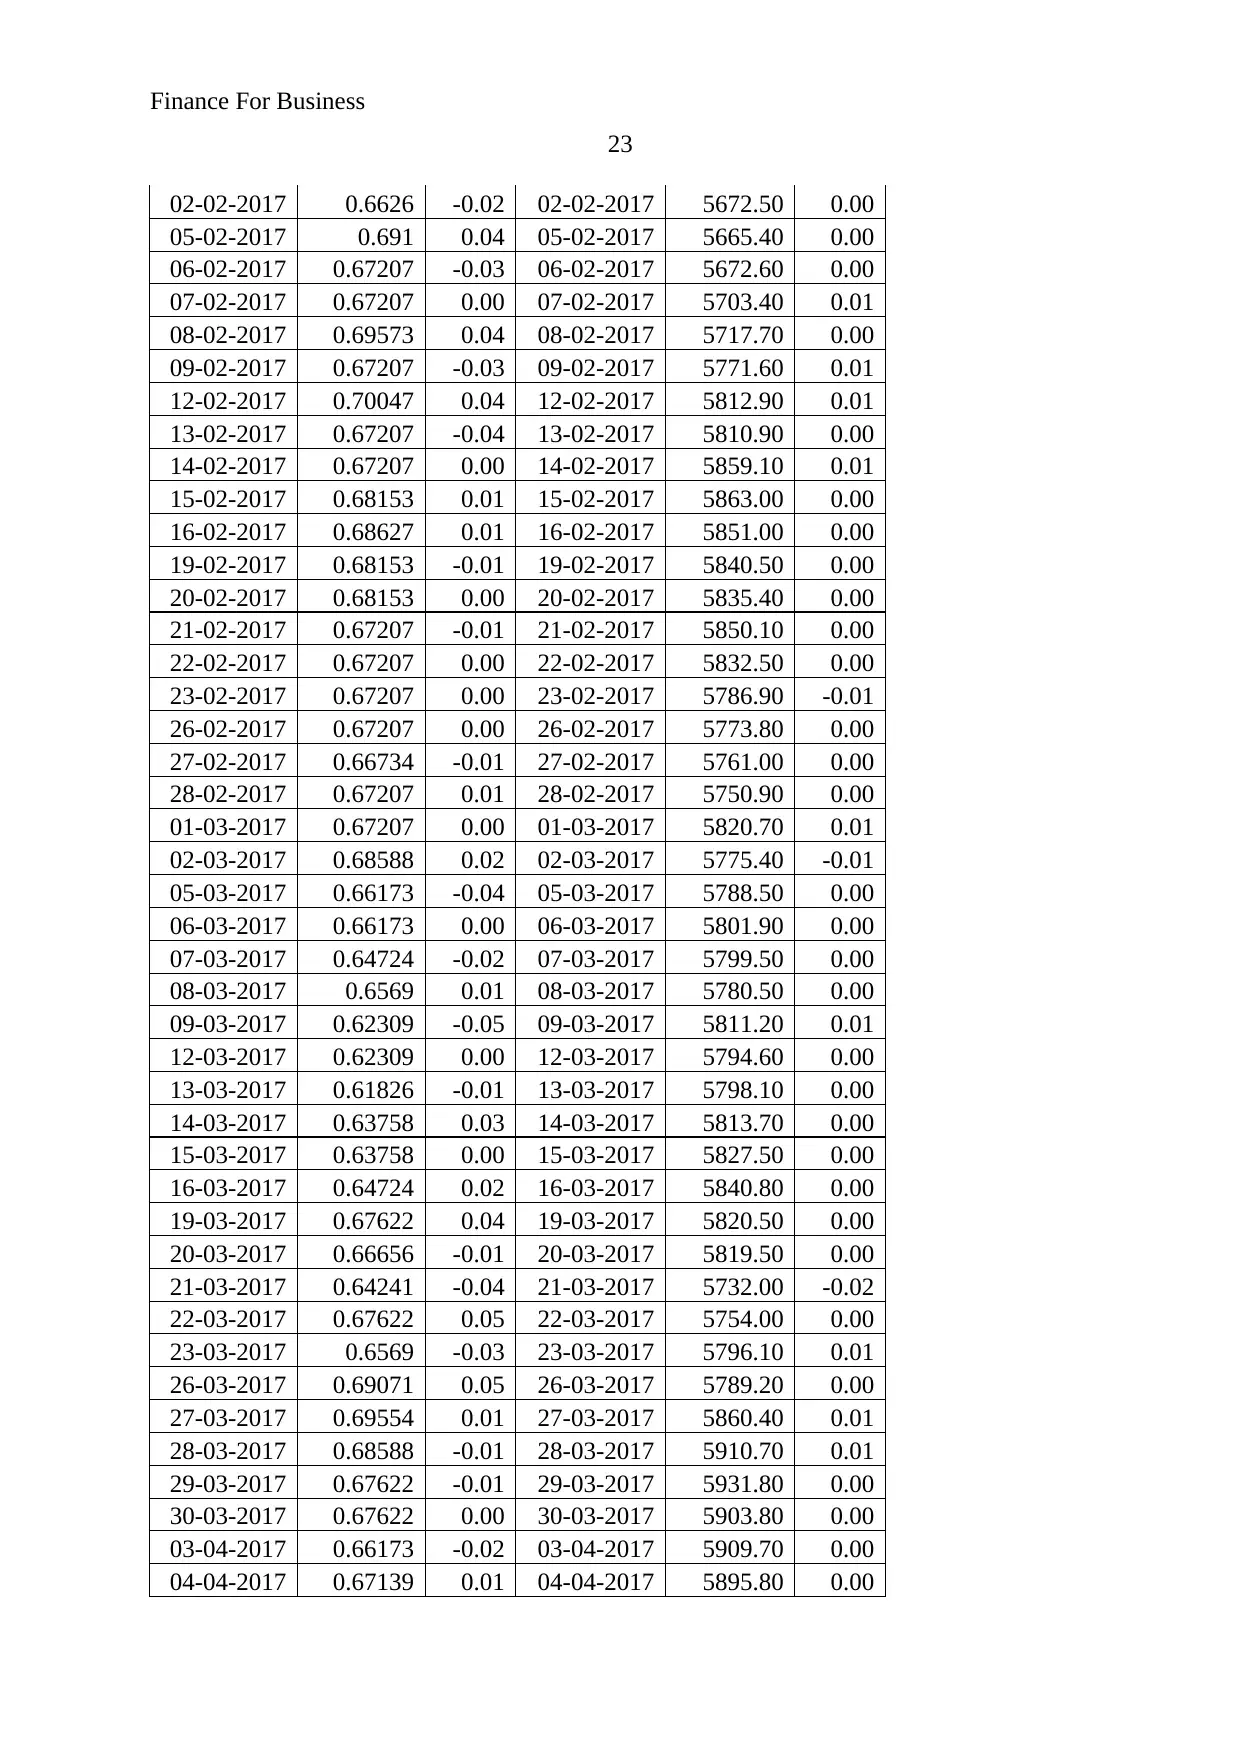
Finance For Business
23
02-02-2017 0.6626 -0.02 02-02-2017 5672.50 0.00
05-02-2017 0.691 0.04 05-02-2017 5665.40 0.00
06-02-2017 0.67207 -0.03 06-02-2017 5672.60 0.00
07-02-2017 0.67207 0.00 07-02-2017 5703.40 0.01
08-02-2017 0.69573 0.04 08-02-2017 5717.70 0.00
09-02-2017 0.67207 -0.03 09-02-2017 5771.60 0.01
12-02-2017 0.70047 0.04 12-02-2017 5812.90 0.01
13-02-2017 0.67207 -0.04 13-02-2017 5810.90 0.00
14-02-2017 0.67207 0.00 14-02-2017 5859.10 0.01
15-02-2017 0.68153 0.01 15-02-2017 5863.00 0.00
16-02-2017 0.68627 0.01 16-02-2017 5851.00 0.00
19-02-2017 0.68153 -0.01 19-02-2017 5840.50 0.00
20-02-2017 0.68153 0.00 20-02-2017 5835.40 0.00
21-02-2017 0.67207 -0.01 21-02-2017 5850.10 0.00
22-02-2017 0.67207 0.00 22-02-2017 5832.50 0.00
23-02-2017 0.67207 0.00 23-02-2017 5786.90 -0.01
26-02-2017 0.67207 0.00 26-02-2017 5773.80 0.00
27-02-2017 0.66734 -0.01 27-02-2017 5761.00 0.00
28-02-2017 0.67207 0.01 28-02-2017 5750.90 0.00
01-03-2017 0.67207 0.00 01-03-2017 5820.70 0.01
02-03-2017 0.68588 0.02 02-03-2017 5775.40 -0.01
05-03-2017 0.66173 -0.04 05-03-2017 5788.50 0.00
06-03-2017 0.66173 0.00 06-03-2017 5801.90 0.00
07-03-2017 0.64724 -0.02 07-03-2017 5799.50 0.00
08-03-2017 0.6569 0.01 08-03-2017 5780.50 0.00
09-03-2017 0.62309 -0.05 09-03-2017 5811.20 0.01
12-03-2017 0.62309 0.00 12-03-2017 5794.60 0.00
13-03-2017 0.61826 -0.01 13-03-2017 5798.10 0.00
14-03-2017 0.63758 0.03 14-03-2017 5813.70 0.00
15-03-2017 0.63758 0.00 15-03-2017 5827.50 0.00
16-03-2017 0.64724 0.02 16-03-2017 5840.80 0.00
19-03-2017 0.67622 0.04 19-03-2017 5820.50 0.00
20-03-2017 0.66656 -0.01 20-03-2017 5819.50 0.00
21-03-2017 0.64241 -0.04 21-03-2017 5732.00 -0.02
22-03-2017 0.67622 0.05 22-03-2017 5754.00 0.00
23-03-2017 0.6569 -0.03 23-03-2017 5796.10 0.01
26-03-2017 0.69071 0.05 26-03-2017 5789.20 0.00
27-03-2017 0.69554 0.01 27-03-2017 5860.40 0.01
28-03-2017 0.68588 -0.01 28-03-2017 5910.70 0.01
29-03-2017 0.67622 -0.01 29-03-2017 5931.80 0.00
30-03-2017 0.67622 0.00 30-03-2017 5903.80 0.00
03-04-2017 0.66173 -0.02 03-04-2017 5909.70 0.00
04-04-2017 0.67139 0.01 04-04-2017 5895.80 0.00
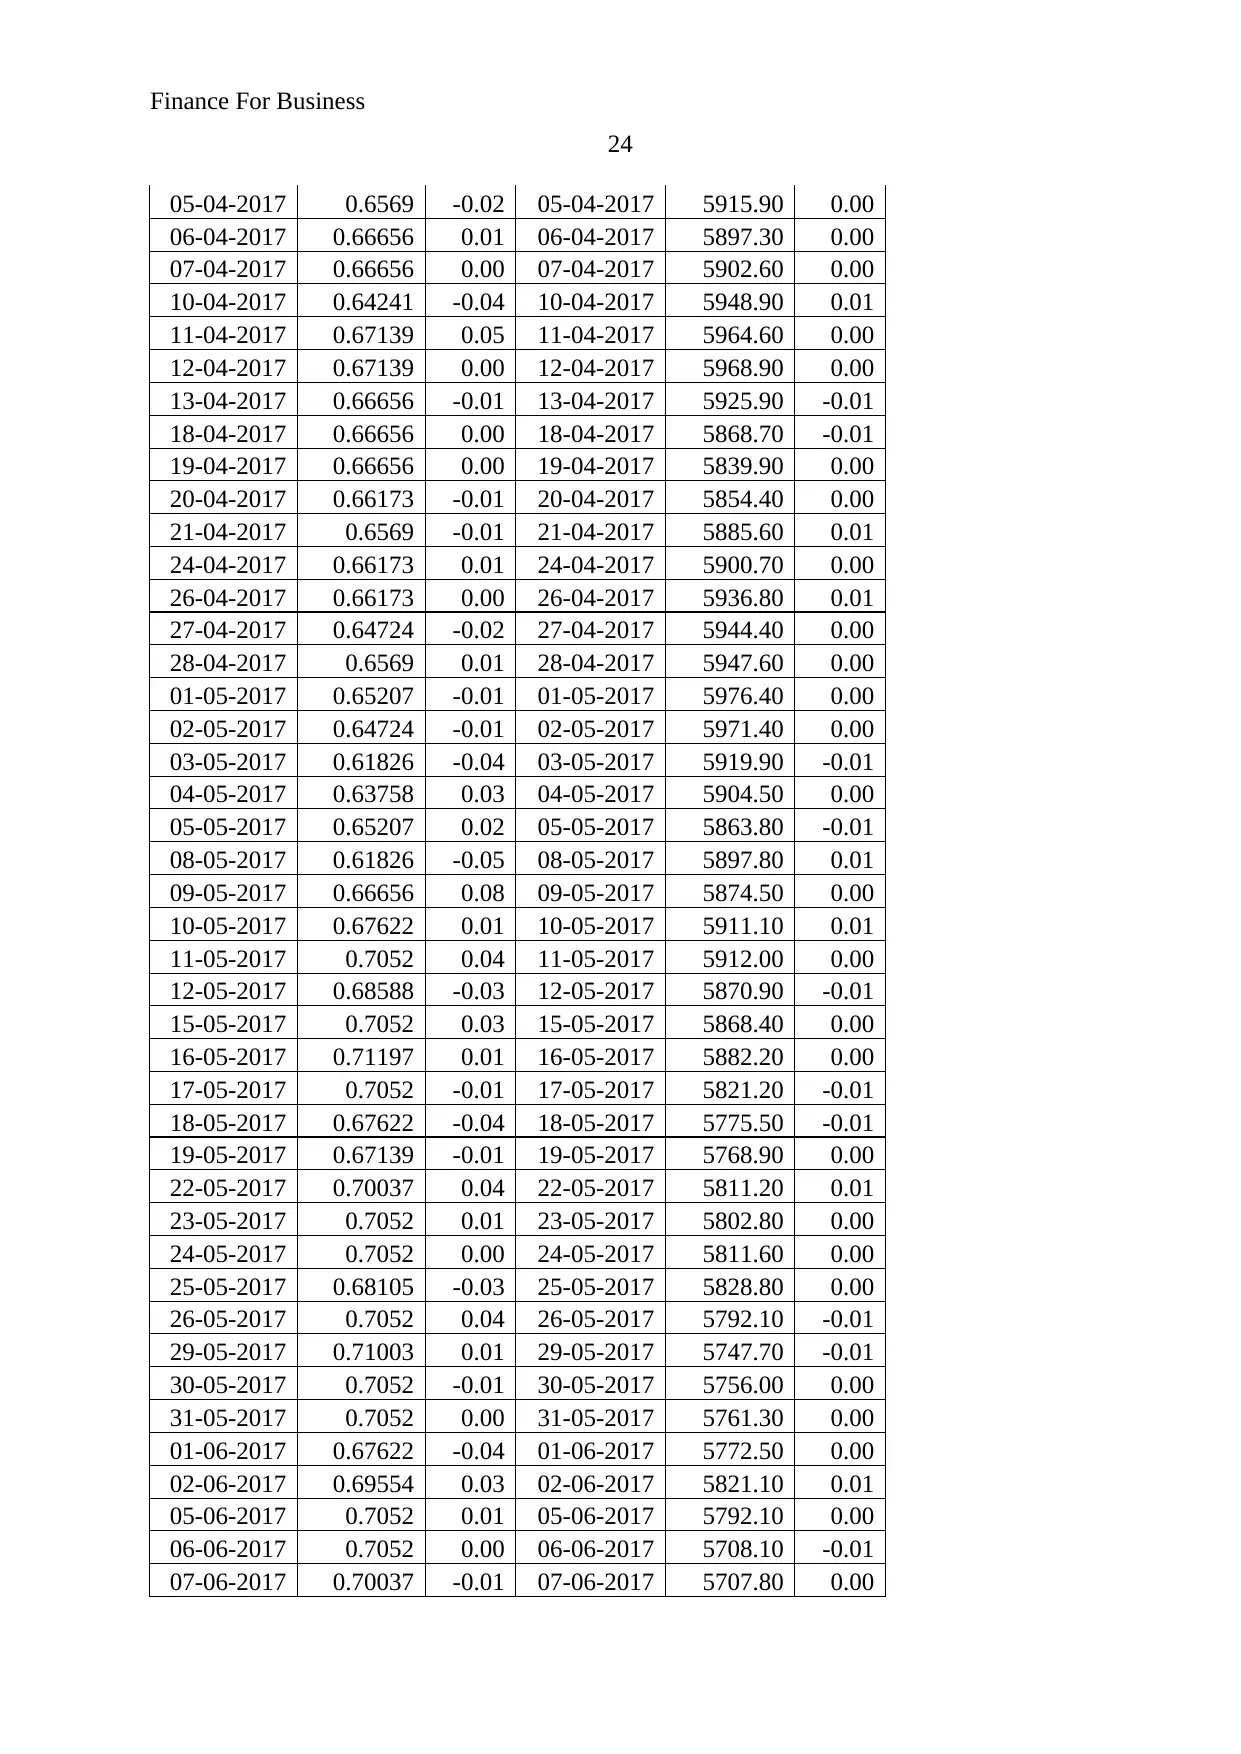
Finance For Business
24
05-04-2017 0.6569 -0.02 05-04-2017 5915.90 0.00
06-04-2017 0.66656 0.01 06-04-2017 5897.30 0.00
07-04-2017 0.66656 0.00 07-04-2017 5902.60 0.00
10-04-2017 0.64241 -0.04 10-04-2017 5948.90 0.01
11-04-2017 0.67139 0.05 11-04-2017 5964.60 0.00
12-04-2017 0.67139 0.00 12-04-2017 5968.90 0.00
13-04-2017 0.66656 -0.01 13-04-2017 5925.90 -0.01
18-04-2017 0.66656 0.00 18-04-2017 5868.70 -0.01
19-04-2017 0.66656 0.00 19-04-2017 5839.90 0.00
20-04-2017 0.66173 -0.01 20-04-2017 5854.40 0.00
21-04-2017 0.6569 -0.01 21-04-2017 5885.60 0.01
24-04-2017 0.66173 0.01 24-04-2017 5900.70 0.00
26-04-2017 0.66173 0.00 26-04-2017 5936.80 0.01
27-04-2017 0.64724 -0.02 27-04-2017 5944.40 0.00
28-04-2017 0.6569 0.01 28-04-2017 5947.60 0.00
01-05-2017 0.65207 -0.01 01-05-2017 5976.40 0.00
02-05-2017 0.64724 -0.01 02-05-2017 5971.40 0.00
03-05-2017 0.61826 -0.04 03-05-2017 5919.90 -0.01
04-05-2017 0.63758 0.03 04-05-2017 5904.50 0.00
05-05-2017 0.65207 0.02 05-05-2017 5863.80 -0.01
08-05-2017 0.61826 -0.05 08-05-2017 5897.80 0.01
09-05-2017 0.66656 0.08 09-05-2017 5874.50 0.00
10-05-2017 0.67622 0.01 10-05-2017 5911.10 0.01
11-05-2017 0.7052 0.04 11-05-2017 5912.00 0.00
12-05-2017 0.68588 -0.03 12-05-2017 5870.90 -0.01
15-05-2017 0.7052 0.03 15-05-2017 5868.40 0.00
16-05-2017 0.71197 0.01 16-05-2017 5882.20 0.00
17-05-2017 0.7052 -0.01 17-05-2017 5821.20 -0.01
18-05-2017 0.67622 -0.04 18-05-2017 5775.50 -0.01
19-05-2017 0.67139 -0.01 19-05-2017 5768.90 0.00
22-05-2017 0.70037 0.04 22-05-2017 5811.20 0.01
23-05-2017 0.7052 0.01 23-05-2017 5802.80 0.00
24-05-2017 0.7052 0.00 24-05-2017 5811.60 0.00
25-05-2017 0.68105 -0.03 25-05-2017 5828.80 0.00
26-05-2017 0.7052 0.04 26-05-2017 5792.10 -0.01
29-05-2017 0.71003 0.01 29-05-2017 5747.70 -0.01
30-05-2017 0.7052 -0.01 30-05-2017 5756.00 0.00
31-05-2017 0.7052 0.00 31-05-2017 5761.30 0.00
01-06-2017 0.67622 -0.04 01-06-2017 5772.50 0.00
02-06-2017 0.69554 0.03 02-06-2017 5821.10 0.01
05-06-2017 0.7052 0.01 05-06-2017 5792.10 0.00
06-06-2017 0.7052 0.00 06-06-2017 5708.10 -0.01
07-06-2017 0.70037 -0.01 07-06-2017 5707.80 0.00
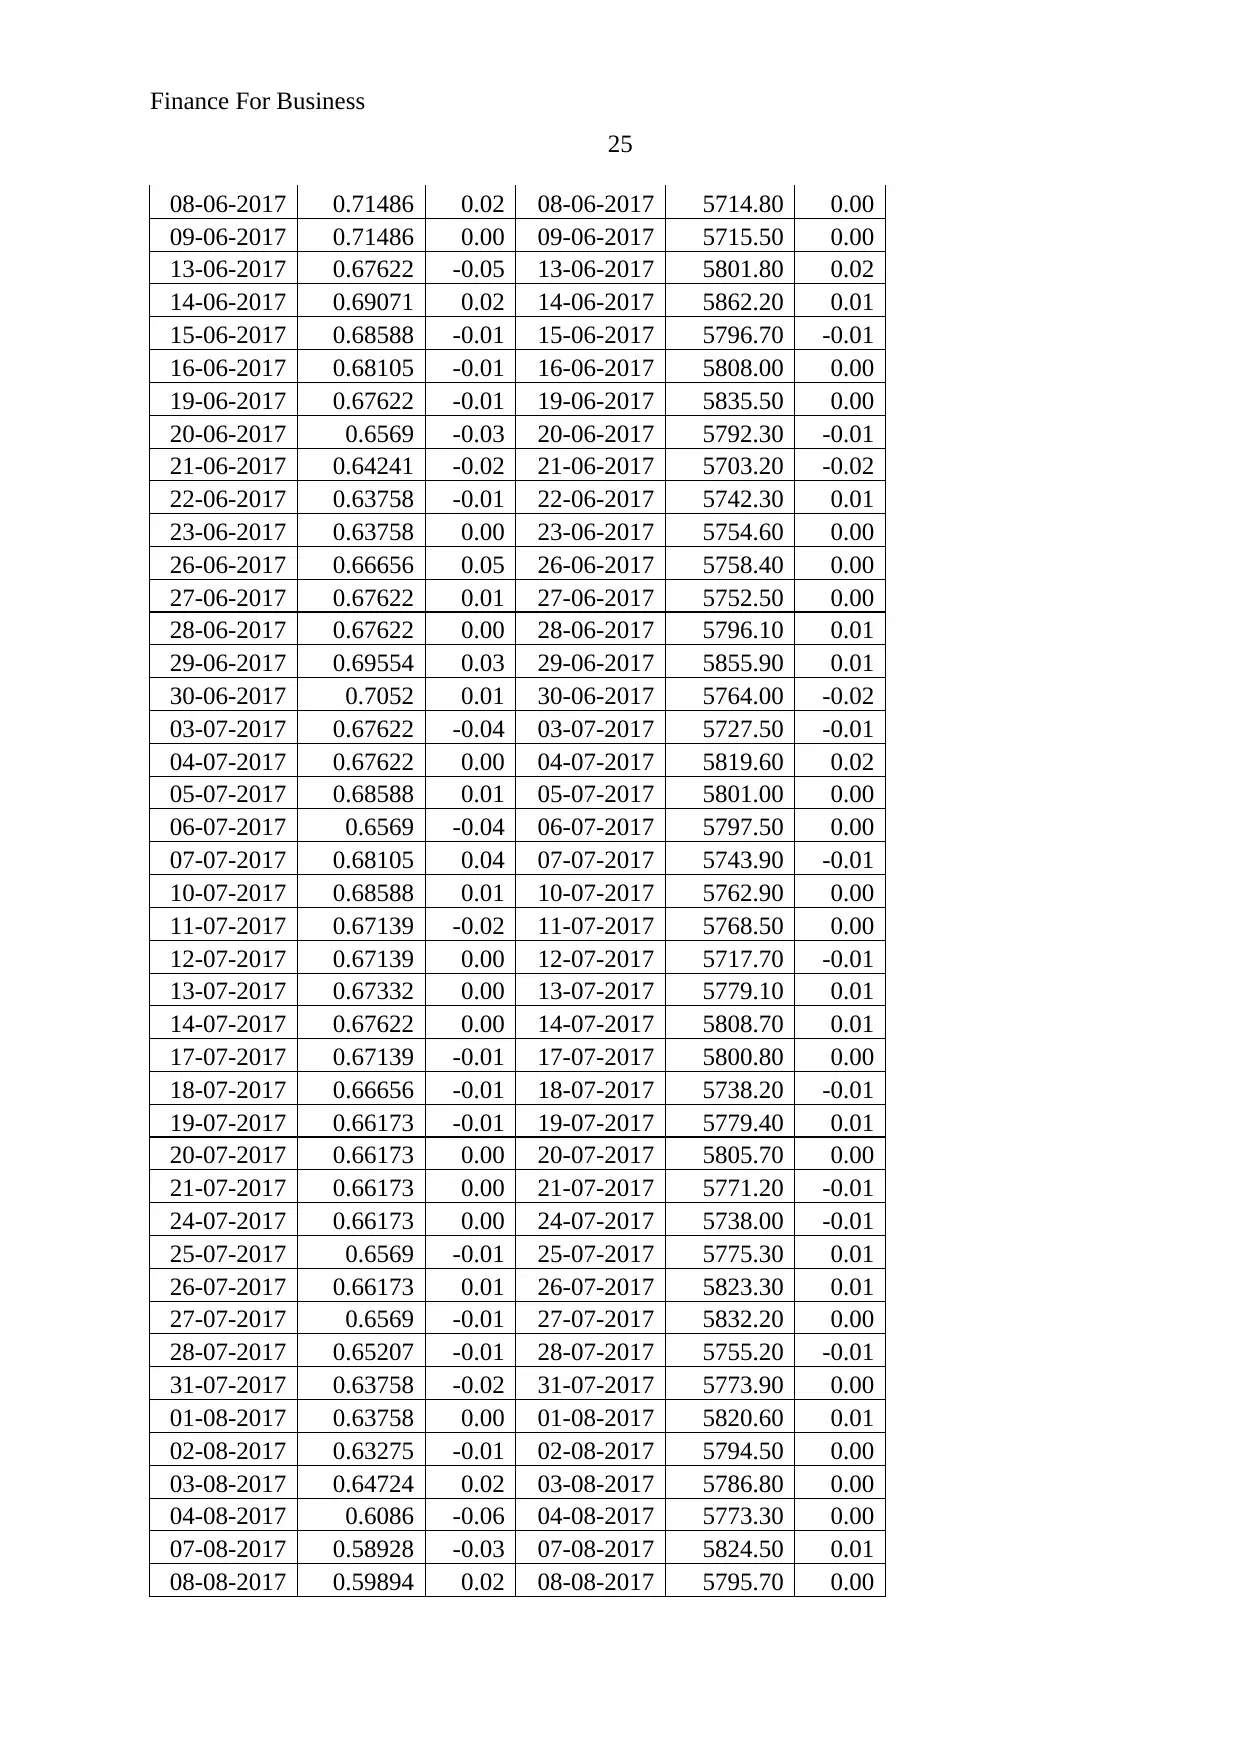
Finance For Business
25
08-06-2017 0.71486 0.02 08-06-2017 5714.80 0.00
09-06-2017 0.71486 0.00 09-06-2017 5715.50 0.00
13-06-2017 0.67622 -0.05 13-06-2017 5801.80 0.02
14-06-2017 0.69071 0.02 14-06-2017 5862.20 0.01
15-06-2017 0.68588 -0.01 15-06-2017 5796.70 -0.01
16-06-2017 0.68105 -0.01 16-06-2017 5808.00 0.00
19-06-2017 0.67622 -0.01 19-06-2017 5835.50 0.00
20-06-2017 0.6569 -0.03 20-06-2017 5792.30 -0.01
21-06-2017 0.64241 -0.02 21-06-2017 5703.20 -0.02
22-06-2017 0.63758 -0.01 22-06-2017 5742.30 0.01
23-06-2017 0.63758 0.00 23-06-2017 5754.60 0.00
26-06-2017 0.66656 0.05 26-06-2017 5758.40 0.00
27-06-2017 0.67622 0.01 27-06-2017 5752.50 0.00
28-06-2017 0.67622 0.00 28-06-2017 5796.10 0.01
29-06-2017 0.69554 0.03 29-06-2017 5855.90 0.01
30-06-2017 0.7052 0.01 30-06-2017 5764.00 -0.02
03-07-2017 0.67622 -0.04 03-07-2017 5727.50 -0.01
04-07-2017 0.67622 0.00 04-07-2017 5819.60 0.02
05-07-2017 0.68588 0.01 05-07-2017 5801.00 0.00
06-07-2017 0.6569 -0.04 06-07-2017 5797.50 0.00
07-07-2017 0.68105 0.04 07-07-2017 5743.90 -0.01
10-07-2017 0.68588 0.01 10-07-2017 5762.90 0.00
11-07-2017 0.67139 -0.02 11-07-2017 5768.50 0.00
12-07-2017 0.67139 0.00 12-07-2017 5717.70 -0.01
13-07-2017 0.67332 0.00 13-07-2017 5779.10 0.01
14-07-2017 0.67622 0.00 14-07-2017 5808.70 0.01
17-07-2017 0.67139 -0.01 17-07-2017 5800.80 0.00
18-07-2017 0.66656 -0.01 18-07-2017 5738.20 -0.01
19-07-2017 0.66173 -0.01 19-07-2017 5779.40 0.01
20-07-2017 0.66173 0.00 20-07-2017 5805.70 0.00
21-07-2017 0.66173 0.00 21-07-2017 5771.20 -0.01
24-07-2017 0.66173 0.00 24-07-2017 5738.00 -0.01
25-07-2017 0.6569 -0.01 25-07-2017 5775.30 0.01
26-07-2017 0.66173 0.01 26-07-2017 5823.30 0.01
27-07-2017 0.6569 -0.01 27-07-2017 5832.20 0.00
28-07-2017 0.65207 -0.01 28-07-2017 5755.20 -0.01
31-07-2017 0.63758 -0.02 31-07-2017 5773.90 0.00
01-08-2017 0.63758 0.00 01-08-2017 5820.60 0.01
02-08-2017 0.63275 -0.01 02-08-2017 5794.50 0.00
03-08-2017 0.64724 0.02 03-08-2017 5786.80 0.00
04-08-2017 0.6086 -0.06 04-08-2017 5773.30 0.00
07-08-2017 0.58928 -0.03 07-08-2017 5824.50 0.01
08-08-2017 0.59894 0.02 08-08-2017 5795.70 0.00
Paraphrase This Document
Need a fresh take? Get an instant paraphrase of this document with our AI Paraphraser
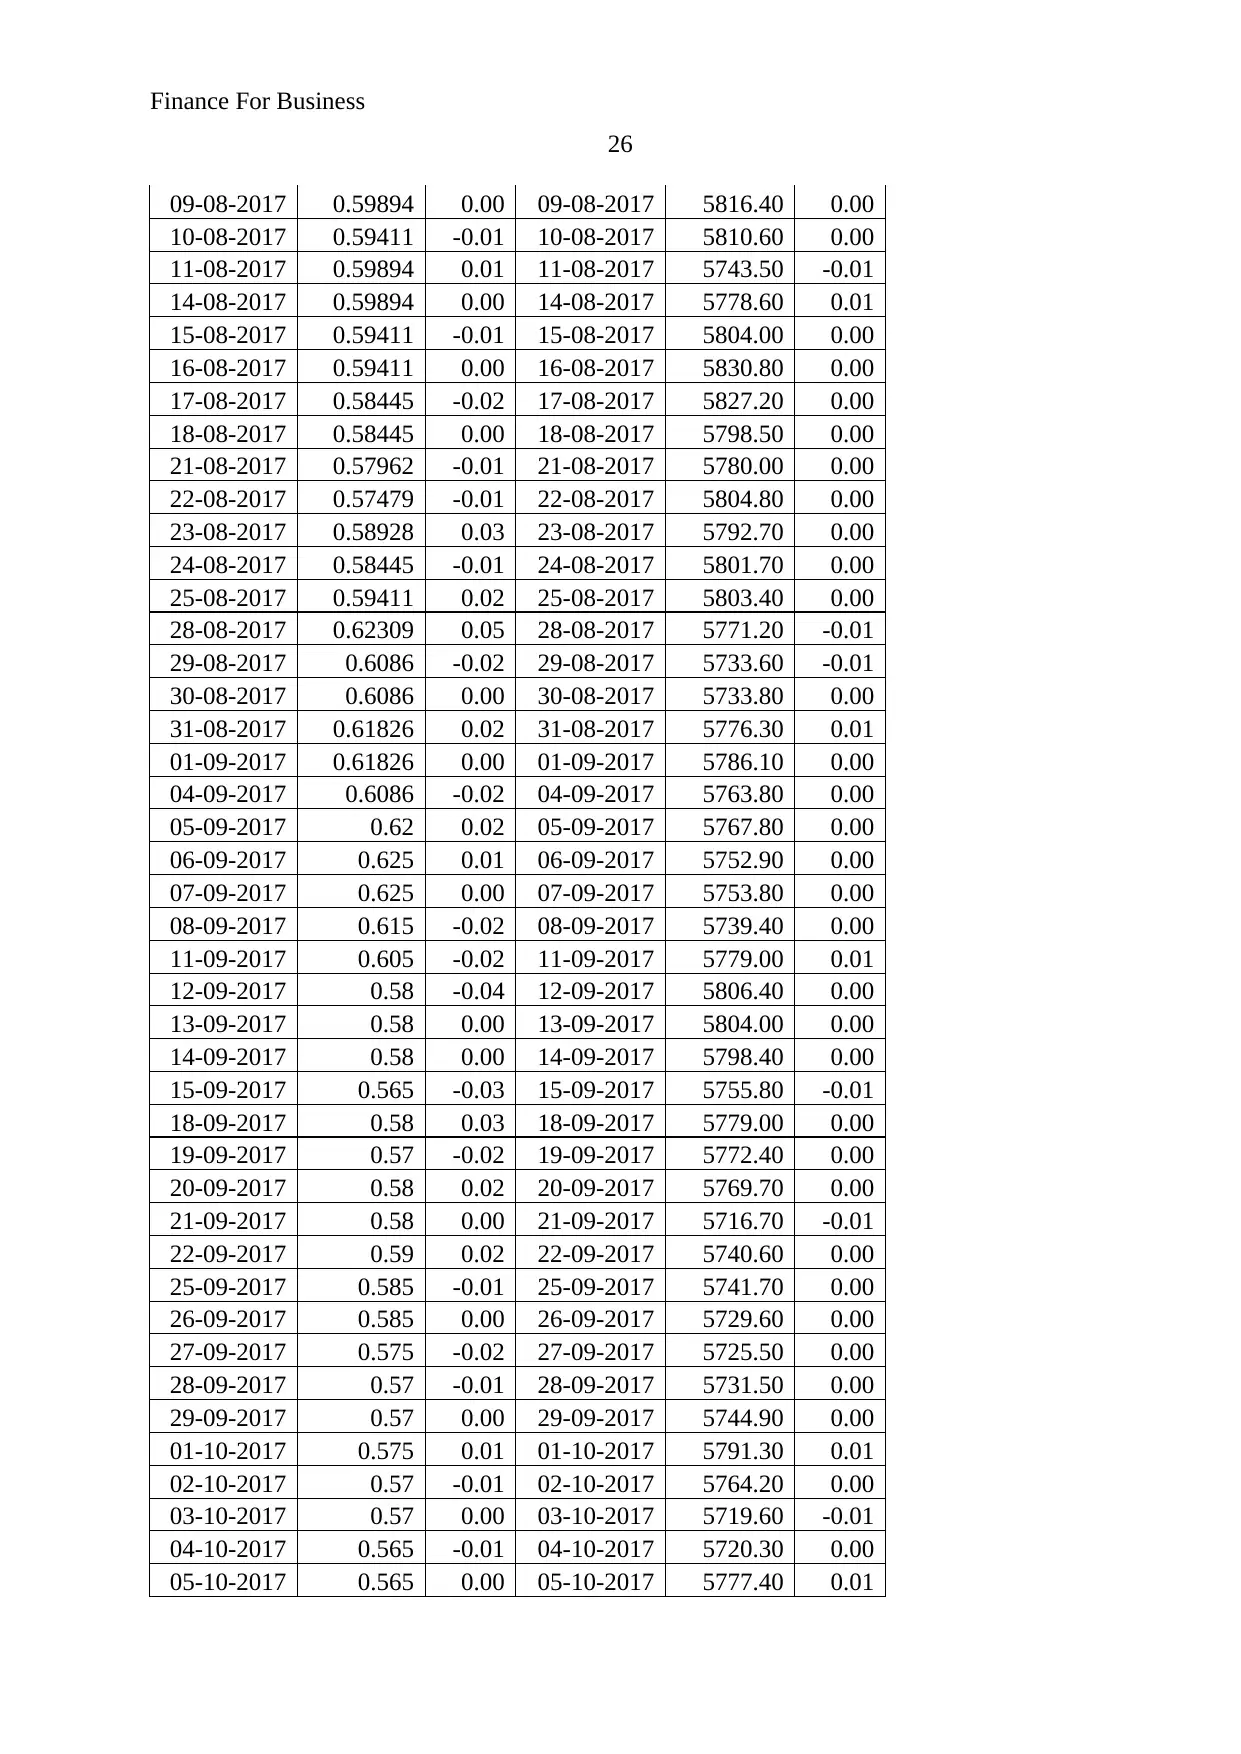
Finance For Business
26
09-08-2017 0.59894 0.00 09-08-2017 5816.40 0.00
10-08-2017 0.59411 -0.01 10-08-2017 5810.60 0.00
11-08-2017 0.59894 0.01 11-08-2017 5743.50 -0.01
14-08-2017 0.59894 0.00 14-08-2017 5778.60 0.01
15-08-2017 0.59411 -0.01 15-08-2017 5804.00 0.00
16-08-2017 0.59411 0.00 16-08-2017 5830.80 0.00
17-08-2017 0.58445 -0.02 17-08-2017 5827.20 0.00
18-08-2017 0.58445 0.00 18-08-2017 5798.50 0.00
21-08-2017 0.57962 -0.01 21-08-2017 5780.00 0.00
22-08-2017 0.57479 -0.01 22-08-2017 5804.80 0.00
23-08-2017 0.58928 0.03 23-08-2017 5792.70 0.00
24-08-2017 0.58445 -0.01 24-08-2017 5801.70 0.00
25-08-2017 0.59411 0.02 25-08-2017 5803.40 0.00
28-08-2017 0.62309 0.05 28-08-2017 5771.20 -0.01
29-08-2017 0.6086 -0.02 29-08-2017 5733.60 -0.01
30-08-2017 0.6086 0.00 30-08-2017 5733.80 0.00
31-08-2017 0.61826 0.02 31-08-2017 5776.30 0.01
01-09-2017 0.61826 0.00 01-09-2017 5786.10 0.00
04-09-2017 0.6086 -0.02 04-09-2017 5763.80 0.00
05-09-2017 0.62 0.02 05-09-2017 5767.80 0.00
06-09-2017 0.625 0.01 06-09-2017 5752.90 0.00
07-09-2017 0.625 0.00 07-09-2017 5753.80 0.00
08-09-2017 0.615 -0.02 08-09-2017 5739.40 0.00
11-09-2017 0.605 -0.02 11-09-2017 5779.00 0.01
12-09-2017 0.58 -0.04 12-09-2017 5806.40 0.00
13-09-2017 0.58 0.00 13-09-2017 5804.00 0.00
14-09-2017 0.58 0.00 14-09-2017 5798.40 0.00
15-09-2017 0.565 -0.03 15-09-2017 5755.80 -0.01
18-09-2017 0.58 0.03 18-09-2017 5779.00 0.00
19-09-2017 0.57 -0.02 19-09-2017 5772.40 0.00
20-09-2017 0.58 0.02 20-09-2017 5769.70 0.00
21-09-2017 0.58 0.00 21-09-2017 5716.70 -0.01
22-09-2017 0.59 0.02 22-09-2017 5740.60 0.00
25-09-2017 0.585 -0.01 25-09-2017 5741.70 0.00
26-09-2017 0.585 0.00 26-09-2017 5729.60 0.00
27-09-2017 0.575 -0.02 27-09-2017 5725.50 0.00
28-09-2017 0.57 -0.01 28-09-2017 5731.50 0.00
29-09-2017 0.57 0.00 29-09-2017 5744.90 0.00
01-10-2017 0.575 0.01 01-10-2017 5791.30 0.01
02-10-2017 0.57 -0.01 02-10-2017 5764.20 0.00
03-10-2017 0.57 0.00 03-10-2017 5719.60 -0.01
04-10-2017 0.565 -0.01 04-10-2017 5720.30 0.00
05-10-2017 0.565 0.00 05-10-2017 5777.40 0.01
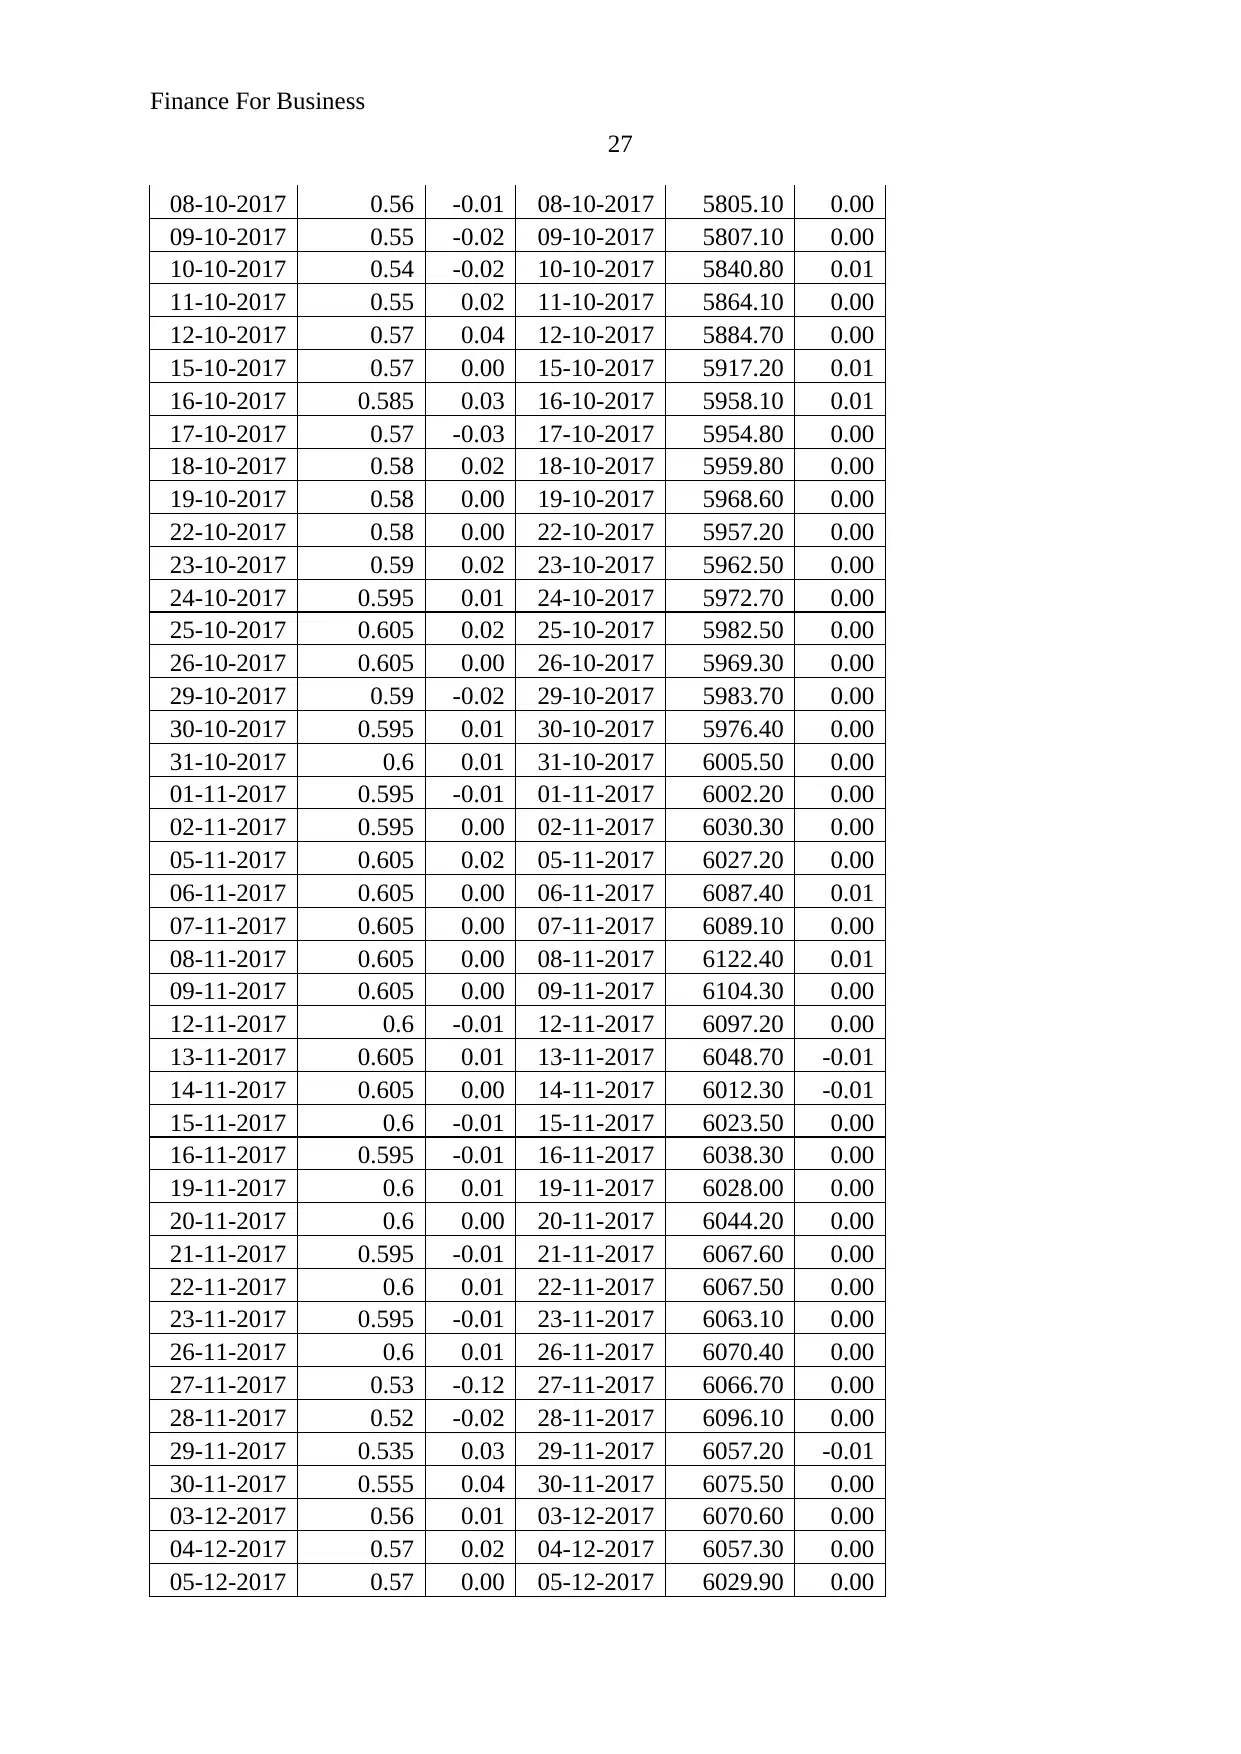
Finance For Business
27
08-10-2017 0.56 -0.01 08-10-2017 5805.10 0.00
09-10-2017 0.55 -0.02 09-10-2017 5807.10 0.00
10-10-2017 0.54 -0.02 10-10-2017 5840.80 0.01
11-10-2017 0.55 0.02 11-10-2017 5864.10 0.00
12-10-2017 0.57 0.04 12-10-2017 5884.70 0.00
15-10-2017 0.57 0.00 15-10-2017 5917.20 0.01
16-10-2017 0.585 0.03 16-10-2017 5958.10 0.01
17-10-2017 0.57 -0.03 17-10-2017 5954.80 0.00
18-10-2017 0.58 0.02 18-10-2017 5959.80 0.00
19-10-2017 0.58 0.00 19-10-2017 5968.60 0.00
22-10-2017 0.58 0.00 22-10-2017 5957.20 0.00
23-10-2017 0.59 0.02 23-10-2017 5962.50 0.00
24-10-2017 0.595 0.01 24-10-2017 5972.70 0.00
25-10-2017 0.605 0.02 25-10-2017 5982.50 0.00
26-10-2017 0.605 0.00 26-10-2017 5969.30 0.00
29-10-2017 0.59 -0.02 29-10-2017 5983.70 0.00
30-10-2017 0.595 0.01 30-10-2017 5976.40 0.00
31-10-2017 0.6 0.01 31-10-2017 6005.50 0.00
01-11-2017 0.595 -0.01 01-11-2017 6002.20 0.00
02-11-2017 0.595 0.00 02-11-2017 6030.30 0.00
05-11-2017 0.605 0.02 05-11-2017 6027.20 0.00
06-11-2017 0.605 0.00 06-11-2017 6087.40 0.01
07-11-2017 0.605 0.00 07-11-2017 6089.10 0.00
08-11-2017 0.605 0.00 08-11-2017 6122.40 0.01
09-11-2017 0.605 0.00 09-11-2017 6104.30 0.00
12-11-2017 0.6 -0.01 12-11-2017 6097.20 0.00
13-11-2017 0.605 0.01 13-11-2017 6048.70 -0.01
14-11-2017 0.605 0.00 14-11-2017 6012.30 -0.01
15-11-2017 0.6 -0.01 15-11-2017 6023.50 0.00
16-11-2017 0.595 -0.01 16-11-2017 6038.30 0.00
19-11-2017 0.6 0.01 19-11-2017 6028.00 0.00
20-11-2017 0.6 0.00 20-11-2017 6044.20 0.00
21-11-2017 0.595 -0.01 21-11-2017 6067.60 0.00
22-11-2017 0.6 0.01 22-11-2017 6067.50 0.00
23-11-2017 0.595 -0.01 23-11-2017 6063.10 0.00
26-11-2017 0.6 0.01 26-11-2017 6070.40 0.00
27-11-2017 0.53 -0.12 27-11-2017 6066.70 0.00
28-11-2017 0.52 -0.02 28-11-2017 6096.10 0.00
29-11-2017 0.535 0.03 29-11-2017 6057.20 -0.01
30-11-2017 0.555 0.04 30-11-2017 6075.50 0.00
03-12-2017 0.56 0.01 03-12-2017 6070.60 0.00
04-12-2017 0.57 0.02 04-12-2017 6057.30 0.00
05-12-2017 0.57 0.00 05-12-2017 6029.90 0.00
1 out of 27
Related Documents


Your All-in-One AI-Powered Toolkit for Academic Success.
+13062052269
info@desklib.com
Available 24*7 on WhatsApp / Email
![[object Object]](/_next/static/media/star-bottom.7253800d.svg)
Unlock your academic potential
© 2024 | Zucol Services PVT LTD | All rights reserved.